Energy Plots
Designed for customers in the energy market, the energy plots show the national renewable energy forecast from Meteomatics. In a new tab or panel, click on ”Energy Plot”.

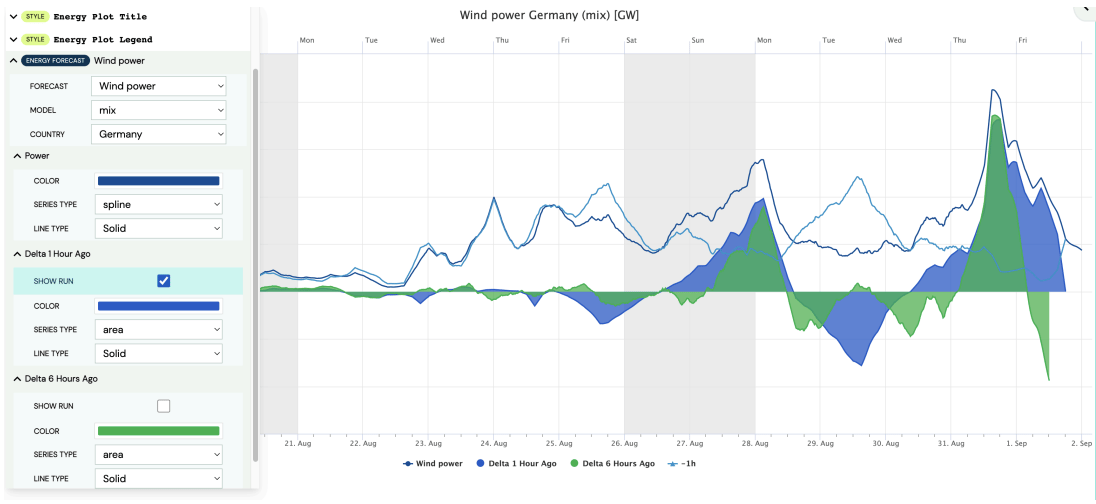
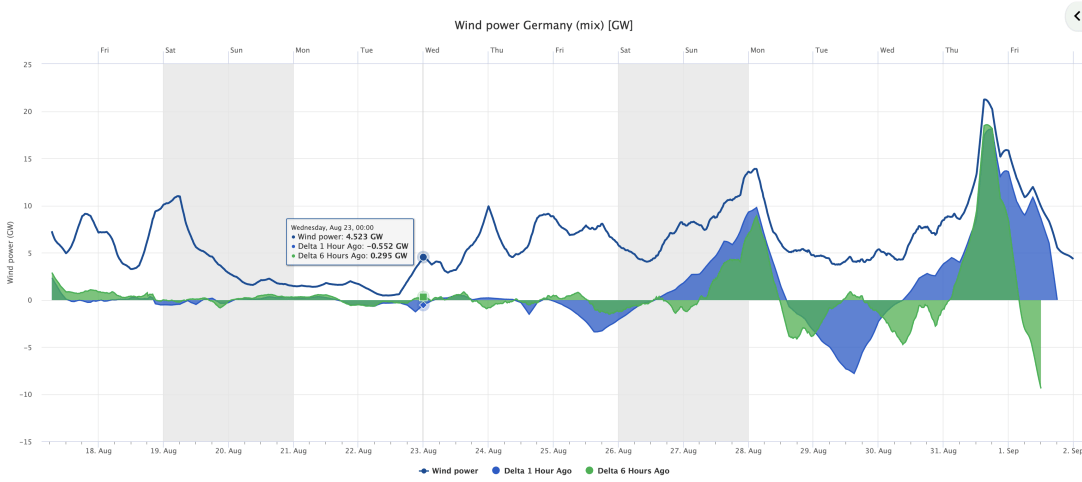
The default plot shows the wind power forecast for Germany over the next 2 weeks. The forecasted power from the latest model run is shown as a line. The difference between the forecast from the current run and the runs 1 and 6 hours ago is shown with the shaded lines ”Delta 1 hour ago” and ”Delta 6 hours ago”. These lines are an indicator of forecast confidence: if the difference between successive runs is very small, then the forecast confidence is high.


In the Layer Stack, the design of the title and legend can be changed under ”Style Energy Plot Title” and ”Style Energy Plot Legend” respectively. Under ”Energy Forecast”, the forecast can be changed from Wind to Solar, the model on which the forecast is based can be changed and the country can be changed. The available countries are those for which Meteomatics produces national-scale forecasts and will increase in the future. The line style of the lines can be changed for the power line and the delta lines.

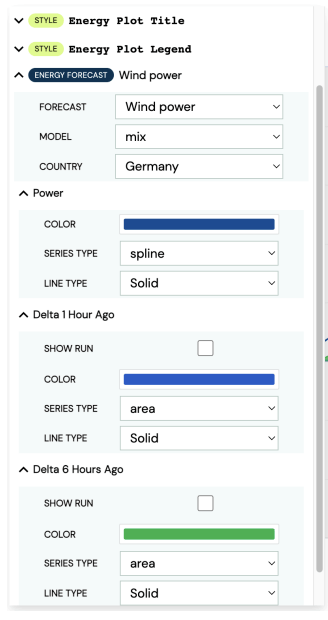

Clicking on ”Show Run” displays the power forecast for the model runs from 1 hour or 6 hours ago. The difference between this run line and the current forecast is what is shown by the corresponding delta line.