11/27/2023
What Is a Weather Map?

Energy Meteorologist at Meteomatics
A weather map is a graphical representation that displays weather conditions across a specific geographical area. The depicted weather events can pertain to the past, present, or future forecasts. From a meteorological perspective, a weather map illustrates the current state of the atmosphere over a larger region. It provides information about various weather parameters, such as temperature, wind speed, wind direction, or precipitation. Weather observations or anticipated changes in atmospheric conditions are represented symbolically or through colored contours.
What Are Weather Maps Used For?
Weather maps serve as essential tools for making informed decisions in complex environments.
Through clear animations and visualizations, weather maps provide easily understandable information, enabling quicker and more effective decision-making. By offering a broad view of changing weather conditions, they allow for the identification and reduction of risks, process improvement, and cost savings.
Weather maps are invaluable tools for a variety of purposes, including:
- Weather Forecasting: Meteorologists use weather maps to predict future weather patterns, helping us prepare for potential storms, heatwaves, or cold snaps.
- Aviation and Navigation: Pilots and ship captains rely on weather maps to make safe navigation decisions, avoiding adverse weather conditions.
- Agriculture: Farmers use weather maps to plan planting and harvesting schedules and manage irrigation.
- Emergency Management: During severe weather events, emergency services use weather maps to coordinate responses and keep the public informed.
Types of Weather Maps
Weather maps come in various types, each designed to highlight specific aspects of meteorological conditions. These specialized maps cater to different needs and fields of study. Here are some common types:
Surface or Ground Weather Maps
Surface weather maps, also referred to as a surface weather map, are perhaps the most recognizable type of weather map. They show the current weather conditions at the Earth's surface. These maps typically show temperature, pressure systems (highs and lows), wind direction and speed, humidity levels, and precipitation.
To create a ground map, air pressure readings must be collected from all weather stations, which are measuring stations located on the ground within the map's coverage area. Based on the location of each weather station, the relevant information is plotted onto the map. Additionally, satellite and radar imagery is employed to ensure precise assessments.
In the subsequent step, the highest and lowest air pressure values are identified and marked on the map. "H" represents areas of high pressure, while "L" indicates regions of low pressure. The distribution of these high and low-pressure areas is illustrated on weather maps using isobars, which are lines connecting points of equal air pressure.
High-Altitude or Upper-Air Weather Maps
High-altitude weather maps, also known as upper-air weather maps, focus on weather conditions at various altitudes above the Earth's surface.
These data are collected using radiosondes and then displayed on weather maps. These values are presented as lines indicating equal pressure surface heights, known as isohypses, which exhibit smoother variations compared to isobars.
Subsequently, a weather forecast can be generated to depict the expected weather conditions. In addition to meteorologists' expertise, historical and current atmospheric data are considered, applying physical principles and comparing measured values with model calculations.
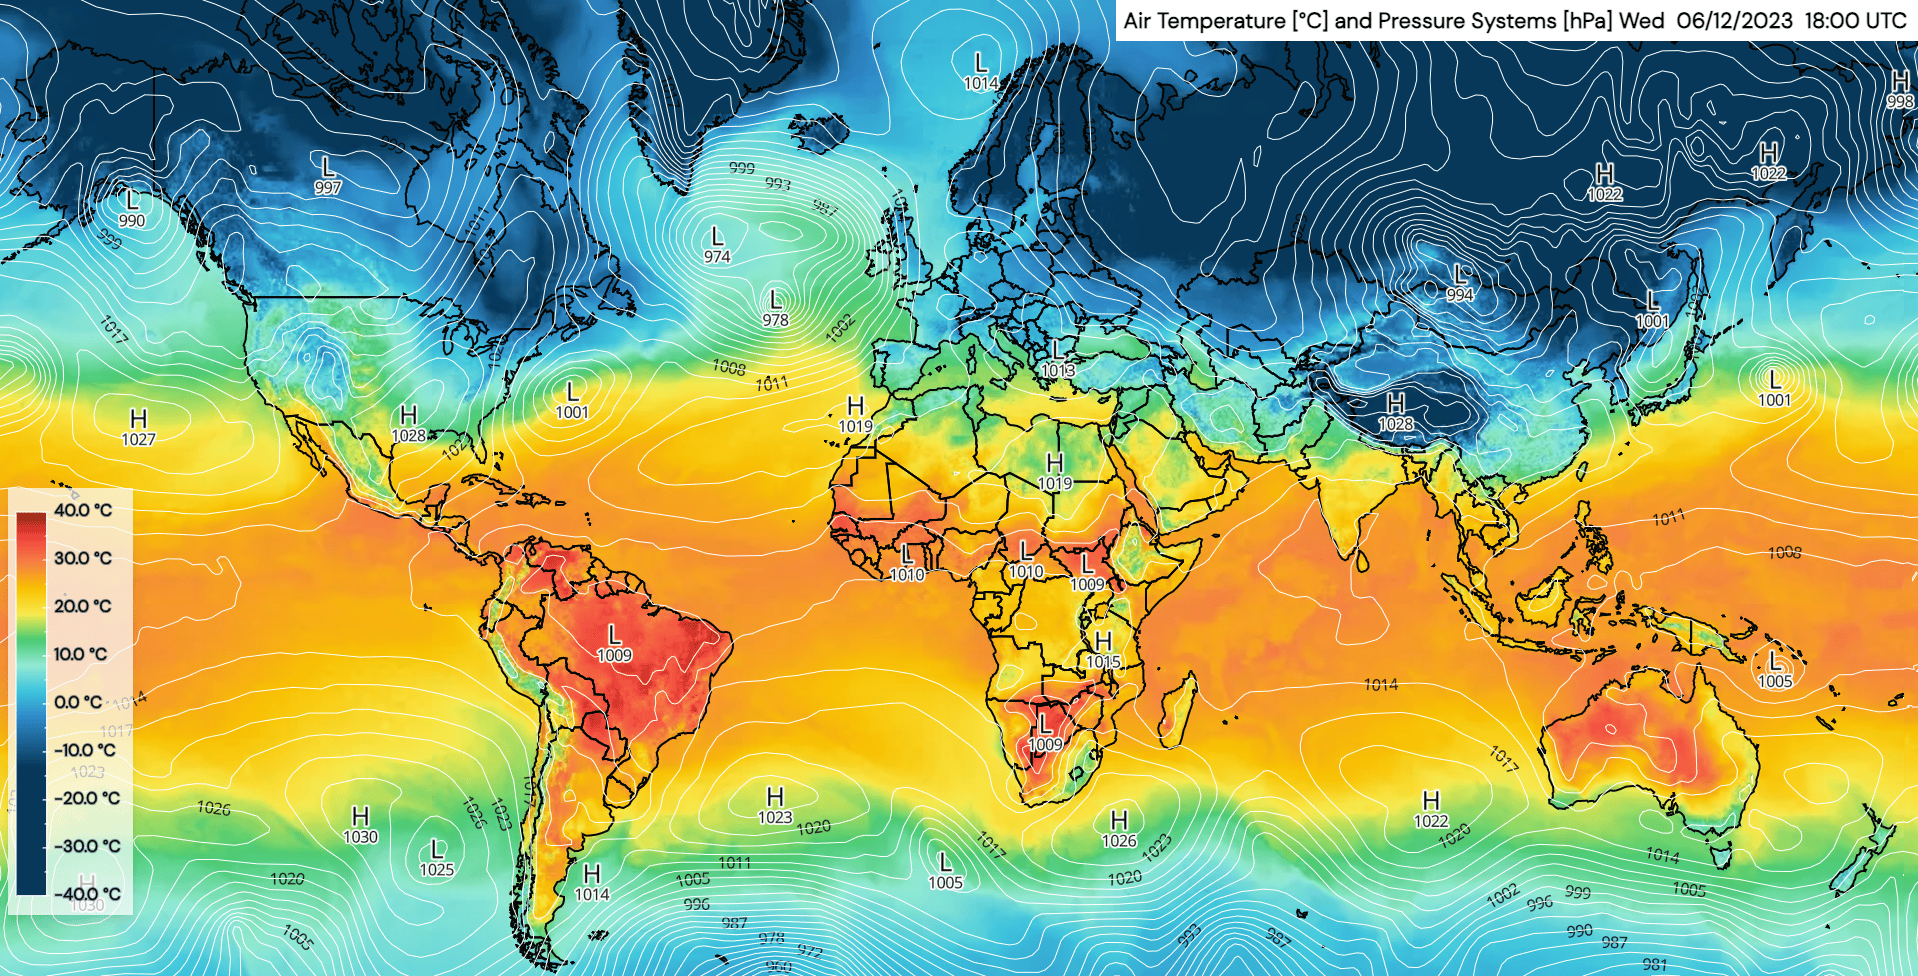
Global view of a weather map showing pressure systems and potential temperatures.
What Do Weather Maps Display?
Weather maps are like snapshots of the atmosphere, capturing a wealth of meteorological information that helps us understand and anticipate weather conditions.
Here are some key elements commonly found on weather maps:
- Temperature: Weather maps often feature temperature data, represented by color-coded contours or shading. These visual cues make it easy to identify temperature variations across a region. For instance, warm temperatures might be depicted in shades of red and orange, while cooler temperatures are shown in blues and greens.
- Pressure Systems: High-pressure and low-pressure systems are considered the most important features on weather maps. They are typically marked with "H" and "L" symbols, respectively. Understanding these systems helps predict weather patterns, as high-pressure areas often bring fair weather, while low-pressure areas can lead to stormy conditions.
- Wind Patterns: Arrows or wind barbs on weather maps indicate wind direction and speed. Meteorologists use this information to analyze how air masses move and interact, influencing weather conditions.
- Precipitation: Weather maps display precipitation data, such as rainfall or snowfall, using different symbols or colors. This information is crucial for tracking storms, droughts, and potential flooding.
- Fronts: Fronts are boundaries between different air masses, and they are indicated on weather maps. Cold fronts, warm fronts, and stationary fronts play a vital role in forecasting weather changes. They are depicted as lines with specific symbols.
- Cloud Cover: Cloud cover is shown on weather maps through various symbols or shading. Understanding cloud patterns helps predict sky conditions and the likelihood of precipitation.
- Humidity: Relative humidity levels are sometimes included on weather maps, helping meteorologists assess the moisture content of the atmosphere. This information is essential for predicting conditions like fog and dew.
- Isobars and Isotherms: Isobars (lines of equal atmospheric pressure) and isotherms (lines of equal temperature) provide insights into pressure systems and temperature gradients. Meteorologists use these lines to analyze weather patterns.
- Satellite and Radar Data: Modern weather maps often incorporate real-time satellite and radar data, showing cloud cover, storm movement, and precipitation patterns in near-real-time.
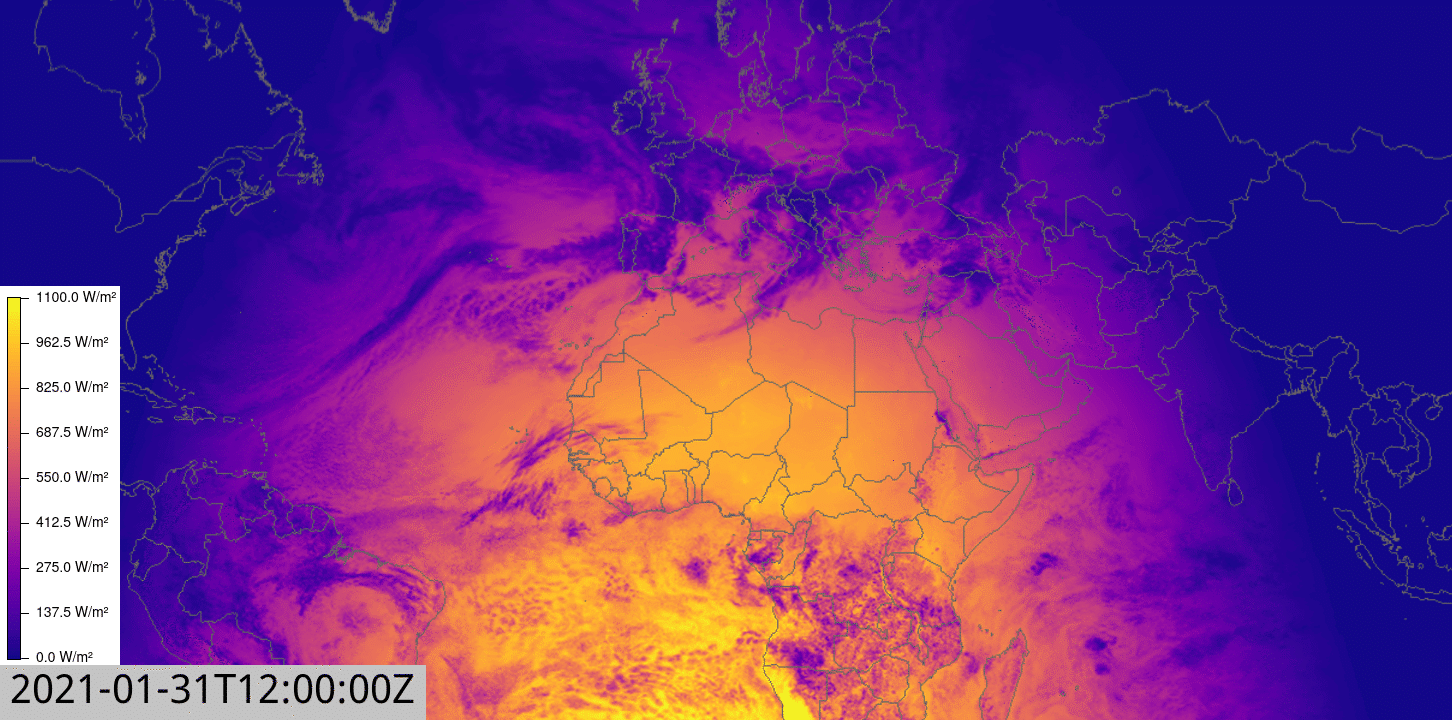
Weather map showing solar radiation.
Looking for a Weather Map Solution?

Talk to an Expert
Related Articles


We provide the most accurate weather data for any location, at any time, to improve your business.