Contact us today to get professional advice on how we can also improve your business.


Strategic Planner, Water Resources
Scottish Water
The Meteomatics Weather API stood out as the most comprehensive, flexible and user-friendly API service available. Its flexibility allows us to integrate it into various systems easily.

Principal Meteorologist for Airbus Zephyr & Expert Meteorologist Airbus Group
Airbus
Client Testimonial: Airbus
The combination of the Meteomatics data and visualization software MetX matched with Airbus designed tools provides the most advanced suite of weather forecasting systems available today.

Meteorologist
Cheniere Energy, Inc.
The data and insight I receive from Meteomatics is far and away the best. Each time I use the product, I discover something even more valuable and exciting. The capabilities and ease-of-use of the platform cut my work in half.

Senior Operations Research Analyst
BKW
The Meteomatics Weather API is unique in the market as it provides flexible and fast access to a huge amount of weather data in different data formats.

DSO Data Science & Development Manager
UK Power Networks
More frequent and higher-spatial granularity weather data has been a game changer for creating probabilistic forecasts, meaning we can retain the same operational resiliency and reliability whilst using our network assets more efficiently.

Demand Forecasting Manager
Brook Green Supply
The results have been significantly improved since we started working with Meteomatics, empowering us to enhance our offerings and stay at the forefront of innovation in our industry.

Senior Facilities and Energy Management Engineer
Toyota Europe
Meteomatics helps us in our quest for continuous improvement, since the accuracy of its weather data helps us to plan better, to increase the efficiency of our energy systems, and to reduce costs.

CEO
Sunflower Labs Inc.
Meteomatics provides the perfect solution for our needs. The data has been accurate, complete, easy to process and 100% reliable in all the time that we have used it.

Head of Central Operations
East of England Co-op
We have made significant savings in waste compared to last year and have driven strong year-on-year sales growth through the implementation of the API.
Principal Meteorologist for Airbus Zephyr & Expert Meteorologist Airbus Group
Airbus
The combination of the Meteomatics data and visualisation software matched with Airbus designed tools provides the most advanced suite of weather forecasting systems available today.

Co-Founder & CTO
Nave Analytics
When we switched to Meteomatics, precipitation forecasts became incredibly accurate, saving me two-thirds of my time because I no longer had to deal with client issues.
Strategic Planner, Water Resources
Scottish Water
The Meteomatics Weather API stood out as the most comprehensive, flexible and user-friendly API service available. Its flexibility allows us to integrate it into various systems easily.
Principal Meteorologist for Airbus Zephyr & Expert Meteorologist Airbus Group
Airbus
Client Testimonial: Airbus
The combination of the Meteomatics data and visualization software MetX matched with Airbus designed tools provides the most advanced suite of weather forecasting systems available today.
Get Access to MetX: Talk to an Expert
Test Before Subscribing for a Regular License
MetX is a one-stop web-based professional tool accessible through a subscription.
The monthly license fee varies based on your usage scope and specific functionalities.
Talk to an expert to set up a trial or to start your subscription.
Subscribe to MetX, Get the Power of the Weather API at No Extra Cost
The weather maps generated in MetX are powered by the Meteomatics Weather API.
With a MetX license, you get unlimited access to all weather data available in the Meteomatics Weather API without having to acquire an API license.
Upon special request, MetX can also display data from EURO1k — the exclusive European weather model with a resolution of 1 kilometer from Meteomatics.
MetX in a Nutshell

Product Owner, MetX
With MetX, we make weather data accessible to everyone. It's an incredible tool for communicating weather information to all kinds of stakeholders, from fellow meteorologists to business executives.
Our Features
- Utilization of layers to showcase a wide range of weather parameters
- Real-time weather data calculation when zooming or changing views
- Points, lines, and areas of interest can be color-coded based on user-defined thresholds (e.g., red if temperature < 0 degrees)
- Various maps available, including topographic maps, border maps, aeronautical maps, and more
- Clear display of up to six maps on one screen
- Various setting options, e.g., color saturation
- Accurate data visualization even over large areas, including global view
- High granular resolution of 90 meters based on the NASA terrain model, with measurement points calculated every 90 meters and scaled accordingly
- Minute-by-minute temporal resolution
- Data export available for each point on the map
- Customized solutions available upon request
Your Benefits
Accelerate your workflow: Work with one single browser tab, visualize and analyze all data from over 110 sources at once in one platform.
- Save time and money, make better decisions faster
- No need to install any software, have a storage solution, or use additional data sources
- Enhance your confidence in operational forecasts and work effectively under pressure
- Communicate easily with diverse stakeholders thanks to dynamic and intuitive weather maps
Straightforward Access
- Go to: https://metx.meteomatics.com/
- Enter your login credentials
- Start creating weather maps

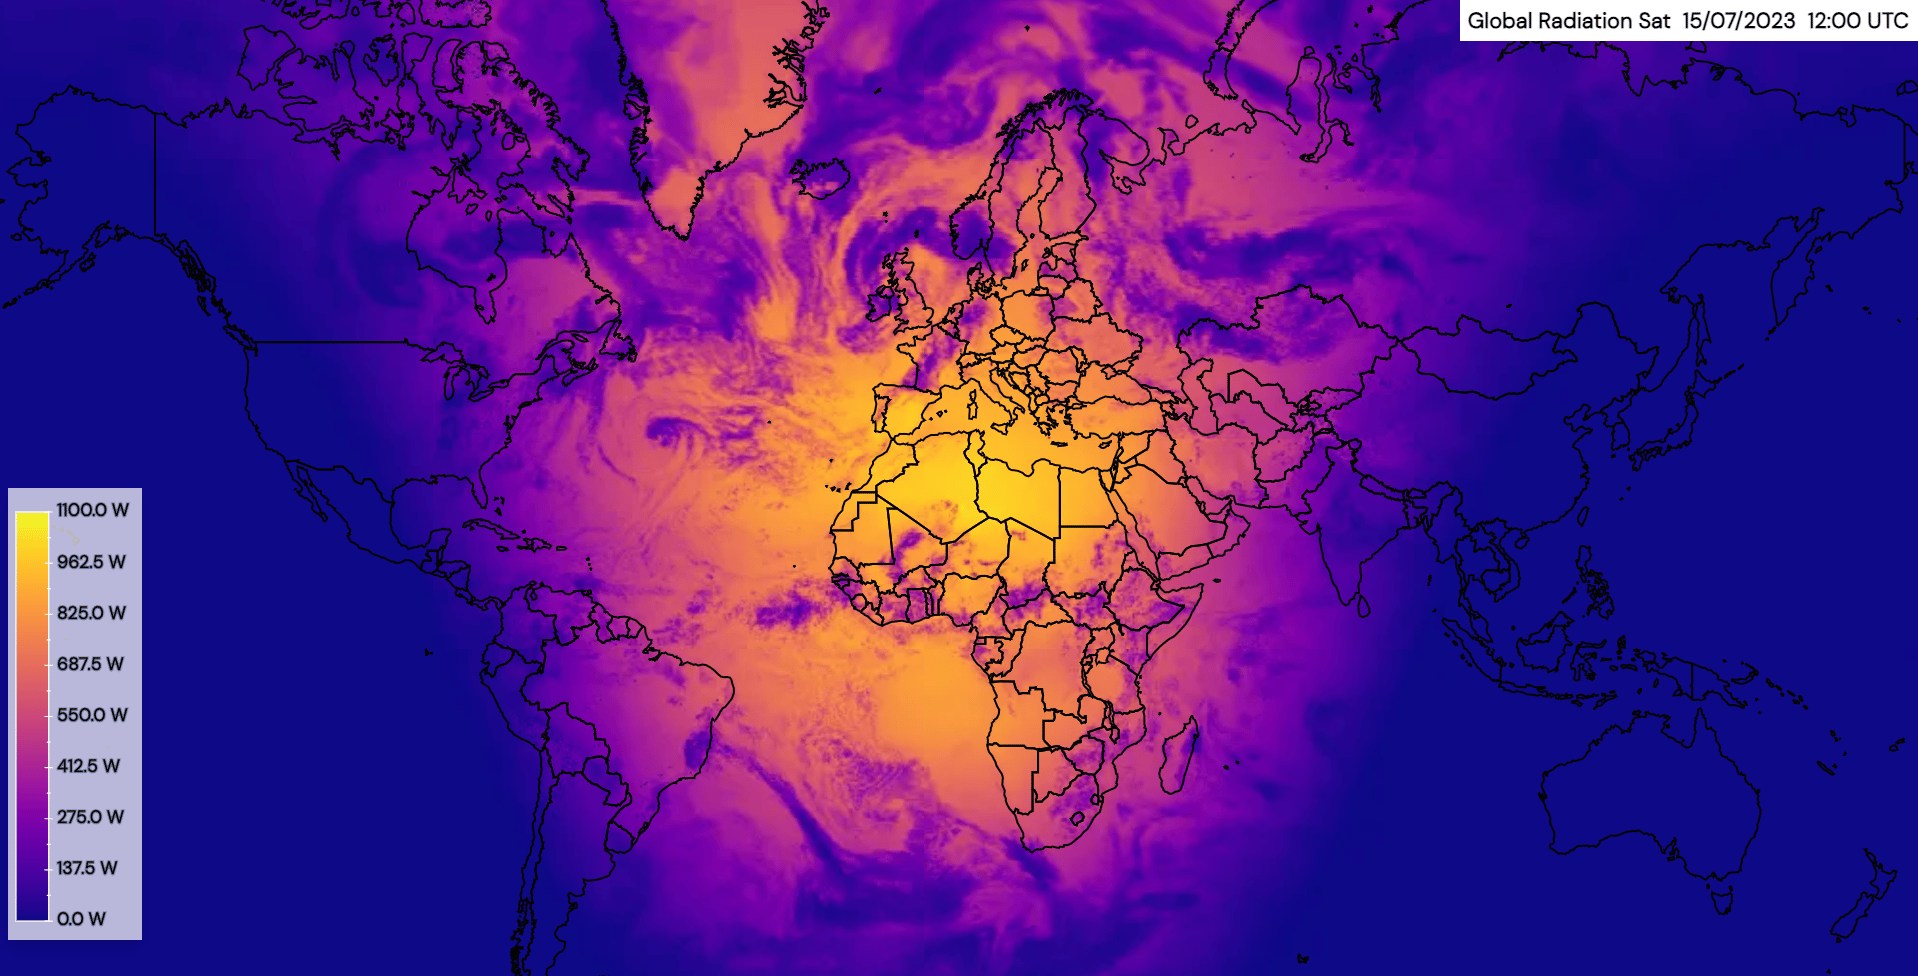
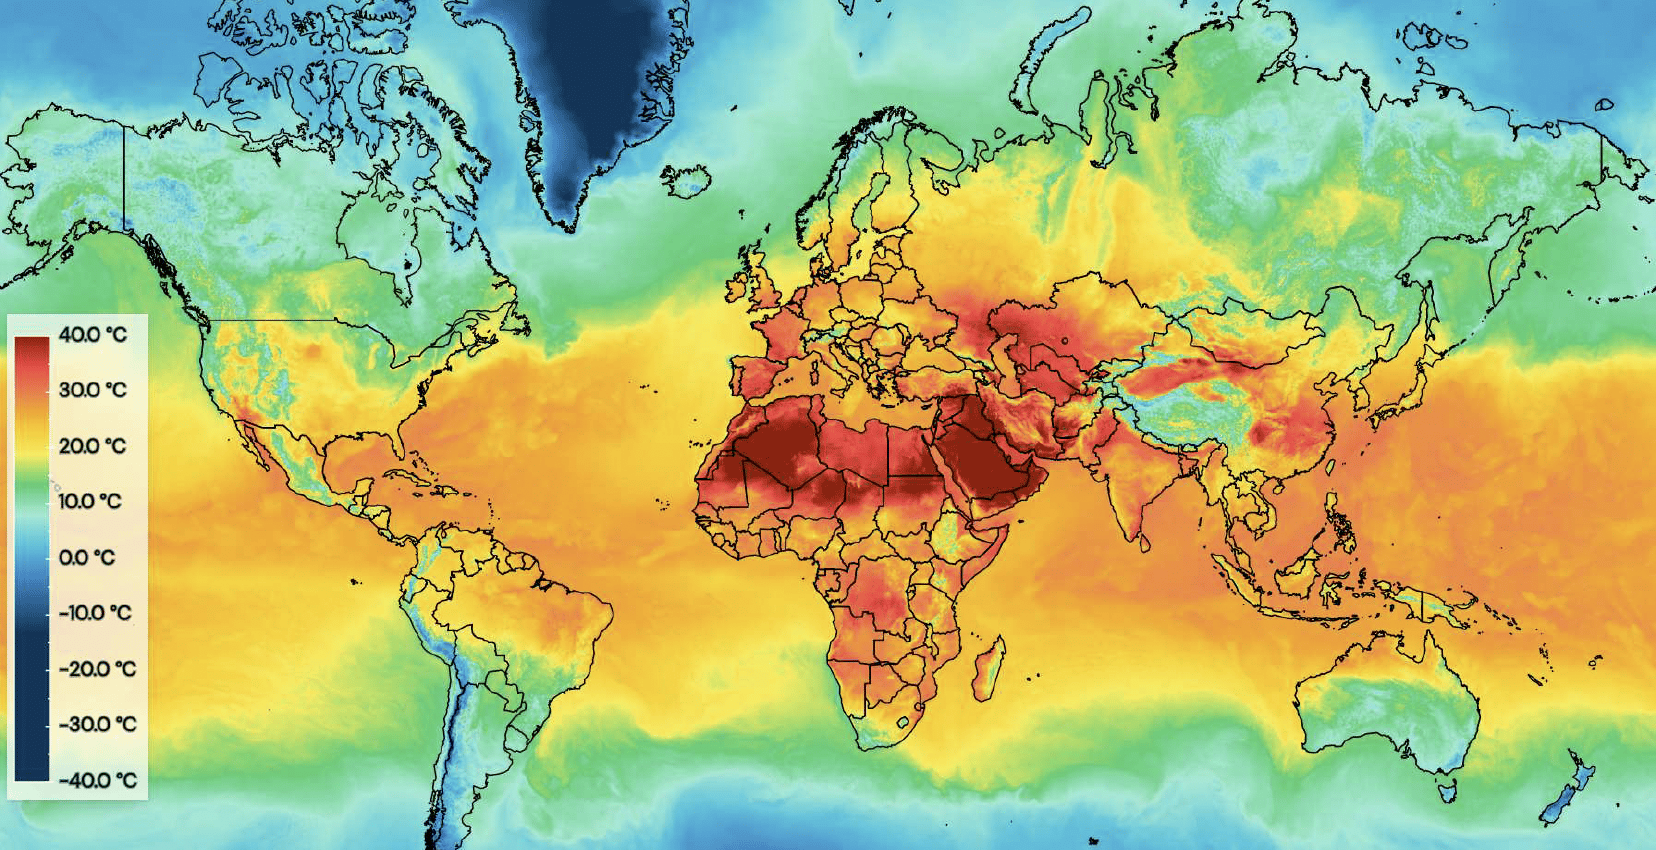
MetX weather map showing global solar radiation.
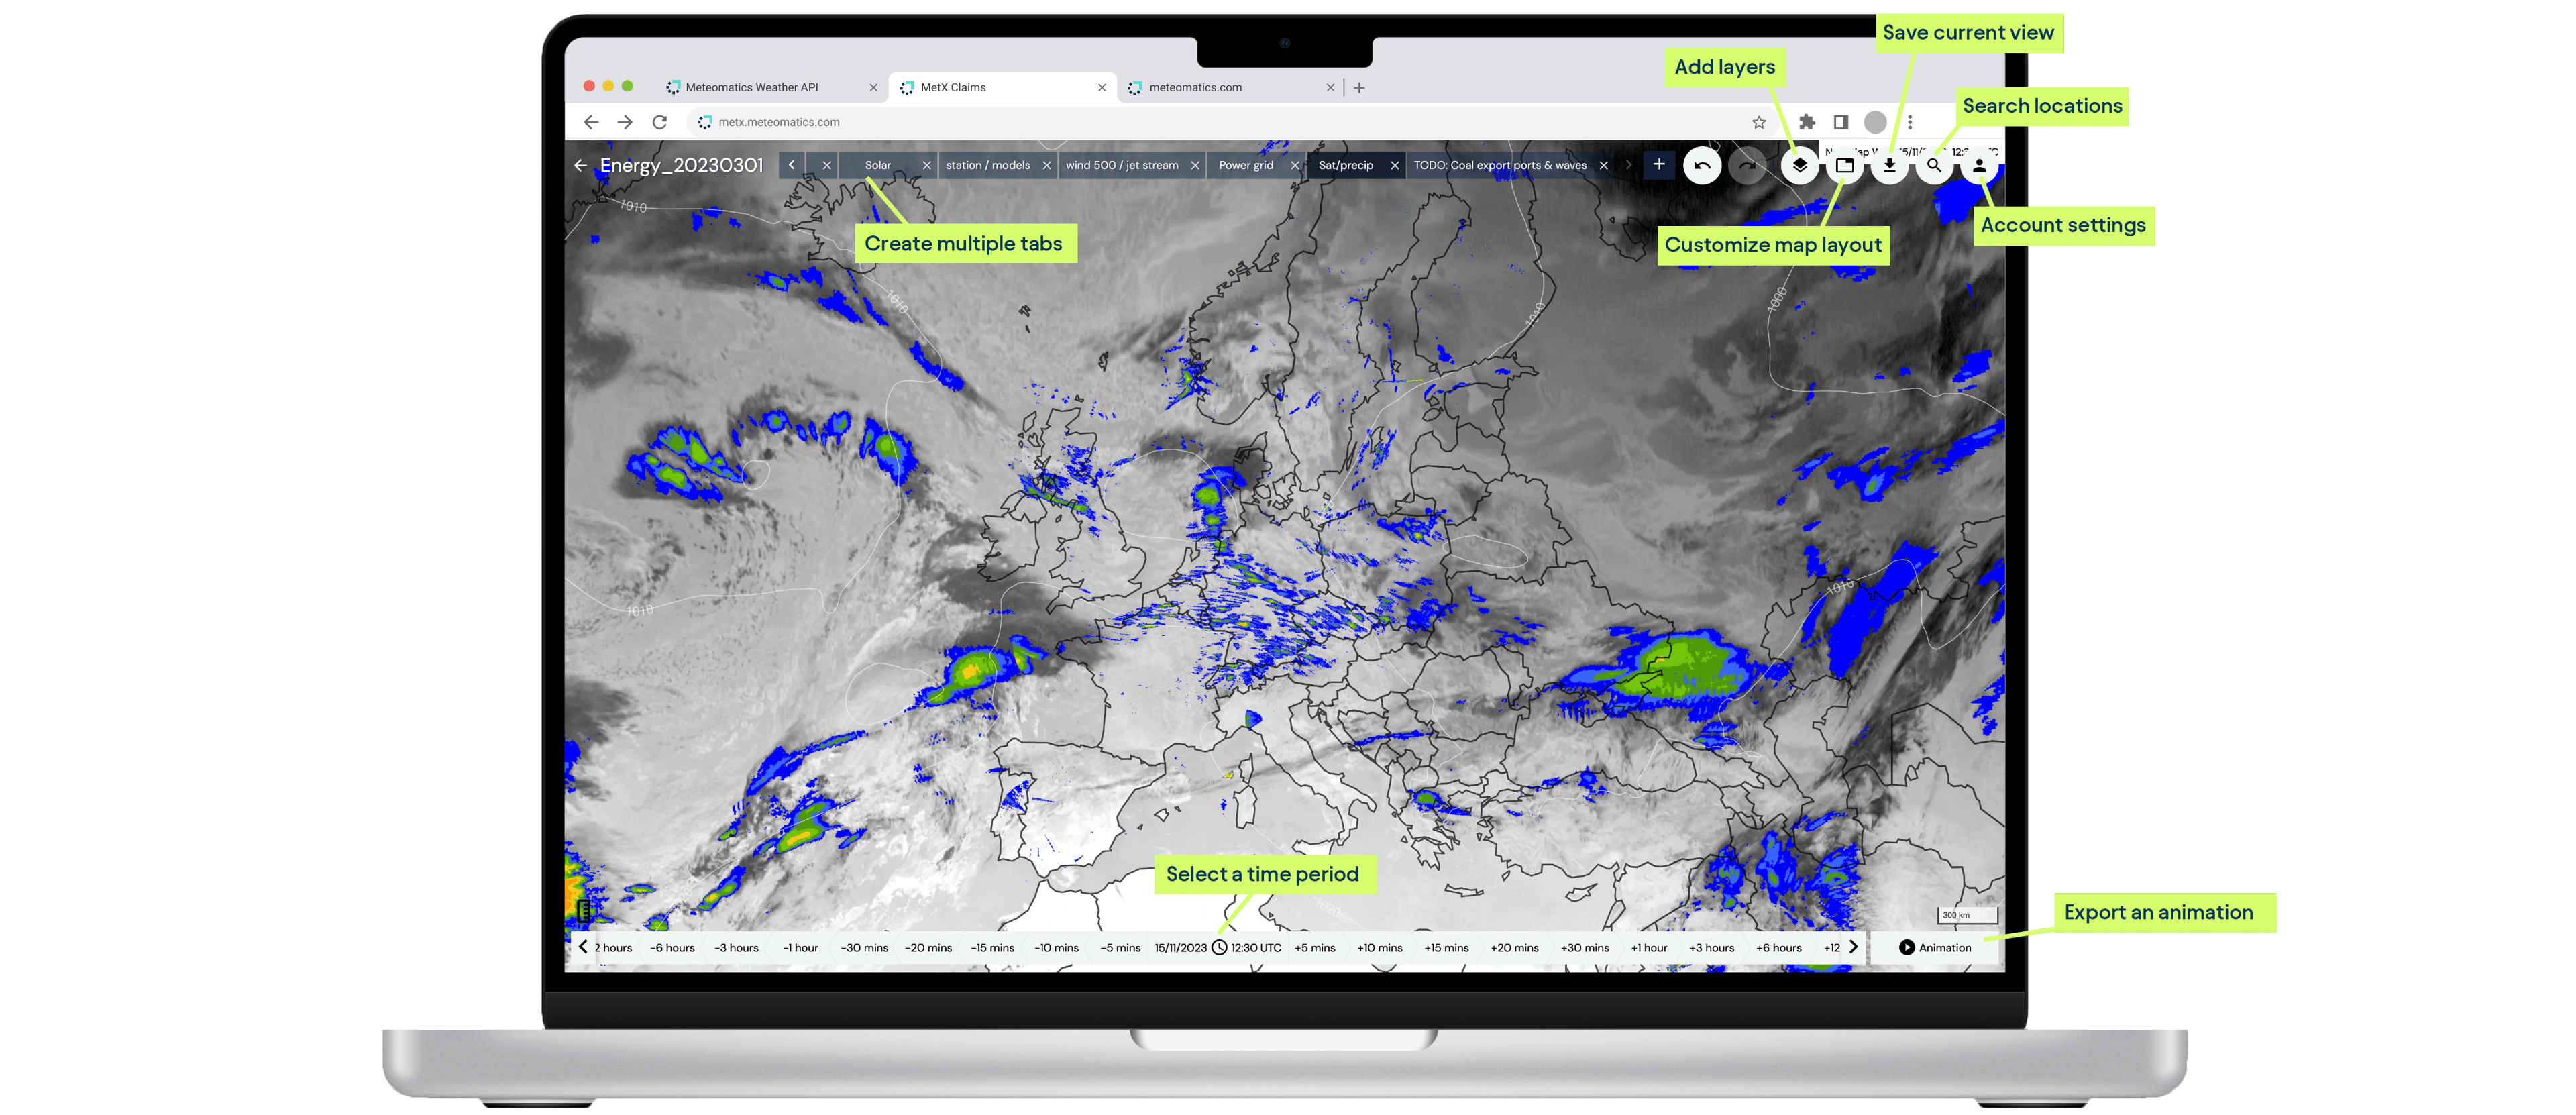
Navigation
We keep the navigation in MetX simple and clear. You can create different profiles and access various functions via buttons, including:
- Creating new maps or diagrams
- Selecting weather layers
- Entering weather parameters
- Exploring different views
- Importing and exporting data
- Accessing account information
- Saving your work
Time Navigation
At the bottom of the weather map, you have the flexibility to customize the time period for weather animations.
Most weather layers in our tool can be adjusted backward or forward in time, and you can even select a specific date.
Location Selection
A search function is available to find locations using specific addresses or longitude and latitude coordinates.
Layers
The weather layer overview enables you to integrate weather information from various sources into the weather map or chart. You can add diverse layers, such as:
Each layer comes with its own range of customization options. Once a weather layer is included, you can easily rearrange the layer order through a simple drag-and-drop process, allowing you to position layers as needed.
Animations
Weather animations illustrate the progression of weather conditions during a defined time frame.
In MetX, these animations are dynamically computed in real-time, displaying the most up-to-date weather information.
You can fine-tune the animation's duration to your preferences, adjusting parameters such as the start and end times, time zone, interval, and frames per second.
Import/Export
MetX offers the option to import or export saved weather profiles, images and videos.
You can export weather data based on your customized settings, combining individual layers with a single click, or choose to export created diagrams.
Additionally, animated weather maps can be saved as videos in your preferred format.
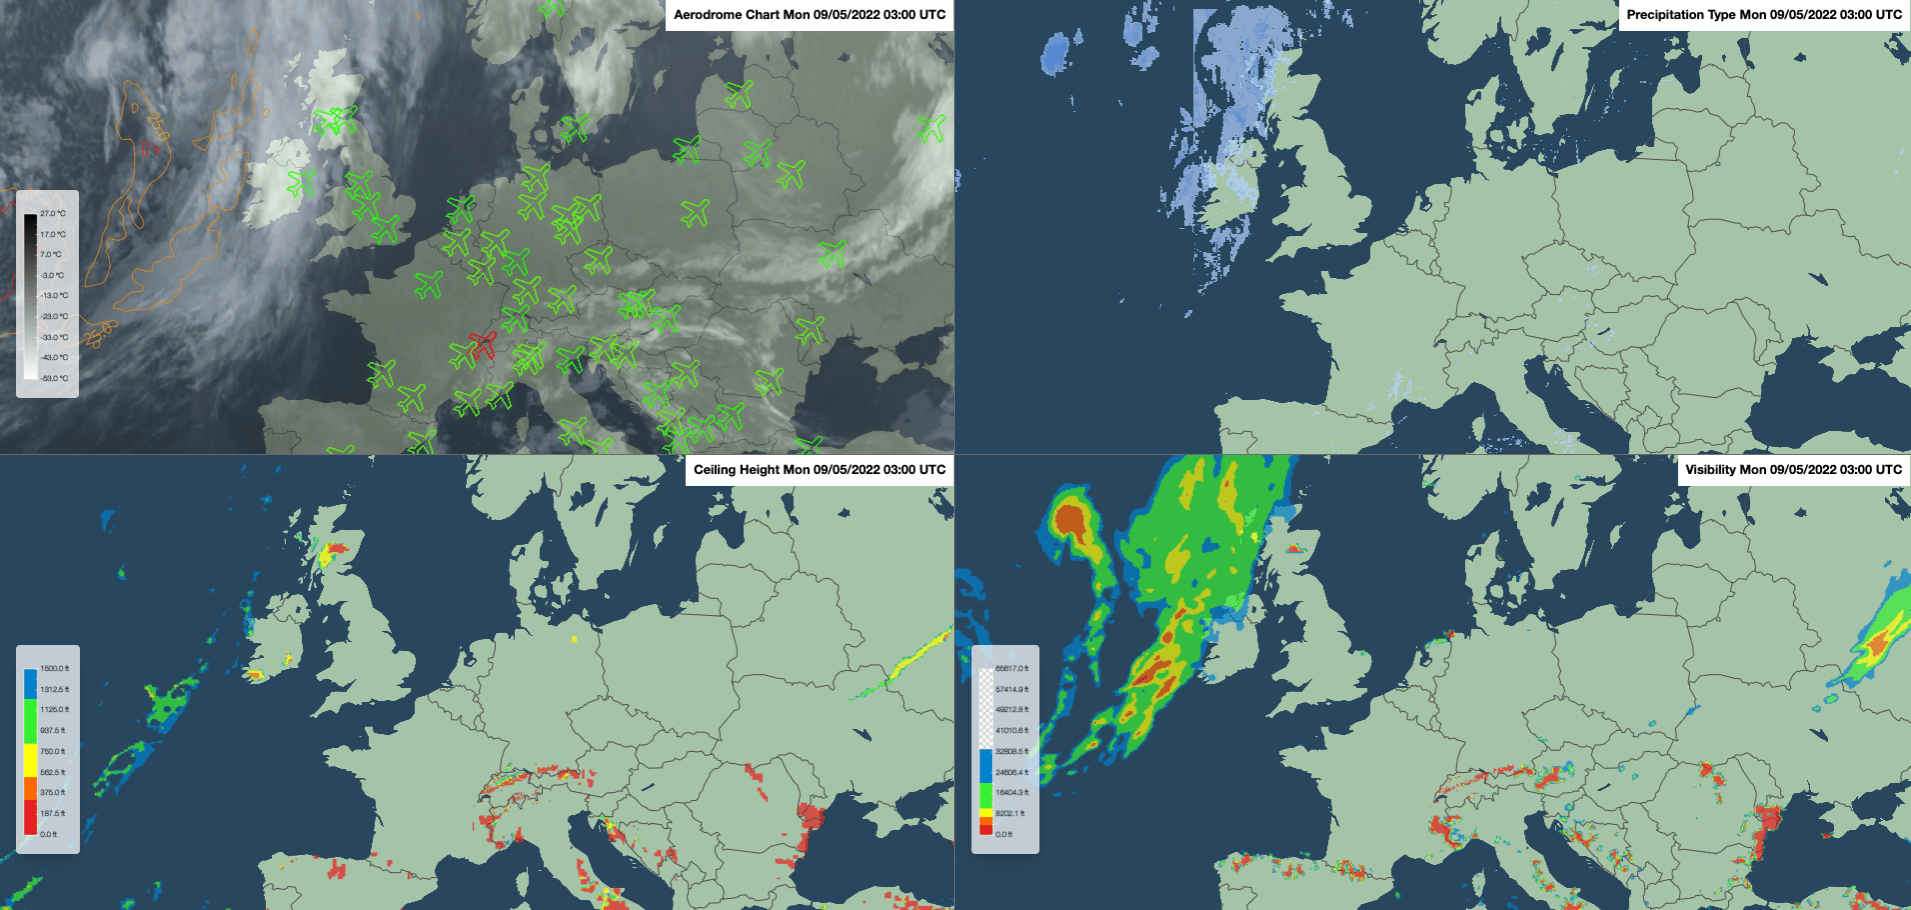
MetX allows you to display multiple weather maps in a single tab. You can choose how many maps to combine, with support for up to six fields that can hold maps or diagrams. Each field can have its own weather data, offering flexible combinations and display options for different weather layers.
Points, Areas and Lines of Interest
You can upload files to MetX with your locations of interest, select a parameter, and set thresholds to easily visualize when those thresholds are met.
This enhanced control helps you pinpoint critical areas, enabling more informed decision-making and clearer communication of important insights across teams.
Points

Lines or routes


Areas / Polygons


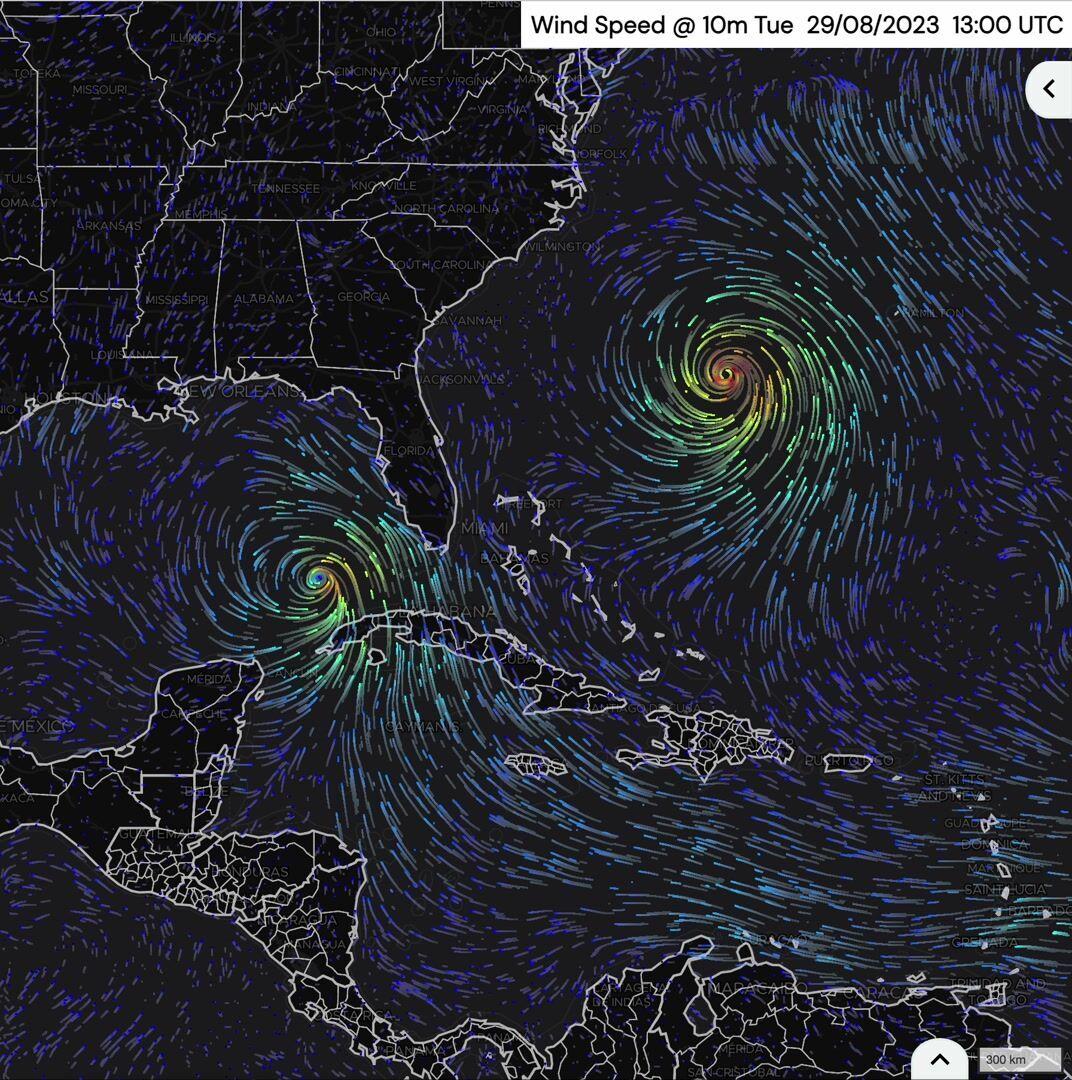
Wind Visualization
The global wind feature offers worldwide coverage and enables users to create precise wind maps.
Its intuitive animations serve as an effective communication tool for different kinds of stakeholders, such as customers, investors and employees.
Detailed Documentation and Tutorials
We prepared an extensive documentation about MetX to help you get started. Click the button to download the PDF or watch the video tutorials.


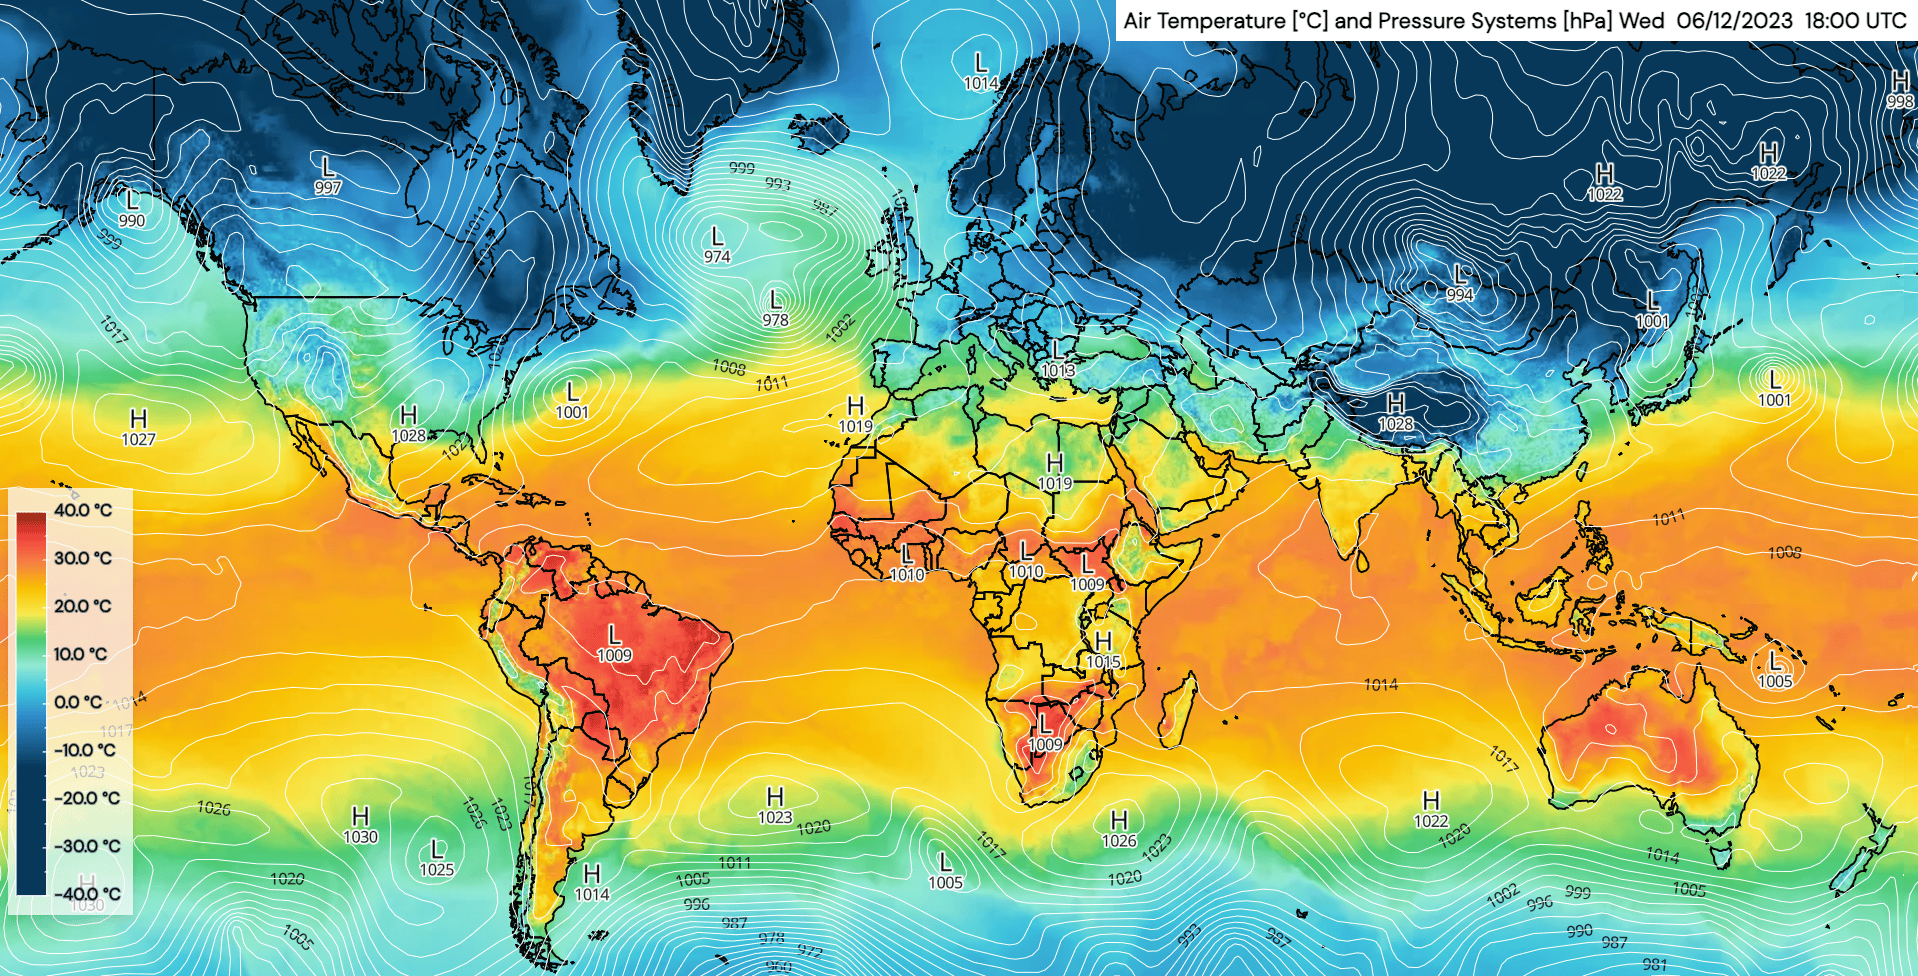
Example of a Weather Situation Evaluation
Weather forecast using MetX for Europe, North America, Africa and Australia on March 4, 2022, at 06:00 UTC.

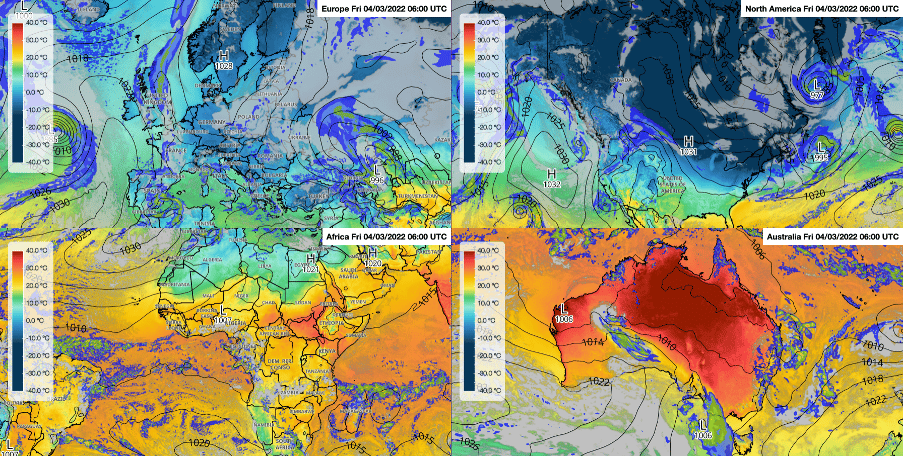
- Europe: A high-pressure system is situated over southern Norway, resulting in calm weather conditions. However, the first low-pressure systems are affecting the British Isles and the Iberian Peninsula, bringing unsettled weather.
- North America: The northeastern US states are experiencing cold temperatures due to the influence of an approaching high-pressure system. Meanwhile, a low-pressure area near California is causing snowfall in lower elevations.
- Africa: A tropical depression located over the West Indies is causing rainfall in northern Madagascar and along the southeastern African coastline. Additionally, the foothills of a low-pressure system over Spain are bringing rainfall to northern Morocco and Algeria.
- Australia: The states of Western Australia, Northern Territory, and Queensland are currently experiencing widespread hot temperatures. Meanwhile, an area of low pressure is responsible for bringing rainfall to areas like Adelaide and South East Queensland.
Airbus Uses MetX To Ensure Zephyr Flies Safely to the Stratosphere
Use Case
Zephyr, a project by Airbus Defence and Space, aims to offer advanced observation, sensing, and connectivity capabilities for commercial, institutional, and military users.
The synergy between the Meteomatics Weather API's data and MetX's visualization capabilities and Airbus-designed tools results in the most advanced suite of weather forecasting systems, ensuring the safe navigation of Zephyr into the stratosphere.


Ready To Start?

Talk to an Expert
We provide the most accurate weather data for any location, at any time, to improve your business.