08/05/2021
How Will Climate Change Impact You? Get Data-Based Evidence Now!

Head of Marketing
Meteomatics continues to push towards its goal of providing the highest quality weather data possible and is proud to announce that it’s now able to offer monthly records of the climate for any location on the planet.
Thanks to Meteomatics' API, Meteomatics has the historical data to compute the climatology for any latitude/longitude, which offers our customers the opportunity to enrich their understanding of how 'normal' the forecasted weather conditions are for the day, week, month(s) or season ahead, in comparison to the average.
Providing climatology and weather forecasts across the globe allows Meteomatics users to access and correlate weather insights across a multitude of use cases and industries. Users can now compare climatological records against the current weather conditions, for the next 10 days, or the season ahead to understand if it’s an extreme event and/or a continuing trend.
Knowing about climate and weather impacts on agriculture land in advance leads to several benefits for different industries, including food production and financial markets. Food companies can assess impacts on price developments and thus react proactively in their supply chain. Insurances can use climate and weather data to continuously assess long term risks of (e.g. agricultural) assets. (Renewable energy) Companies can evaluate potential locations for new production facilities very quickly. And there are many more opportunities for business and organizations to make beneficial use of our climatology data. In the following, we will show in a small case study, using selected data, what possibilities exist with our data.
It should be noted that only a fraction of the data and possibilities are presented in this small case study. If you are interested in the full range of climate data opportunities provide by Meteomatics, you can contact us at any time, we will be happy to advise you.
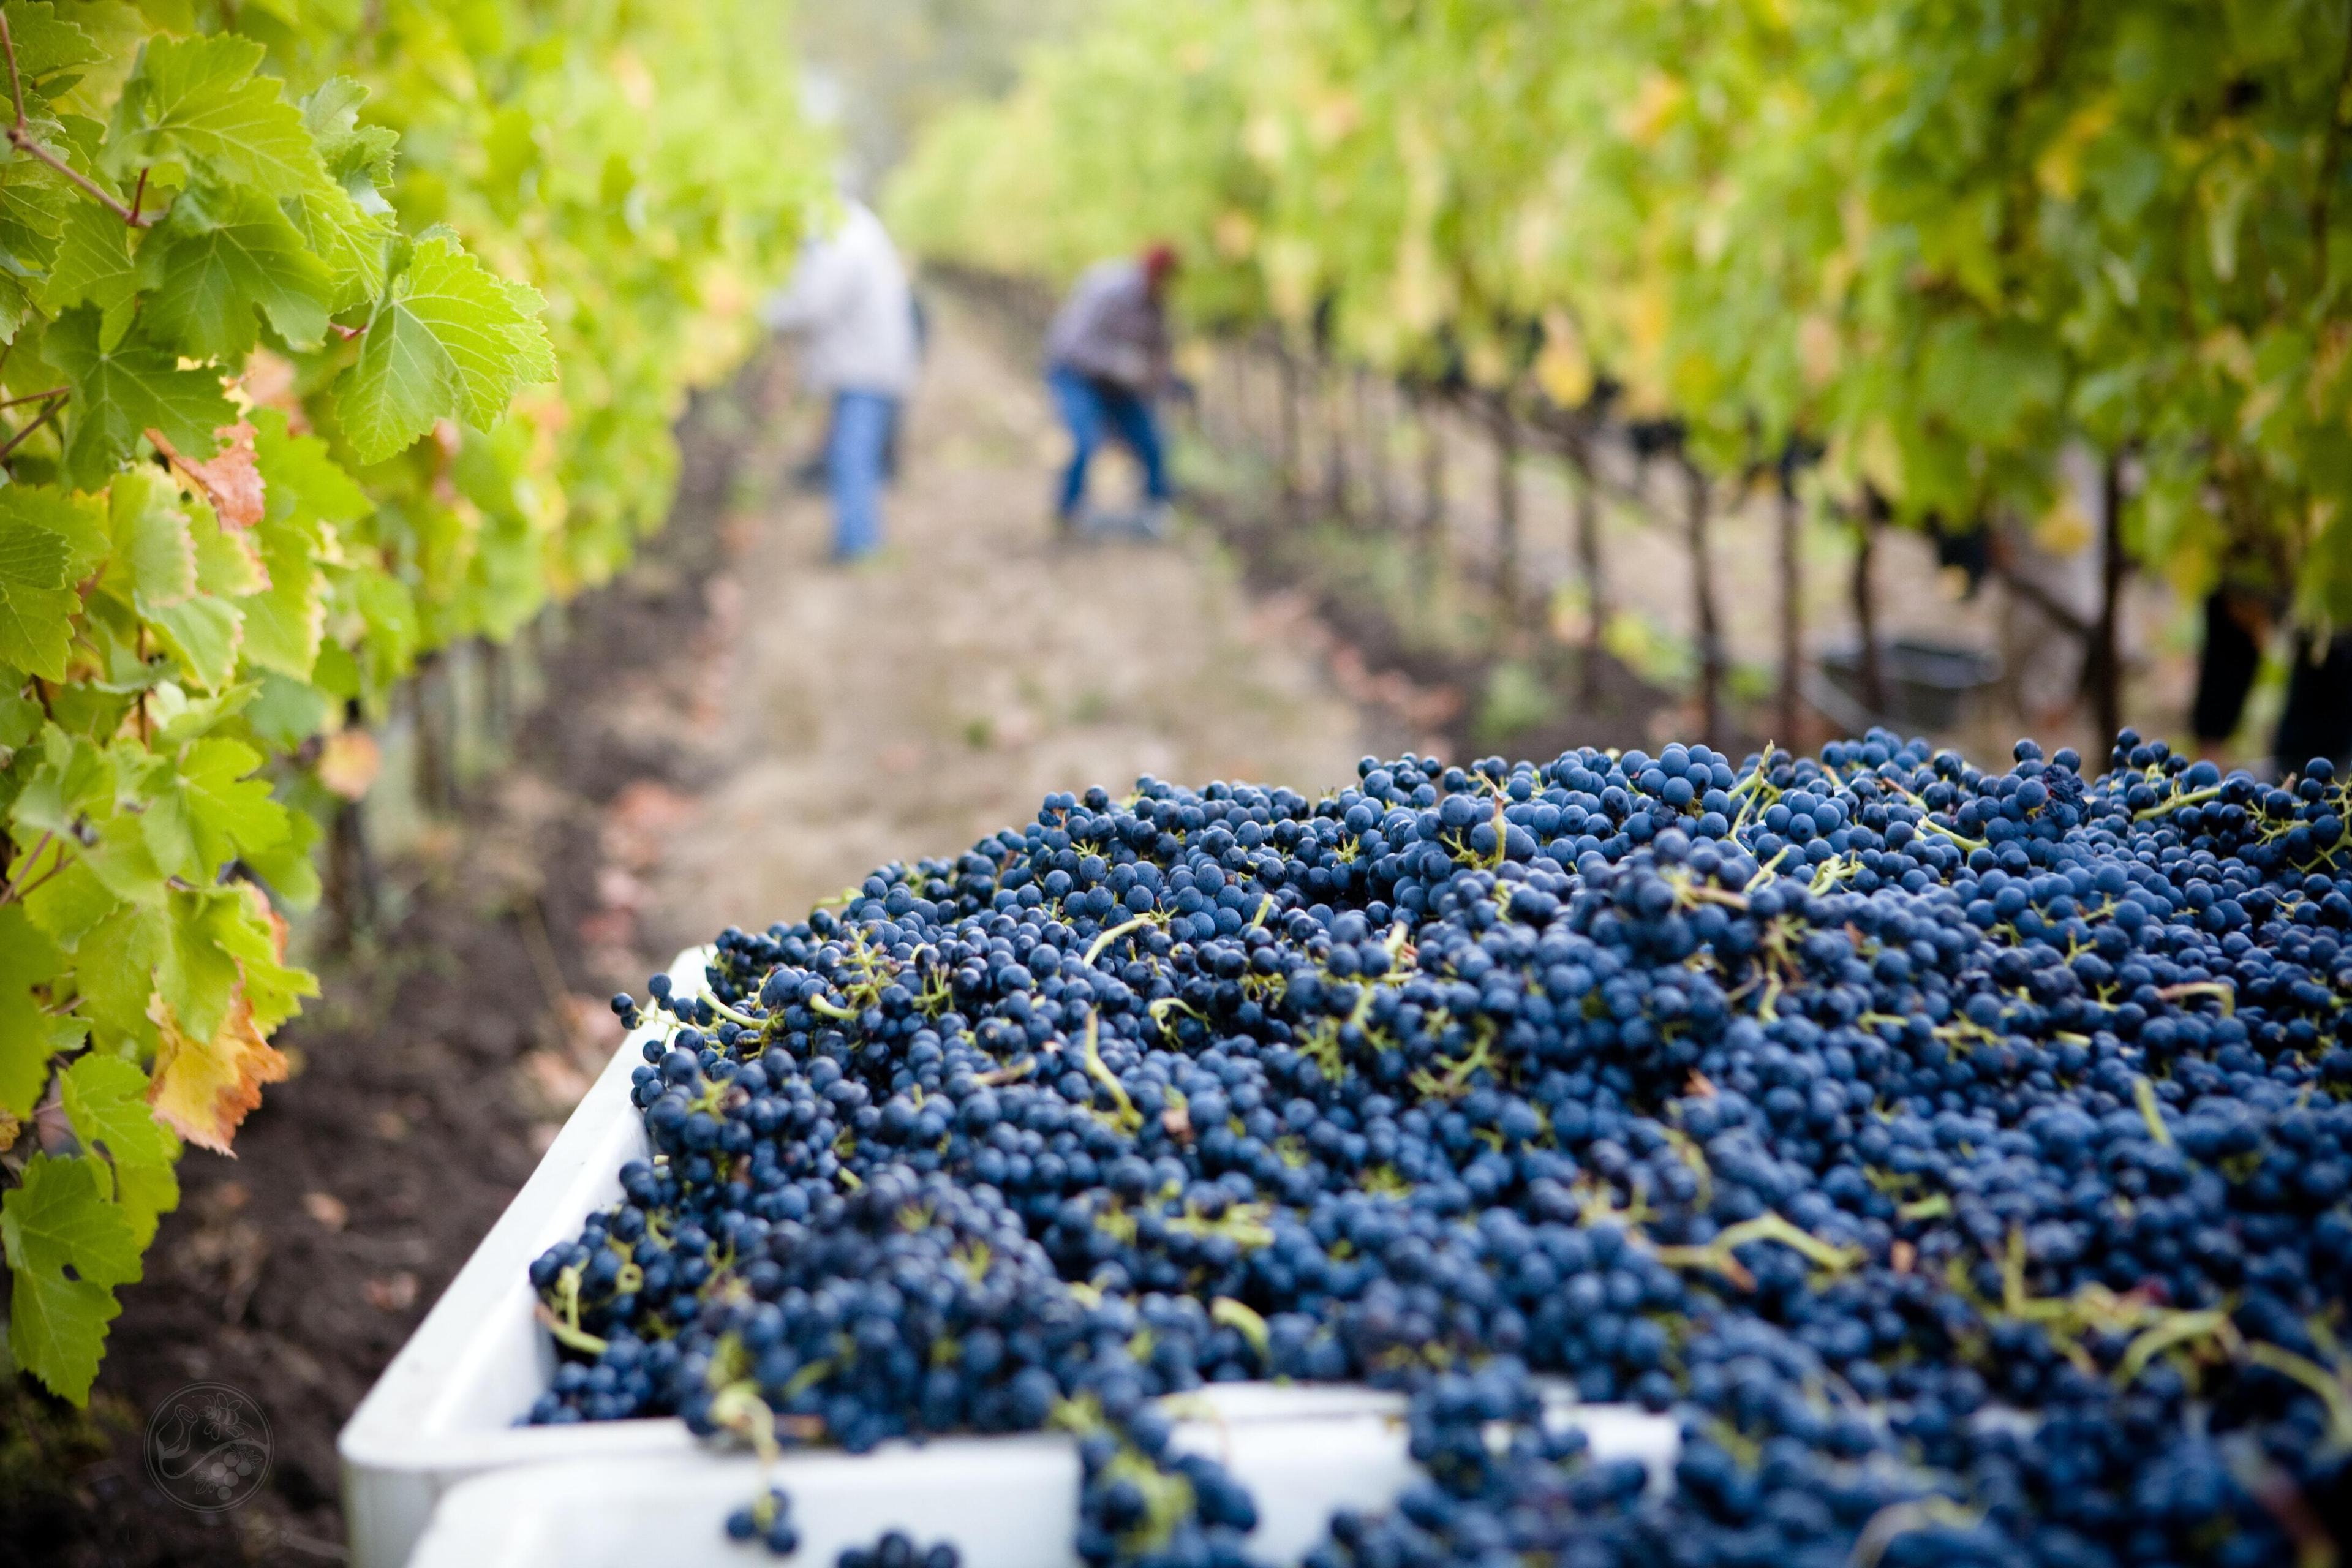
Brazil coffee production case study: see what powerful insights you can obtain from Meteomatics' weather and climatology data
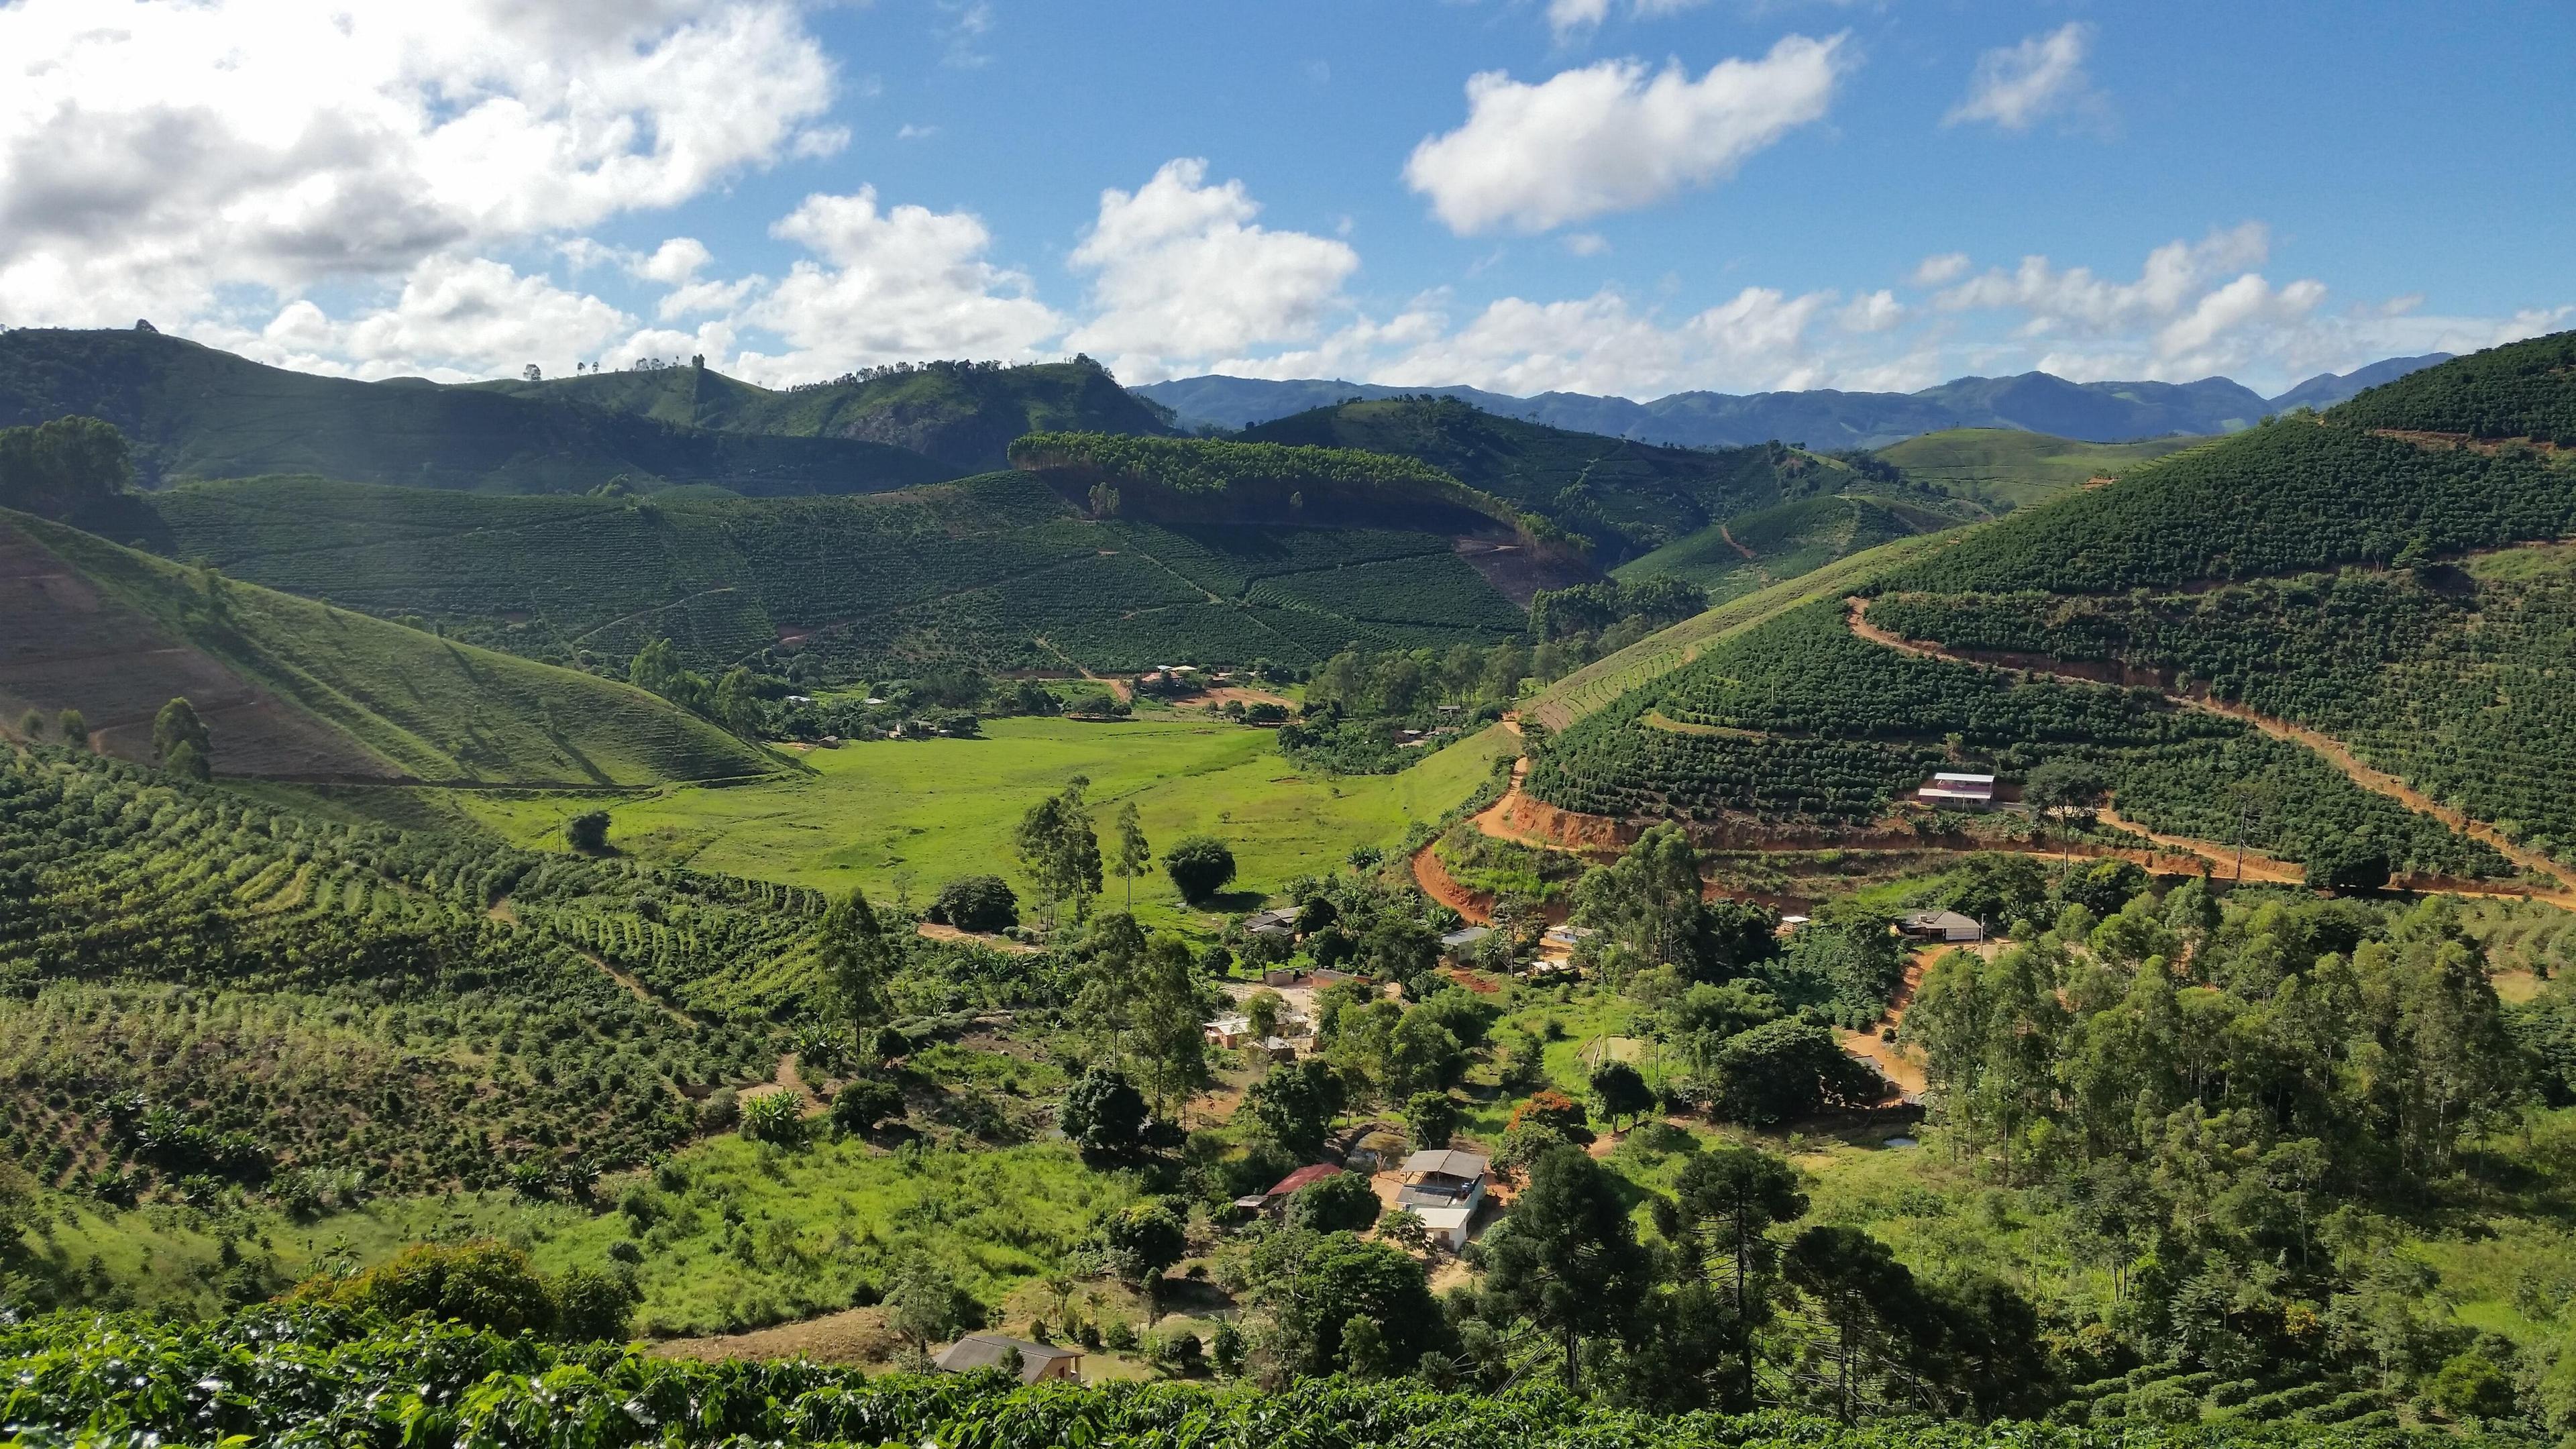
Take the example of a coffee plantation in Brazil producing arabica where weather and climate impacts are making headlines around the world as the famous coffee region is expecting production to drop by as much as 30% from normal levels, driving up the cost of coffee. New York-traded arabica futures have risen over 18% in the past three months to $1.51 a pound.
Meteomatics extensive weather and climate data reveal the weather phenomena that are creating unfavorable growing conditions. Meteomatics' climatological data illustrates that the main Brazil coffee region (Minas Gerais near São Paulo) received more precipitation than normal during the critical months of November 2020 – February 2021, but dry conditions persisted. The seasonal forecast indicates that the situation is not going to improve with precipitation expected to be below normal levels for the remainder of 2021.

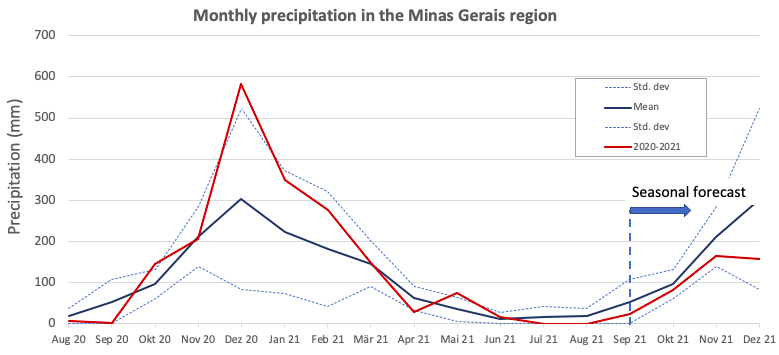
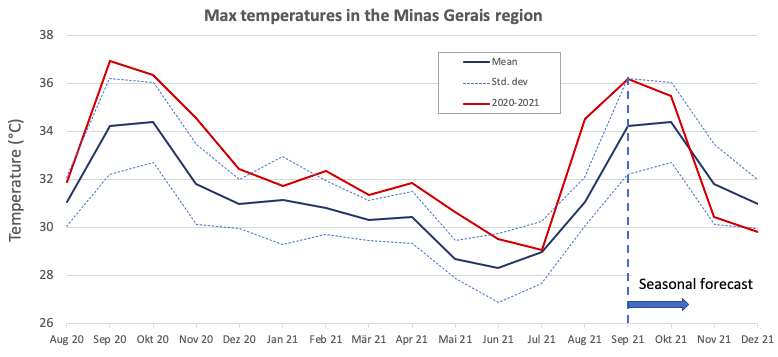
The above-normal temperatures have created dry conditions and evaporated rainfall. In fact, the area experienced a mean temperature deviation of 2.8°C above average in November, impacting the coffee plants during the critical flowering period (November – February).

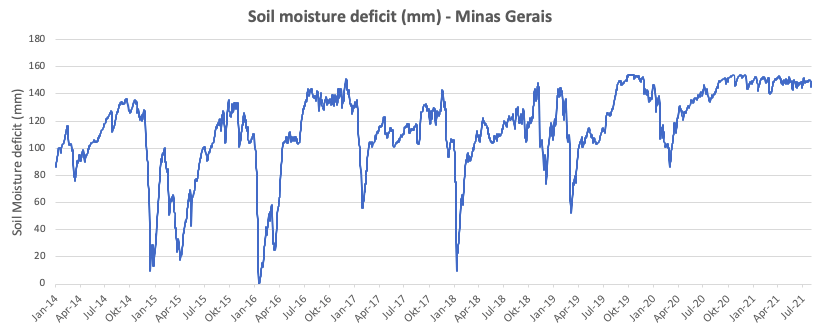
The evaporation has resulted in very dry soil conditions with Meteomatics' Soil Moisture Deficit data showing an uninterrupted deficit since April 2020, indicating that the area has continued to experience drought conditions since.

The dry conditions of the soil are also shown in Meteomatics' Drought Index (below) illustrating that coffee plantations have experienced drought in increasing frequency since 2018. The situation is now exacerbated by a prolonged period of drought over the past 12 months.

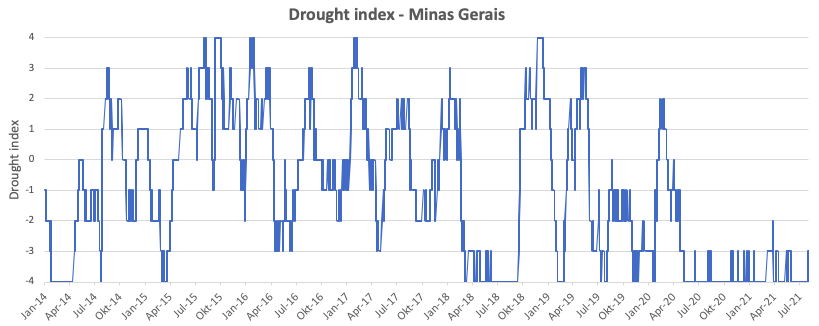
Meteomatics Drought Index identifies whether a certain location is under a drought or not. The percentiles of the deviation of the current time window from the mean of the past years is computed. The percentiles are then grouped into bins. The following table shows the output scale for the drought index:

The example of how weather conditions and climatology are impacting Minas Gerais coffee region showcases the value Meteomatics’ rich database brings to support use cases, such as the agriculture industry. The 7 petabytes of data include historical data, accurate short-term forecasts and Climate Change scenarios until 2100. This data helps businesses assess weather impacts on the growing season ahead, how weather conditions compare to the long-term average or also how the changing climate could affect results over the long term.
Please contact us if you would like to hear more about accessing Meteomatics climatological data, Meteomatics Weather API or if you are interested in analyzing how climate change could impact your organization.

Talk to an Expert
Related Articles


We provide the most accurate weather data for any location, at any time, to improve your business.