
11/23/2023
Getting Live Weather Data into ArcGIS
Meteomatics and ArcGIS — Part 1

ArcGIS — the seminal GIS software from ESRI — is a powerful way of exploring and analyzing spatial data such as that obtained from the Meteomatics Weather API. In this article we discuss the kinds of problems that ArcGIS can help you with, as well as how to get API data into ArcGIS and schedule regular updates so that your ArcGIS map always shows you an up-to-date forecast without the need for manual intervention.
What Is GIS?
Perhaps you’re reading this article and have no idea what GIS is or what it means, so a short introduction to the topic is in order. GIS stands for “geographic information system”, and refers to any software which facilitates the visualization, manipulation and analysis of spatial data.
Many problems have a spatial component, and GIS software allows users to import data with a geographical aspect and use specialized tools to display the data and answer strategic questions about it.
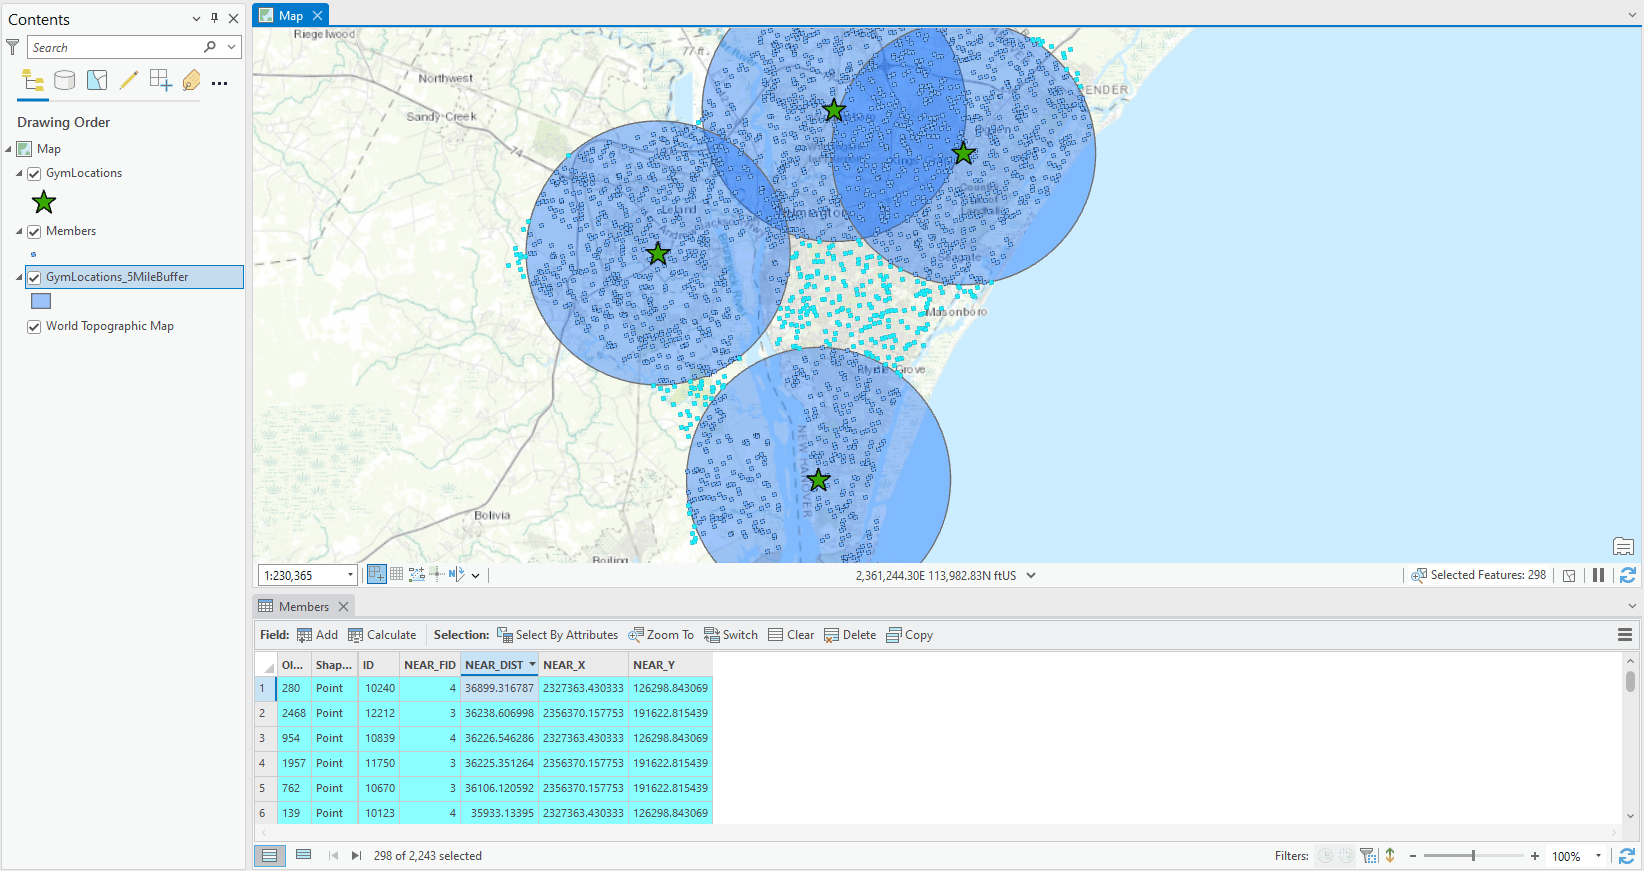
We’ll explore some examples of spatial questions in our articles on GIS integrations with our API, but for now consider a common example: you operate a chain of gyms in an urban area, and want to find the best location for a new gym. You have a .csv file with the location of your existing gyms, and could easily plonk a new facility down in a location a little way from your existing ones, but how do you know that this is a good location? Using GIS software you can pull in population and transport network data to find a location which is not just sufficiently far away from your existing locations, but also serves a distinct and significant population, and even optimizes the journey time to the nearest restaurant for all of your customers.

Integrating Meteomatics Weather API Data Into GIS Workflows
The Meteomatics Weather API features over 1800 parameters from more than 110 weather data sources. Many spatial problems also involve a weather aspect, and being able to seamlessly integrate Meteomatics data into GIS workflows is an incredibly useful feature for many of our customers.
WMS Data
Meteomatics data can be connected directly to ArcGIS via the WMS service available through our API. This is appropriate for customers who simply want some visual indication of the relative state of the weather. WMS is a protocol by which bitmaps can be shared, but this doesn’t include the numerical values of the data. For this kind of behavior, customers will need a more advanced solution.
Weather Visualization with MetX
Users who want to utilize an advanced weather data visualization toolkit complete with numerical data interrogation and graphing options should consider MetX, our bespoke weather visualization program.
Geoprocessing Workflows
Imagine you want to enhance the example of site suitability above by adding weather data. Perhaps, rather than gyms, you’re trying to find the best location for a new restaurant with outdoor seating, and are looking for a place with the best average conditions. Or perhaps you’re interested in road icing, so that you can determine how safe journeys to your store locations are, and estimate footfall in real time as roads become perilous to travel.
These kinds of tasks could admittedly be done programmatically in Python or a similar language, but the ArcGIS interface allows users to implement this kind of analysis through a GUI, without the need for scripting.
ArcGIS really comes into its own due to the huge number of geospatial datasets which are available to users via the ESRI Living Atlas. From within any ArcGIS project, users can import any data which is made available on the Living Atlas, including many ESRI datasets as well as any user created content which has been published there. Things like transport networks and population data in a ready-to-use format allow you to use weather API data for more advanced problem solving — for instance, calculating the risk of icing along a transport network.
Every one of the ArcGIS geoprocessing tools can be applied to spatial data from the ArcGIS GUI without needing to code — although all of these can also be applied from within a Python context by using the ArcPy package. This all leads to an enormous amount of flexibility in how you break down and perform your analysis. The weather data required to power these tools is available from the Meteomatics API and can be imported into ArcGIS to facilitate these solutions.
Getting API data into ArcGIS can be done in a variety of ways, which we will explore in tech blog articles:
1. Simply manually downloading Meteomatics data before then opening it inside of ArcGIS is sufficient for many studies.
- Some Meteomatics data is already appropriately formatted for ArcGIS (raster data)
- Some Meteomatics data requires additional formatting (feature data) before it is ready to be viewed in ArcGIS (Programmatic reformatting is often required here)
- The subsequent analysis of the data may then take place using the Geoprocessing toolbox from inside of ArcGIS, or using the same tools (as well as whatever other Python functionalities one might want) inside of a Python script
2. In applications where live, real-time data are required, for instance in a weather condition monitoring dashboard, a Python script must be set up to continually call the API and update the data inside of ArcGIS.
Real-time Acquisition and Display of Meteomatics Data in ArcGIS Pro
The focus of this article is on the real-time acquisition and display of Meteomatics data inside of ArcGIS Pro. We’ll explore the analysis of weather data using the Geoprocessing toolbox in a future article.
In this example, we'll explore the use case of importing weather data for a number of individual locations and setting up a script such that this data updates at regular intervals. The toy location dataset is a comma separated list of latitudes and longitudes which correspond to European airports, and we’ll pull in some weather data which might be useful in determining whether or not it’s safe to fly.
Data Representation in ArcGIS: Raster or Feature Dataset
Before we begin, let’s quickly consider how data is represented inside of ArcGIS. Like most GIS programs, ArcGIS thinks about data as either being a “raster” or a “feature” dataset. Generally speaking, rasters are designed to represent data which varies continuously over a large area, whereas features are used to represent data associated with discrete objects. This definition can get a little confusing because the raster representation of a continuous variable looks like a grid of discrete objects, and some rasters can represent discrete data or booleans. The difference between the two is best illustrated graphically, and I include some schematics below.

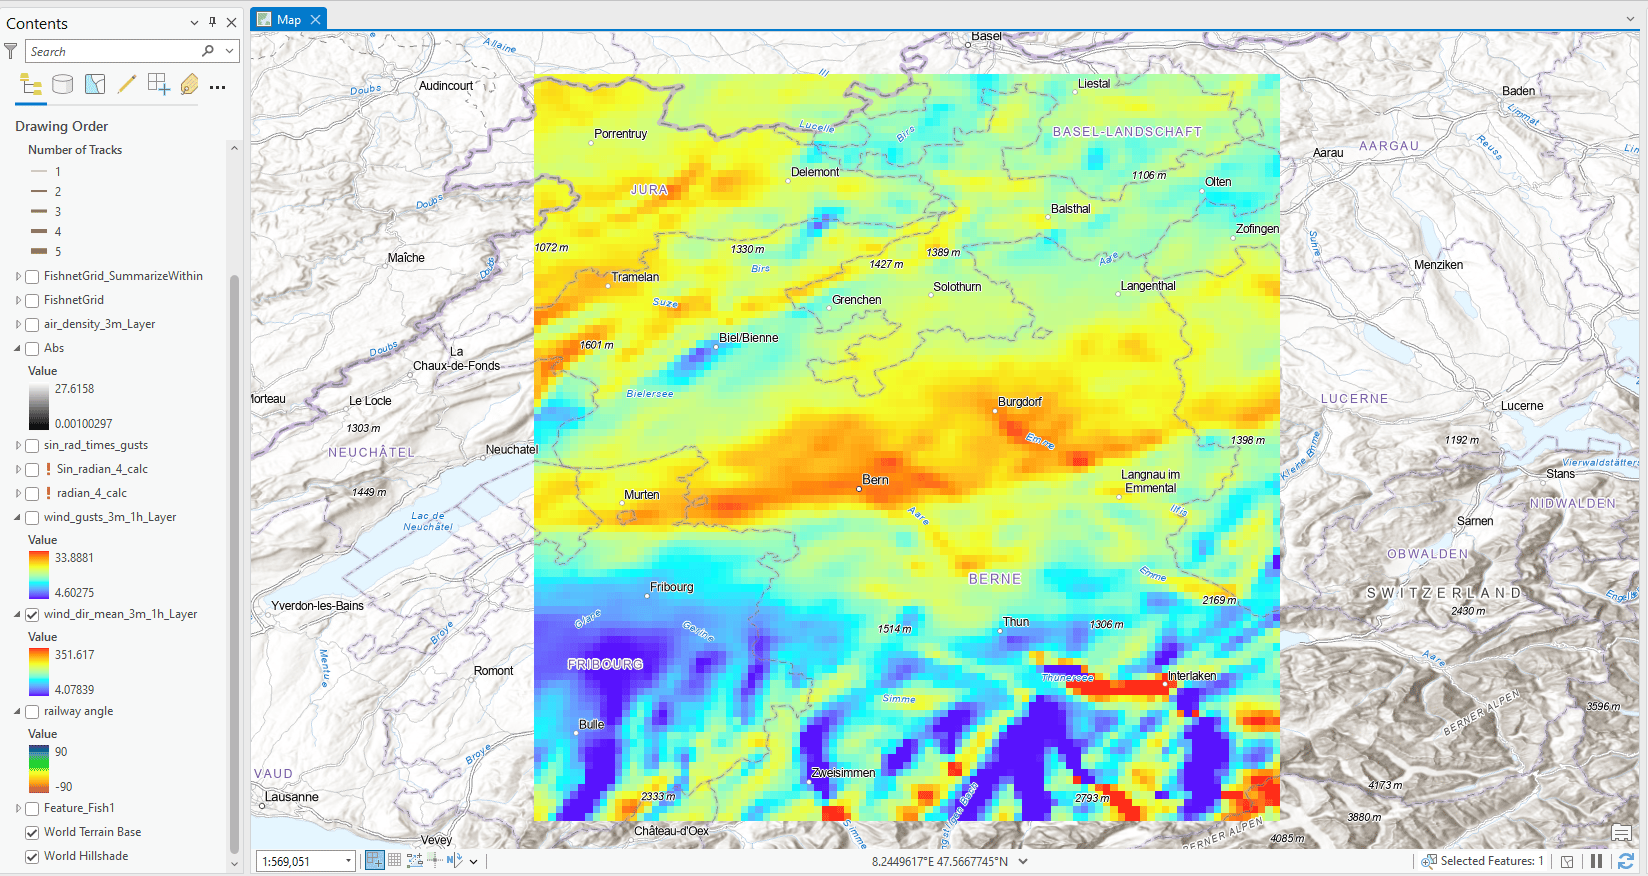


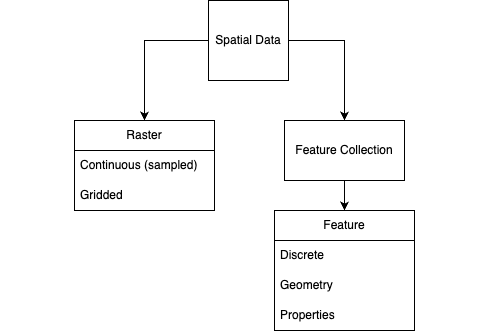
Figure 4: A schematic representation of the types of data in ArcGIS. Raster data is a sampled view of some continuous dataset; a Feature Collection is, as the name suggests, a collection of features, which may in general be Polygons, Lines or Points. Features all need to have geometry associated with them so that they can be brought into an ArcGIS map.
Getting API Data
In this use case, each airport is a feature with which we can associate weather data. In the context of the API, we can request some weather data for these locations in a JSON or XML format, which will look something like this:

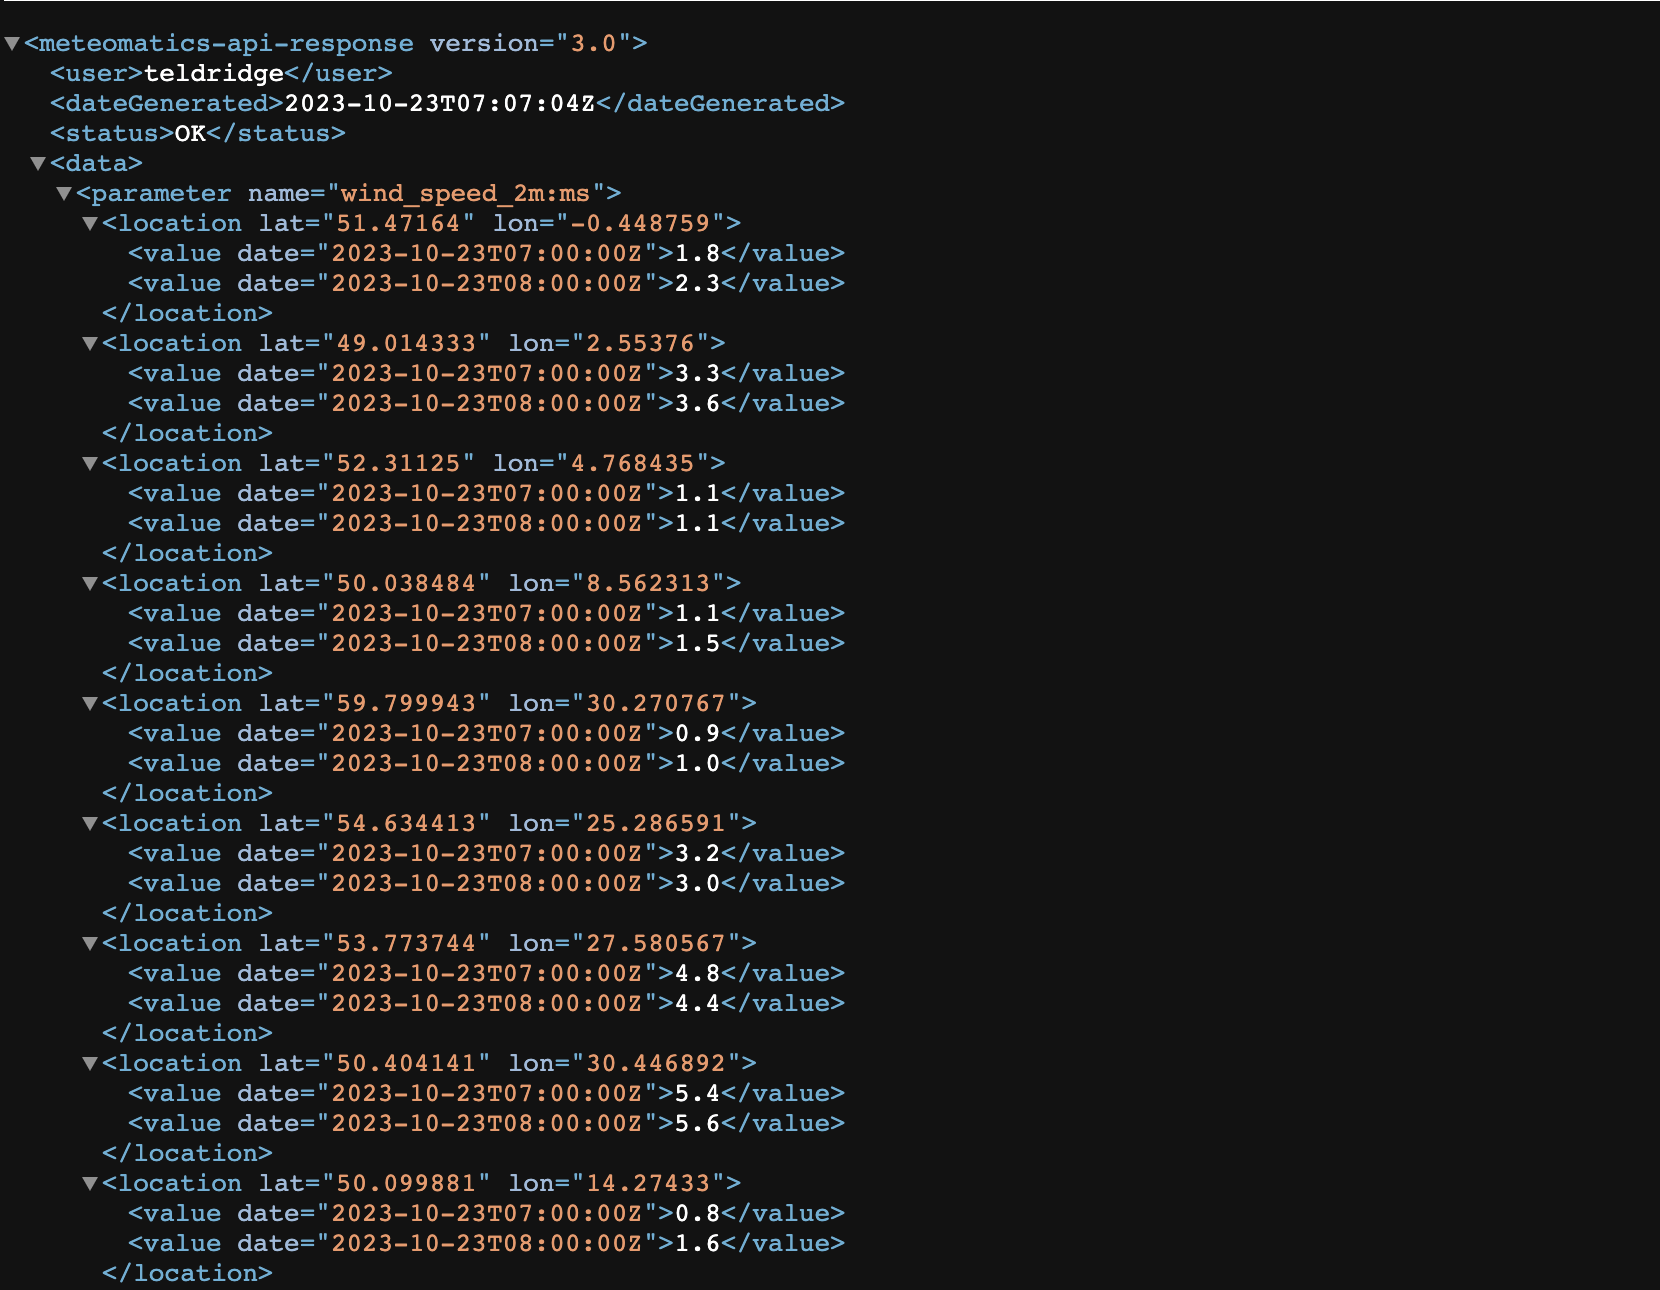
Before we can drag and drop this data into ArcGIS, we need to do some reformatting of it. Specifically, we need to tell ArcGIS what the features are in this dataset, and assign the latitude and longitude to a “geometry” attribute so that ArcGIS knows, when opening the file, to treat this as the location data. Because we’re going to have to do that for every location in the feature set, we’re going to want to do it programmatically.
from meteomatics import api
import datetime as dt
import pandas as pd
import numpy as np
import geopandas as gpd
from shapely.geometry import Point

airports = pd.read_csv('poi_european_airports.csv', header=None, index_col=[0, 1])
airports['ID'] = (np.arange(len(airports))+1).astype(float)

df = api.query_time_series(
 airports.index.values, NOW, NOW+STEP, STEP, PARAMS, USERNAME, PASSWORD
).xs(
 key=NOW.strftime('%Y-%m-%d %H:00:00+00:00'), level=2
)
# have to make sure the index name and MultiIndex names are the same
airports.index.name = df.index.name
airports.index.names = df.index.names

combined = pd.merge(df, airports, left_index=True, right_index=True)
geom = [Point(coord[1], coord[0]) for coord in df.index]
gdf = gpd.GeoDataFrame(combined.assign(coordinates=geom).reset_index(), geometry='coordinates')
gdf.to_file("latest_data.geojson", driver='GeoJSON')
My “airports” variable comes from a .csv of points of interest referring to European airports, but doesn’t have any other information than the airport locations, so I give each airport an arbitrary ID. The dataframe returned as “df” takes a certain form due to the Python connector; I use .xs to reprocess this so that it can be merged with the airports dataset; I also rename the airports dataset correspondingly, before merging the two, defining the geometry attribute, creating a GeoPandas GeoDataFrame and writing the result to a GeoJSON. The resulting GeoJSON looks like this:

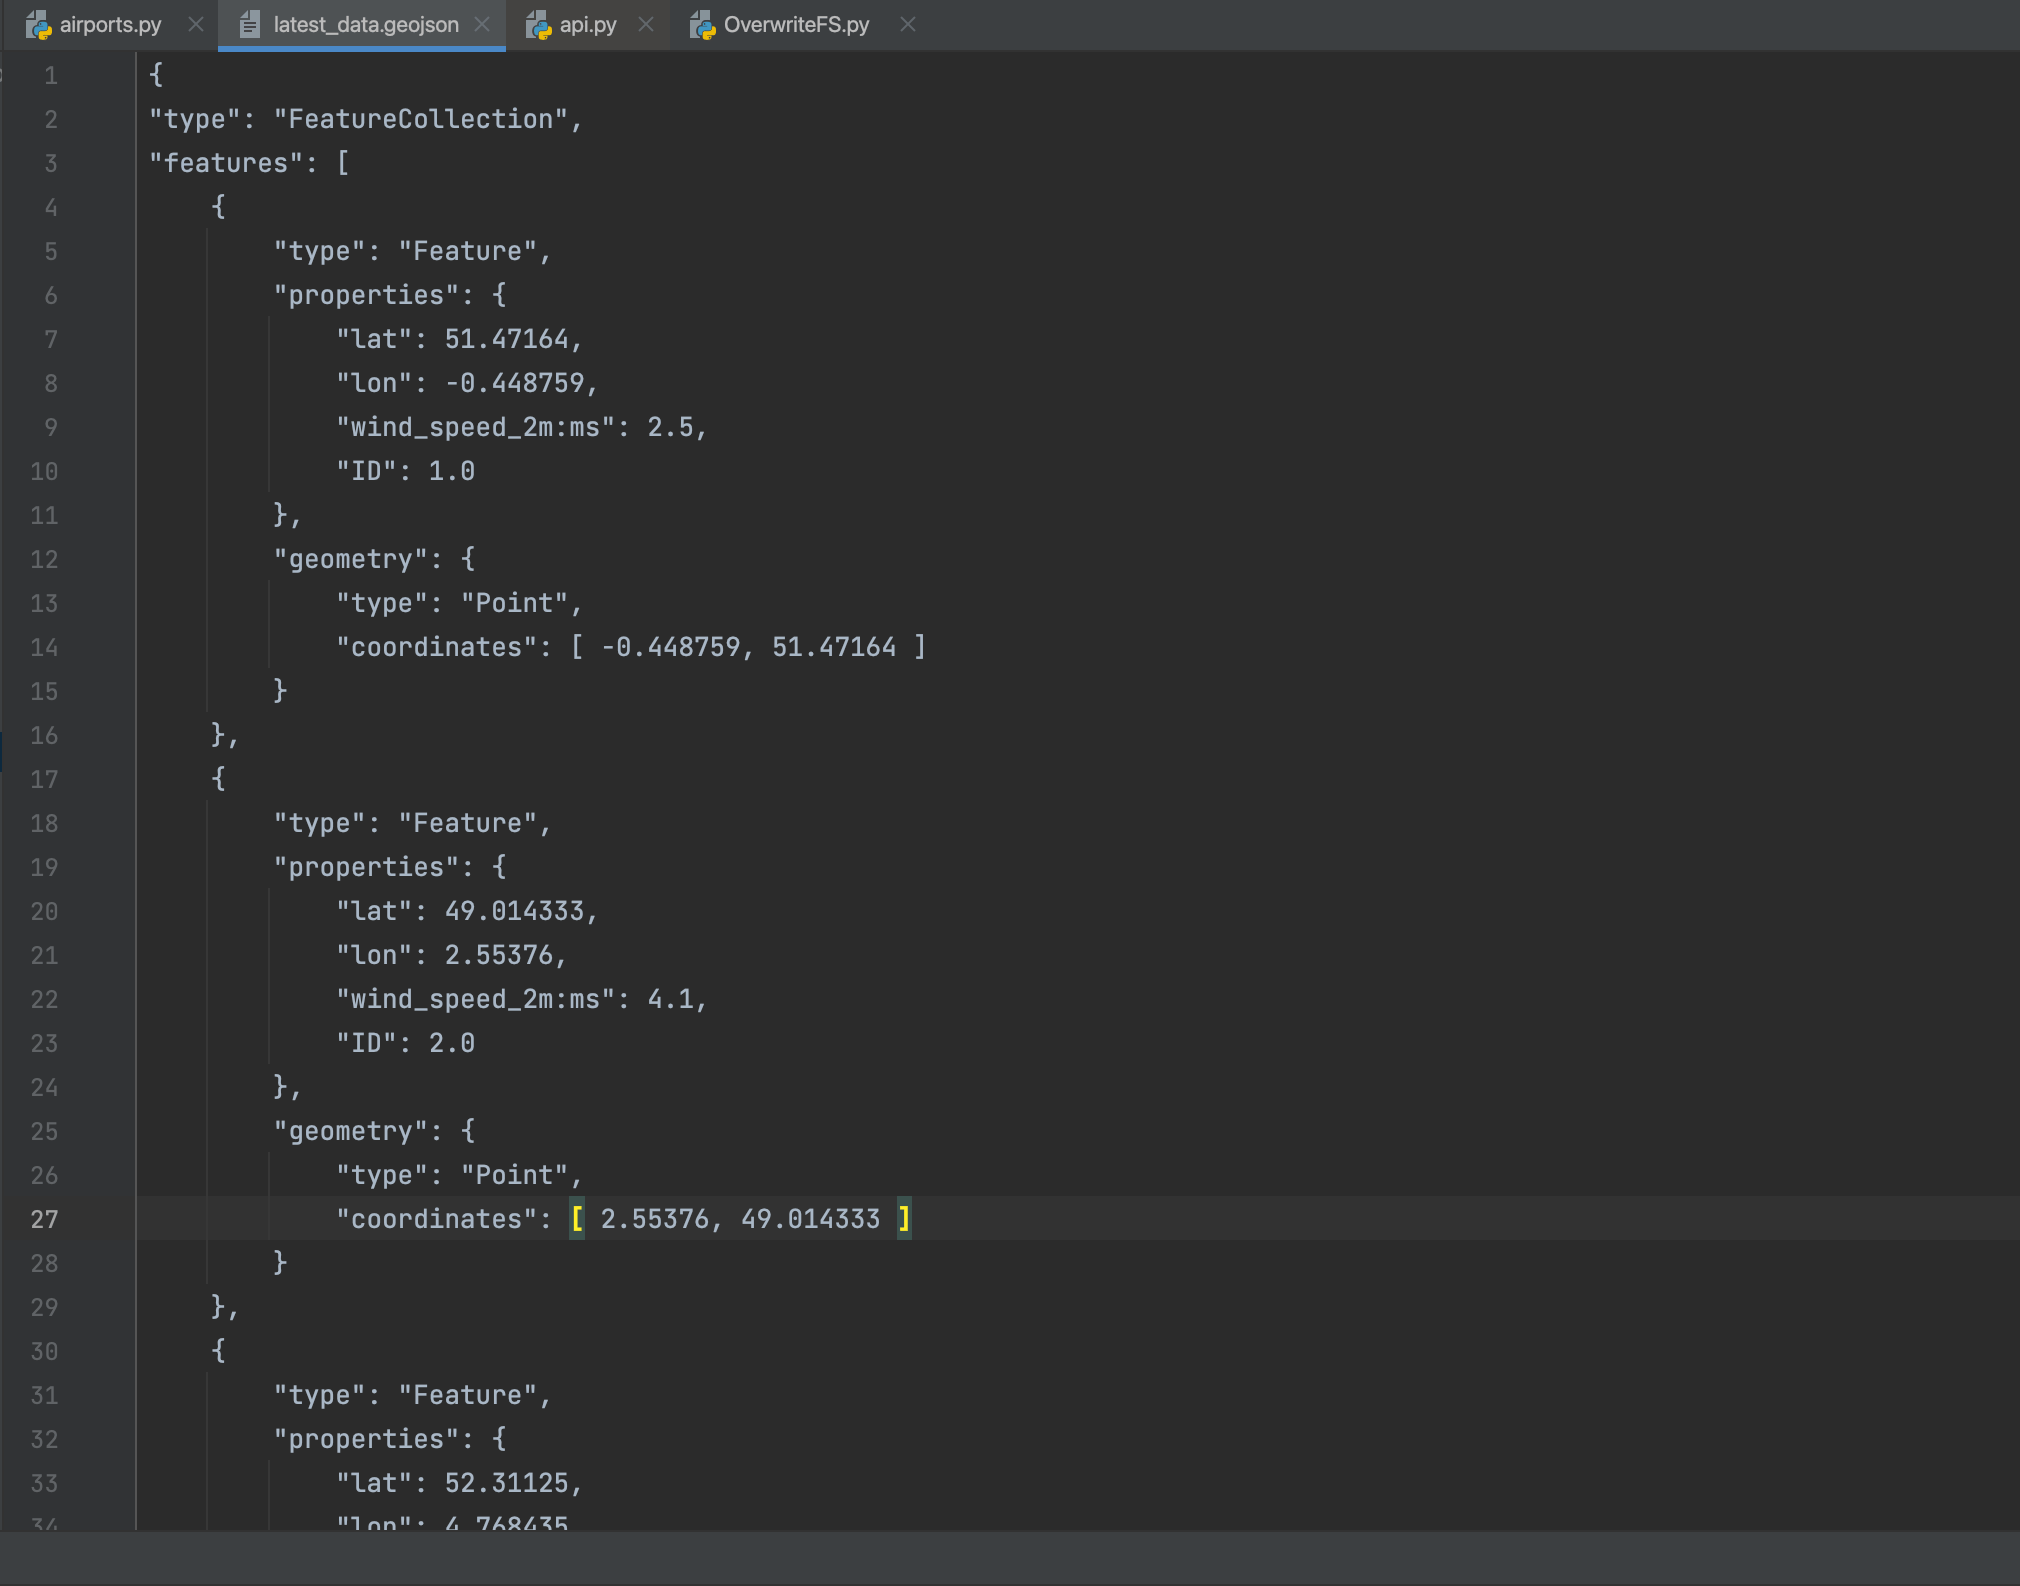
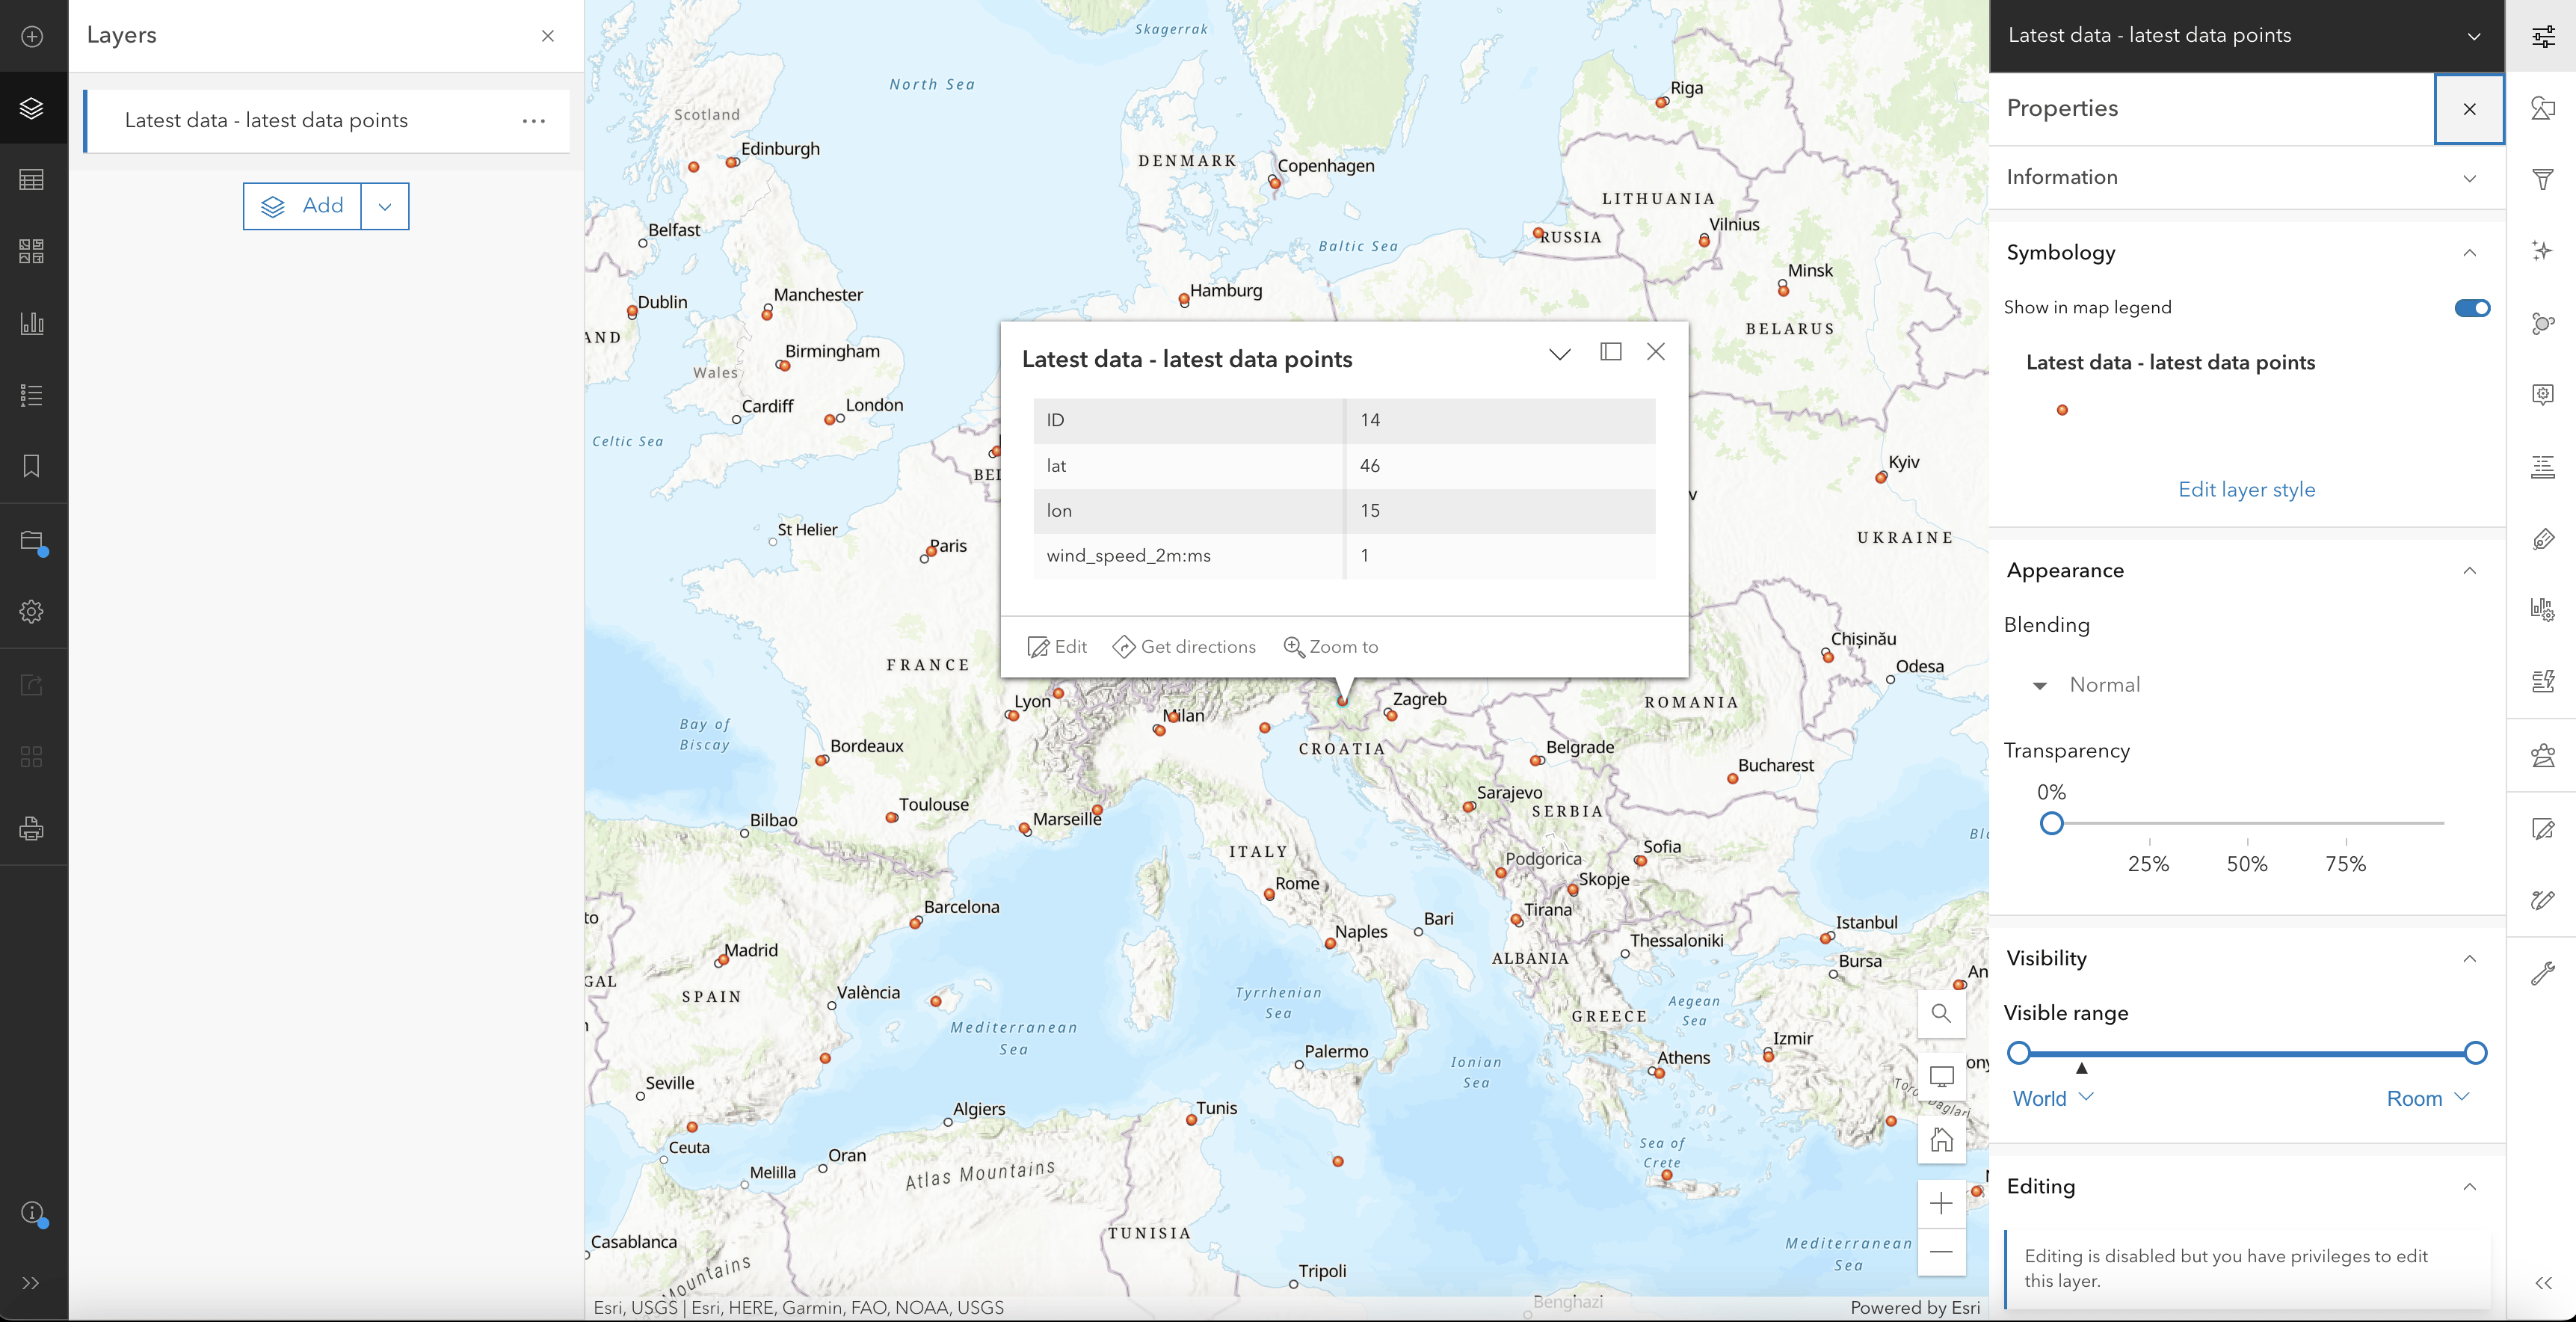
This data is now formatted in such a way that it can be imported into ArcGIS, as is shown below:

Automating the Process
We’ve now seen how we can format an API response to make it suitable for using in ArcGIS. In the last step, we manually opened an ArcGIS map and added the data to it. In order to set up a regular refresh of the data without the need for a manual drag-and-drop, we first need to automate this step.
A few specialist Python packages are required to finish off the script. Specifically we’ll need to use ArcPy to create some GeoDataBases and the ArcGIS package to update the features in the GDB.
My code for automating the process of replacing data in ArcGIS with data newly acquired from the API can be found on the Meteomatics GitHub pages. The script is well commented, and you should be able to find the relevant sections that you need to update for your needs.
Here is a brief description of the steps in the process:
- Two GeoDataBases are defined: the workGDB, which is used throughout the script to prepare the data to be uploaded to ArcGIS; and the liveGDB, which holds the data currently being displayed on ArcGIS, and which is overwritten at the very end of the process.
- The code from earlier is used to fetch API data for our airports and to write this to a GeoJSON. The ArcPy module is used to convert this appropriately formatted data into an ArcGIS feature layer.
- The deploy logic function is called to replace the liveGDB with the workGDB.
Creating a Batch Process
The script in the previous section can replace data in an ArcGIS map with data downloaded during the running of the script. The final step in creating automated updates is running the script multiple times without needing to manually call it.
Of course, one straightforward way of doing this would be to create a “for” loop in the Python script itself. The disadvantage to this method is that it will only work as long as the Python script is not interrupted, which can easily happen if you turn off your computer.
An alternative to this method is to create a .bat process or shell script which calls the script on a regular basis. This is the procedure we’ll learn today.
The first thing we need to do to make our current script compatible with this method is to make it callable from the command line by adding the
__name__ == '__main__'
code at the top of the script. If there are any arguments that we want to pass to the script from the command line, we can also import the “sys” module and unpack these arguments within the script using sys.argv. For instance, if you want to pass in the locations of your points of interest from some external location, instead of keeping them in a fixed location relative to the script as I do.
Essentially all you need to do to create a batch process is to type the command you want to be regularly executed on the command line into a plaintext file, with the non-python arguments each wrapped in inverted commas, and then save the file with a .bat extension. My file looks like this:
"C:\path\to\my\python.exe" "C:\path\to\my\script.py"
If I needed to add any command line arguments to the Python script, these would not need to be wrapped in “”. Make sure when you save the file you either save it as a .bat file (if this is available in your Save As… dropdown) or type the .bat extension yourself and select “all files” from the dropdown.
Now we simply need to schedule this task using the Windows task scheduler. To do this:
- Open the task scheduler from the Windows menu
- Select “Create Basic Task” from the “Actions” menu
- Give your task a name and description
- Click “Next” — this takes you to the Task Trigger tab
- Follow the wizard to schedule the task at the frequency you want. Don’t worry if you have a higher frequency task in mind — we can edit this in the next step
- Now that we have created the task, we can see it in the Task Scheduler. Clicking on it will open a “Selected Item” context menu under “Actions”. From here, select “Properties”
- Switch to the “Triggers” tab in the popup window, select the trigger that you previously created and click “Edit”
- Now under “Advanced settings” you should be able to increase the frequency of your scheduled task
Results
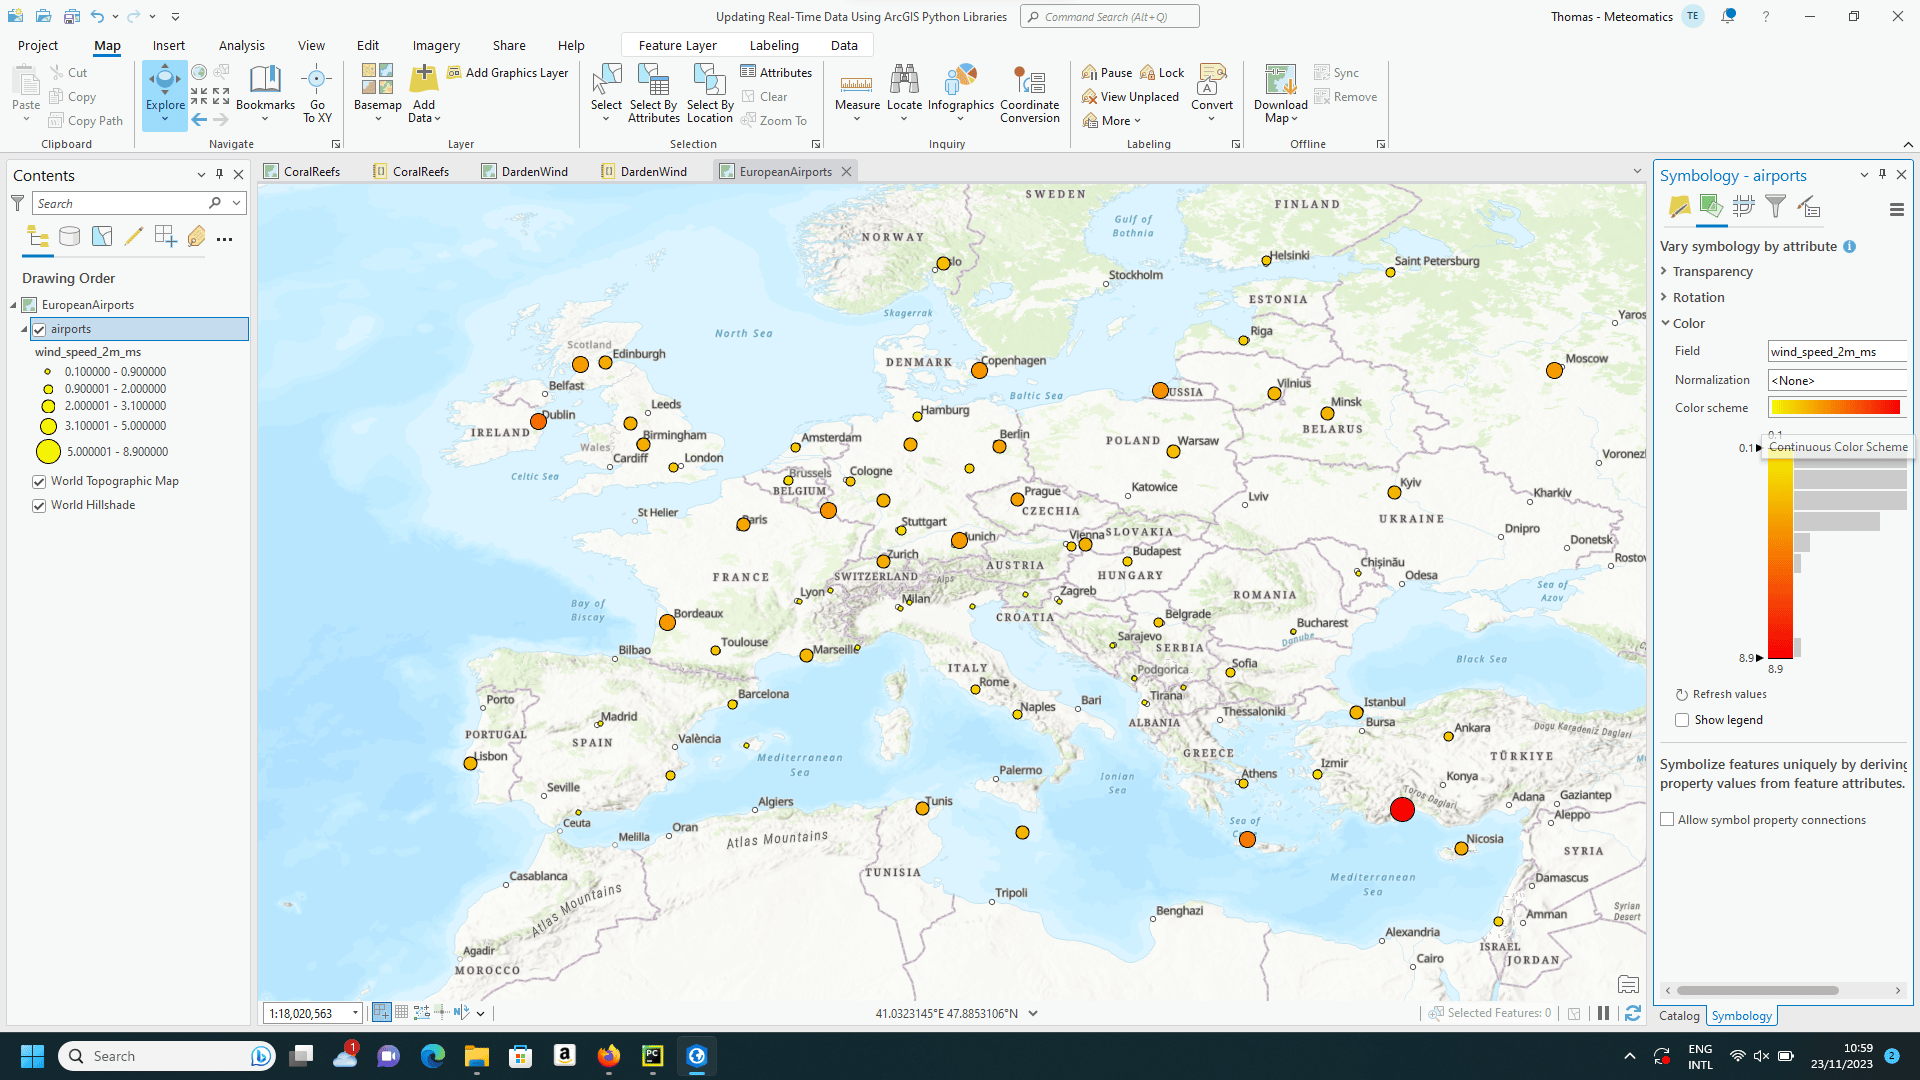
The nifty thing about establishing a real-time connection to the API is that we can apply workflows in ArcGIS to the data which will be updated when new data comes in, allowing us to quickly visualize changes to the data. For instance, in the example below I have updated the symbology of the airport features to generate a larger point with a redder color for the higher wind speeds in our dataset. The maximum wind speed achieved at this time – 8.9 m/s at Ankara airport – is probably not something aviators need to be particularly concerned about, but the general idea is obvious: if we made the symbology conditional on the live data, we would see live updates to the symbols and be alerted if we needed to take action.

This general principle can be extended to a variety of GIS concepts. In fact, if you define a workflow either in ArcGIS Pro or in the ArcGIS Python API, you can reapply that workflow automatically to new data and see the results of the analysis update in real time.
Summary
In this article we explored some of the advantages to using ArcGIS for geospatial analyses, as well as the power of combining weather data with the geoprocessing tools available in ArcGIS. We learned how ArcGIS represents data, and saw how to process Meteomatics API data to make it compatible with ArcGIS, as well as how to automate the processing of API data so that updates can be made to an ArcGIS map whenever new data is available.
This clearly isn’t the full extent of what ArcGIS can be used for, and more articles on the Tech Blog will shortly demonstrate some of the workflows you can implement within ArcGIS using Metetomatics data. In the meantime, if you have both an ArcGIS and a Meteomatics subscription, why not use them together and explore the possibilities yourself? If you have any exciting ideas to share, please don’t hesitate to get in touch!

Talk to an Expert
Related Articles


We provide the most accurate weather data for any location, at any time, to improve your business.