04/02/2024
What Affects Data Quality?
Accuracy, Precision, Spatial and Temporal Resolution Explained

There are many weather APIs out there, and knowing which one to choose can be a difficult task. At Meteomatics, we believe that the single most important consideration when choosing a weather API should be data quality. In this article, I will spell out some of the ways in which the quality of weather data can be described, and why we believe that the Meteomatics Weather API performs outstandingly across all of these definitions.
Data Quality: A Multi-Faceted Term
Data quality itself is a multi-faceted term. Data can be high quality in some regards but lower in others, and this particularly applies to weather data, which has additional requirements associated with the spatial and temporal components of the data. Several factors affect the quality of your weather API data. Some of these apply to all data generally, such as accuracy and precision, whilst others are applicable to weather data in particular, like spatial and temporal resolution.
Accuracy and Precision
The two key terms accuracy and precision are the most important descriptors of any dataset, be it weather-related or otherwise. Although they are often used interchangeably, each actually has a very specific meaning.
What is Accuracy?
Accuracy is the question of whether a measurement or prediction is correct or not. If I flip a coin, the results can either be heads or tails. If I guess heads and the answer is heads, I was correct. If a series of 10 throws gives us
HTHTTTHTHH
and I guessed
HTTHTTHTTH
Then I got 7/10 of my guesses correct: I was 70% accurate. In a numerical dataset we often don’t classify data points as “correct” or otherwise; instead, the measure of accuracy is how different the predictions are from the observations, on average (with an average of zero, which can only be achieved if every difference was also zero, being the indication of perfect accuracy).
What is Precision?
Precision might also be thought of as confidence. If you ask me where your keys are, and I say they’re “somewhere in this room”, I might be correct, but clearly I’m not very confident that I know exactly where they are. If, instead, I assert that they are underneath the papers at the back left corner of the table you’re sitting at right now, I’m being much more precise. A precise measuring tool is one which gives you a more specific answer: if I have a ruler which only has markings on it every centimeter, I can only measure the length of something in centimeters; if, on the other hand, I have a ruler with millimeter divisions, I can be 10x as precise. In terms of a dataset, precision is a measure of the spread of results.
An Example
Let’s say the true temperature of a room is 21.1ºC (but I don’t know this initially). I want to determine the temperature, so I measure the temperature using my thermometer four times, and take the average. Initially, my thermometer only has marks on it every 1ºC. The measurements I make are: 20, 22, 21, 21. The average of these values is 21ºC, and their spread is 2ºC.
This is not a bad result but my friend has just given me a thermometer with 0.1ºC markings. I want to use this to measure the temperature in the same way. I record: 24.8, 24.9, 24.7, 24.8, giving me an average of 24.8ºC with a spread of 0.2ºC. This is much more precise, but less accurate, since the difference between my measured value and the real value is much higher.

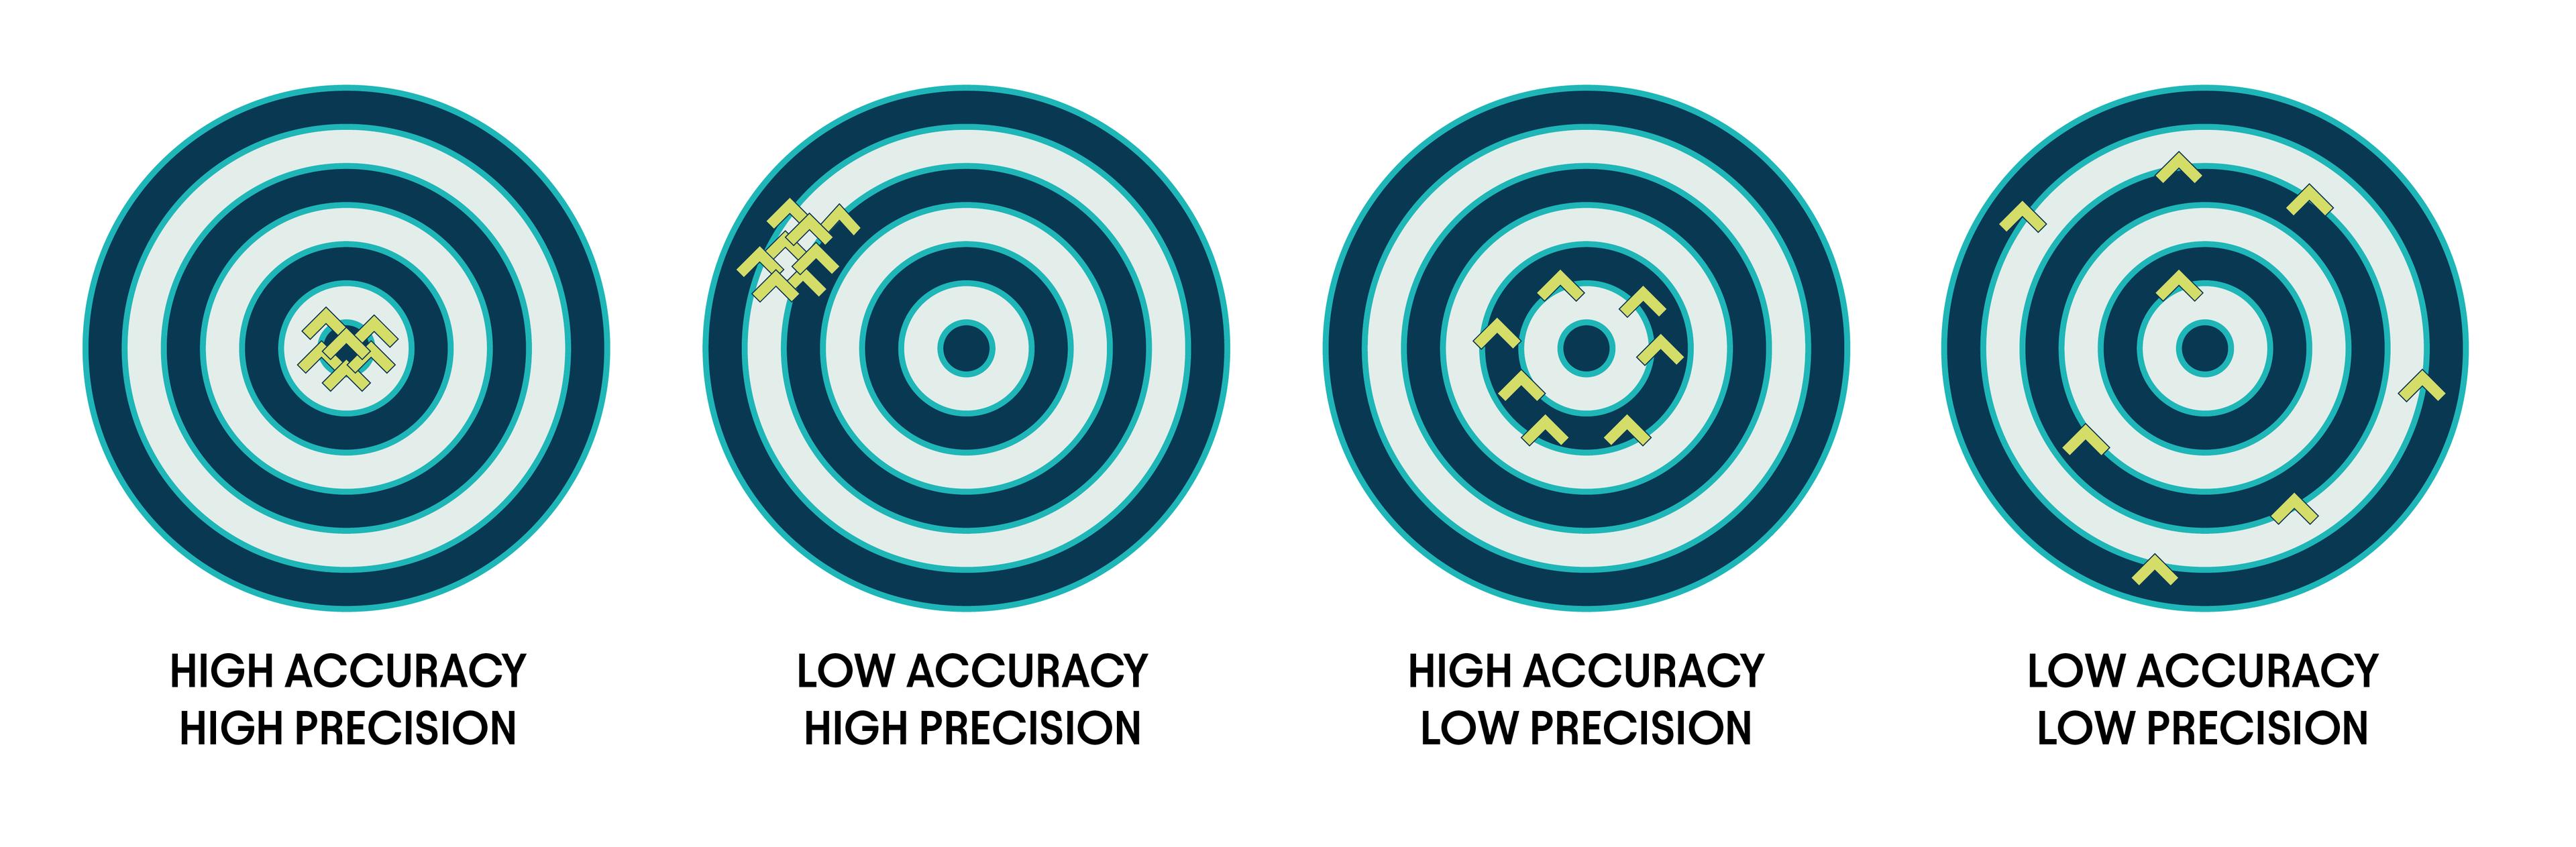
Which is more important?
Outside of a meteorological context, for some use cases you might be happy with data that is either accurate or precise.
If you have a highly precise process which is not accurate, you may be able to determine a systematic bias and remove this from the data. To take the archery metaphor as an example, if you have a machine which is always hitting the same point in the outer ring, you could manually reposition the machine (or the target) so that the offset is compensated. This might also explain the problem I had when measuring the temperature for the second time above.
Perhaps there is a systematic bias with the second thermometer (the scale might be drawn on in the wrong place, for instance) which we could remove if we calibrated the thermometer against a target with a known temperature. You could also imagine a situation where low precision is fine, as long as accuracy is decent. For instance, if you want to know how busy a restaurant is, it might be ok to count the number of occupied tables, rather than the exact number of people at each table.
The techniques required to take account of lower accuracy or precision, however, are sometimes difficult to implement, and in general poorer data will lead to poorer results.
Spatial and Temporal Resolution
In addition to the factors mentioned above, weather data is made more complicated by the fact that it has both a spatial and a temporal dimension (that is, the state of the atmosphere changes as you move in space and in time). Each of these dimensions has a resolution associated with it, affecting the appropriateness of the data for certain kinds of problem.
What is Spatial Resolution?
Weather forecast data from Meteomatics is delivered on a regular grid. The spatial resolution of a weather forecast is the distance between data points on the grid. A model which predicts the temperature every 1 km along the Earth’s surface has a higher spatial resolution than a model which predicts the temperature every 10 km.


What is Temporal Resolution?
Weather forecast data is also provided at regular time intervals. Some forecasts produce a prediction for every hour of the day; some only produce predictions every three hours; others only every six. These are the temporal resolutions of the datasets; the lower the time between predictions, the higher the temporal resolution.
Figure 1 shows a time-series of temperature data forecast in St. Gallen by the Meteomatics EURO1k model, showing the difference between querying data at the native temporal resolution of the model (20 minutes) and a lower resolution of 3 hours. Note, for instance, that the high-resolution data at 7 hours ahead is approximately 5ºC, but if you were to interpolate between the data points from 6h and 9h you would arrive at a very different conclusion.


An Example
Let’s say you’ve just gotten off the train at Greenwich station in London, and you want to know whether it will be raining at 12pm. You’re standing at the coordinates 51.4779N, -0.0132E – roughly 800m west of the Greenwich Meridian, and you have two models to choose from: one with 1 km resolution and the other with 10 km resolution.
The 1 km model gives you a prediction for 2 mm of rainfall at Greenwich observatory, and a prediction of 0 mm at a point about 200m to your west. To figure out what is likely to happen at your current location, you need to take a spatial average of these two. Bearing in mind that one of the data points is 4x closer to you than the other (so you trust it 4x more), you calculate that the predicted amount at your location is 0.4 mm.
The other dataset also tells you that there will be 2 mm of rainfall at Greenwich observatory, but can’t tell you anything about the point 200 m to your west: its next data point in that direction is 9.2 km away! It tells you that, at that location, there will be 0 mm of rain, so you calculate that the rainfall at your location will be 1.843 mm. Which of these two predictions do you think is more likely to be correct?
You now walk over to Greenwich observatory, which you arrive at by 12pm. Sure enough, it is raining – although, you guess, probably not at a rate of 2 mm per hour (forecasts are rarely perfectly accurate, after all). You want to know whether it will still be raining in 90 minutes. Spatially, it doesn’t matter which of the forecasts you choose, since both make a prediction for the precise location you’re standing at.
However, one has a temporal resolution of 1h, whereas the other has a resolution of 3h. The 1h dataset predicts that it will be raining at a reduced rate of 1 mm at 1pm, and will stop entirely by 2pm, so you reason it will be raining at a rate of about 0.5mm by 1:30pm. The 3h forecast can’t tell you anything about 1pm or 2pm, but at 3pm it thinks it will be raining at a rate of 1 mm. By the same logic, this forecast is telling you to expect 1.5 mm at 1:30pm. Taking a look at the 1h forecast for 3pm, it also predicts that it will again be raining at that time, agreeing with the 3h forecast on the amount too!
The higher the resolution, the higher the accuracy and precision
The resolution of a dataset, be it in the time- or space dimension, is a kind of built-in limit to precision. In the above example we saw that both our datasets were in agreement with each other at the grid points. Right or wrong, at these locations they were just as accurate as each other. However, when asking what is happening in between grid points, the dataset with the higher resolution gives more information: the 1h dataset predicted that, within three hours, the rain would briefly subside before beginning again; this fine detail was not picked up by the 3h dataset. Similarly, both datasets assessed that, at 12pm at Greenwich observatory it would be raining, whereas to the west it would not be; it is only by looking at the dataset with the higher spatial resolution that we can see that the area near Greenwich station marks the edge of the raincloud at this point in time.
Trade-offs Between Spatial and Temporal Resolution
Often there is a trade-off between spatial and temporal resolution, since the two multiply together to give the total number of data points in a dataset. This trade-off is partly motivated by user requirements – you wouldn’t want a file which is going to eat up all the memory on your computer if the high resolution doesn’t translate into improved results – but is also motivated by the need to produce a forecast in time.
Each data point in a weather forecast has to be calculated using a complicated computer model, and each calculation takes time. The higher the resolution of your model, the more calculations the computer will have to make, and the longer it will take to produce, so there is a natural limit for how resolved we want our models to be: if the forecast can’t be produced reasonably far in advance of the weather events it is trying to predict, then it is of little usefulness in making predictions.
Modern computational methods facilitate the increasingly rapid calculation of weather model data; however, to really speed up the production of model data, some internal shortcuts will be used. Hence, a model which rapidly produces data at both a high spatial and temporal resolution may be underpinned by less rigorous model physics, and the skill of the forecast may be compromised.

Talk to an Expert
Related Articles


We provide the most accurate weather data for any location, at any time, to improve your business.