07/19/2023
Lucille Borlaza Researches the Impact of Air Pollution on Health
Ask an Academic Series — How Researchers Use Our Data

For researchers with an interest in weather and climate data, a source of hassle-free, ready-to-use data is invaluable in bypassing the normally arduous process of obtaining and cleaning data from a variety of sources. At Meteomatics, we’re excited about the innovative ways researchers use weather data, and support this whenever possible.
Lucille Borlaza is a researcher in air quality currently living and working in New York. During her post-doctoral work at the University of Grenoble Alpes, France, she studied the effects of particulate matter pollution on health. In a paper titled “Impact of COVID-19 lockdown on particulate matter oxidative potential at urban background versus traffic sites”, her group used Meteomatics data to help study the effects of lockdown restrictions on the potential health implications of reducing the use of fuel-burning vehicles.
Air Pollution and Human Health
Pollution is a broad term, but generally describes substances introduced into the environment via human activity. Pollutants can take different forms — solid, liquid, gas — and can have different effects depending on their physical and chemical makeup. The focus of Lucille’s paper was particulate matter which is the collective name given to a variety of microscopic solids of various chemical species, which are small enough to be suspended in air, and can easily be inhaled.
The presence of particulate matter in the atmosphere is dependent on a number of factors. Meteorology plays a crucial role in the formation, transfer, dispersion and concentration of matter in the atmosphere. Atmospheric stability, wind patterns and precipitation have particularly strong effects here. These factors vary on both seasonal and day-to-day timescales.
Additionally, there are both anthropogenic (fuel burning) and natural (wildfire) sources of particulate matter, both of which vary on seasonal timescales: more fuel is burned for heating in the winter for example, whereas wildfires are more common in the summer.
Lucille’s study focuses on the oxidative potential (OP) of particulate matter. Species within particulate matter have different toxicity, some more harmful than others. OP is defined as the capacity of particulate matter to generate reactive oxygen species. When this occurs in the lungs, this can cause increased oxidative stress, which can lead to inflammatory responses and cellular death. OP is therefore a way of quantifying not just how much of a pollutant there is, but of how damaging it is to human health. Lucille hopes that it will help policy makers to know where efforts should be focused, when managing sources of pollution, in terms of having the best impact on health.
In the study, Lucille’s team compared particulate matter concentrations during spring 2020 with historical data and a “business as usual” case. The restrictions in place due to COVID19 at the time provided a unique opportunity to investigate the impact of significantly reduced human activity on pollutant levels and their health risks.
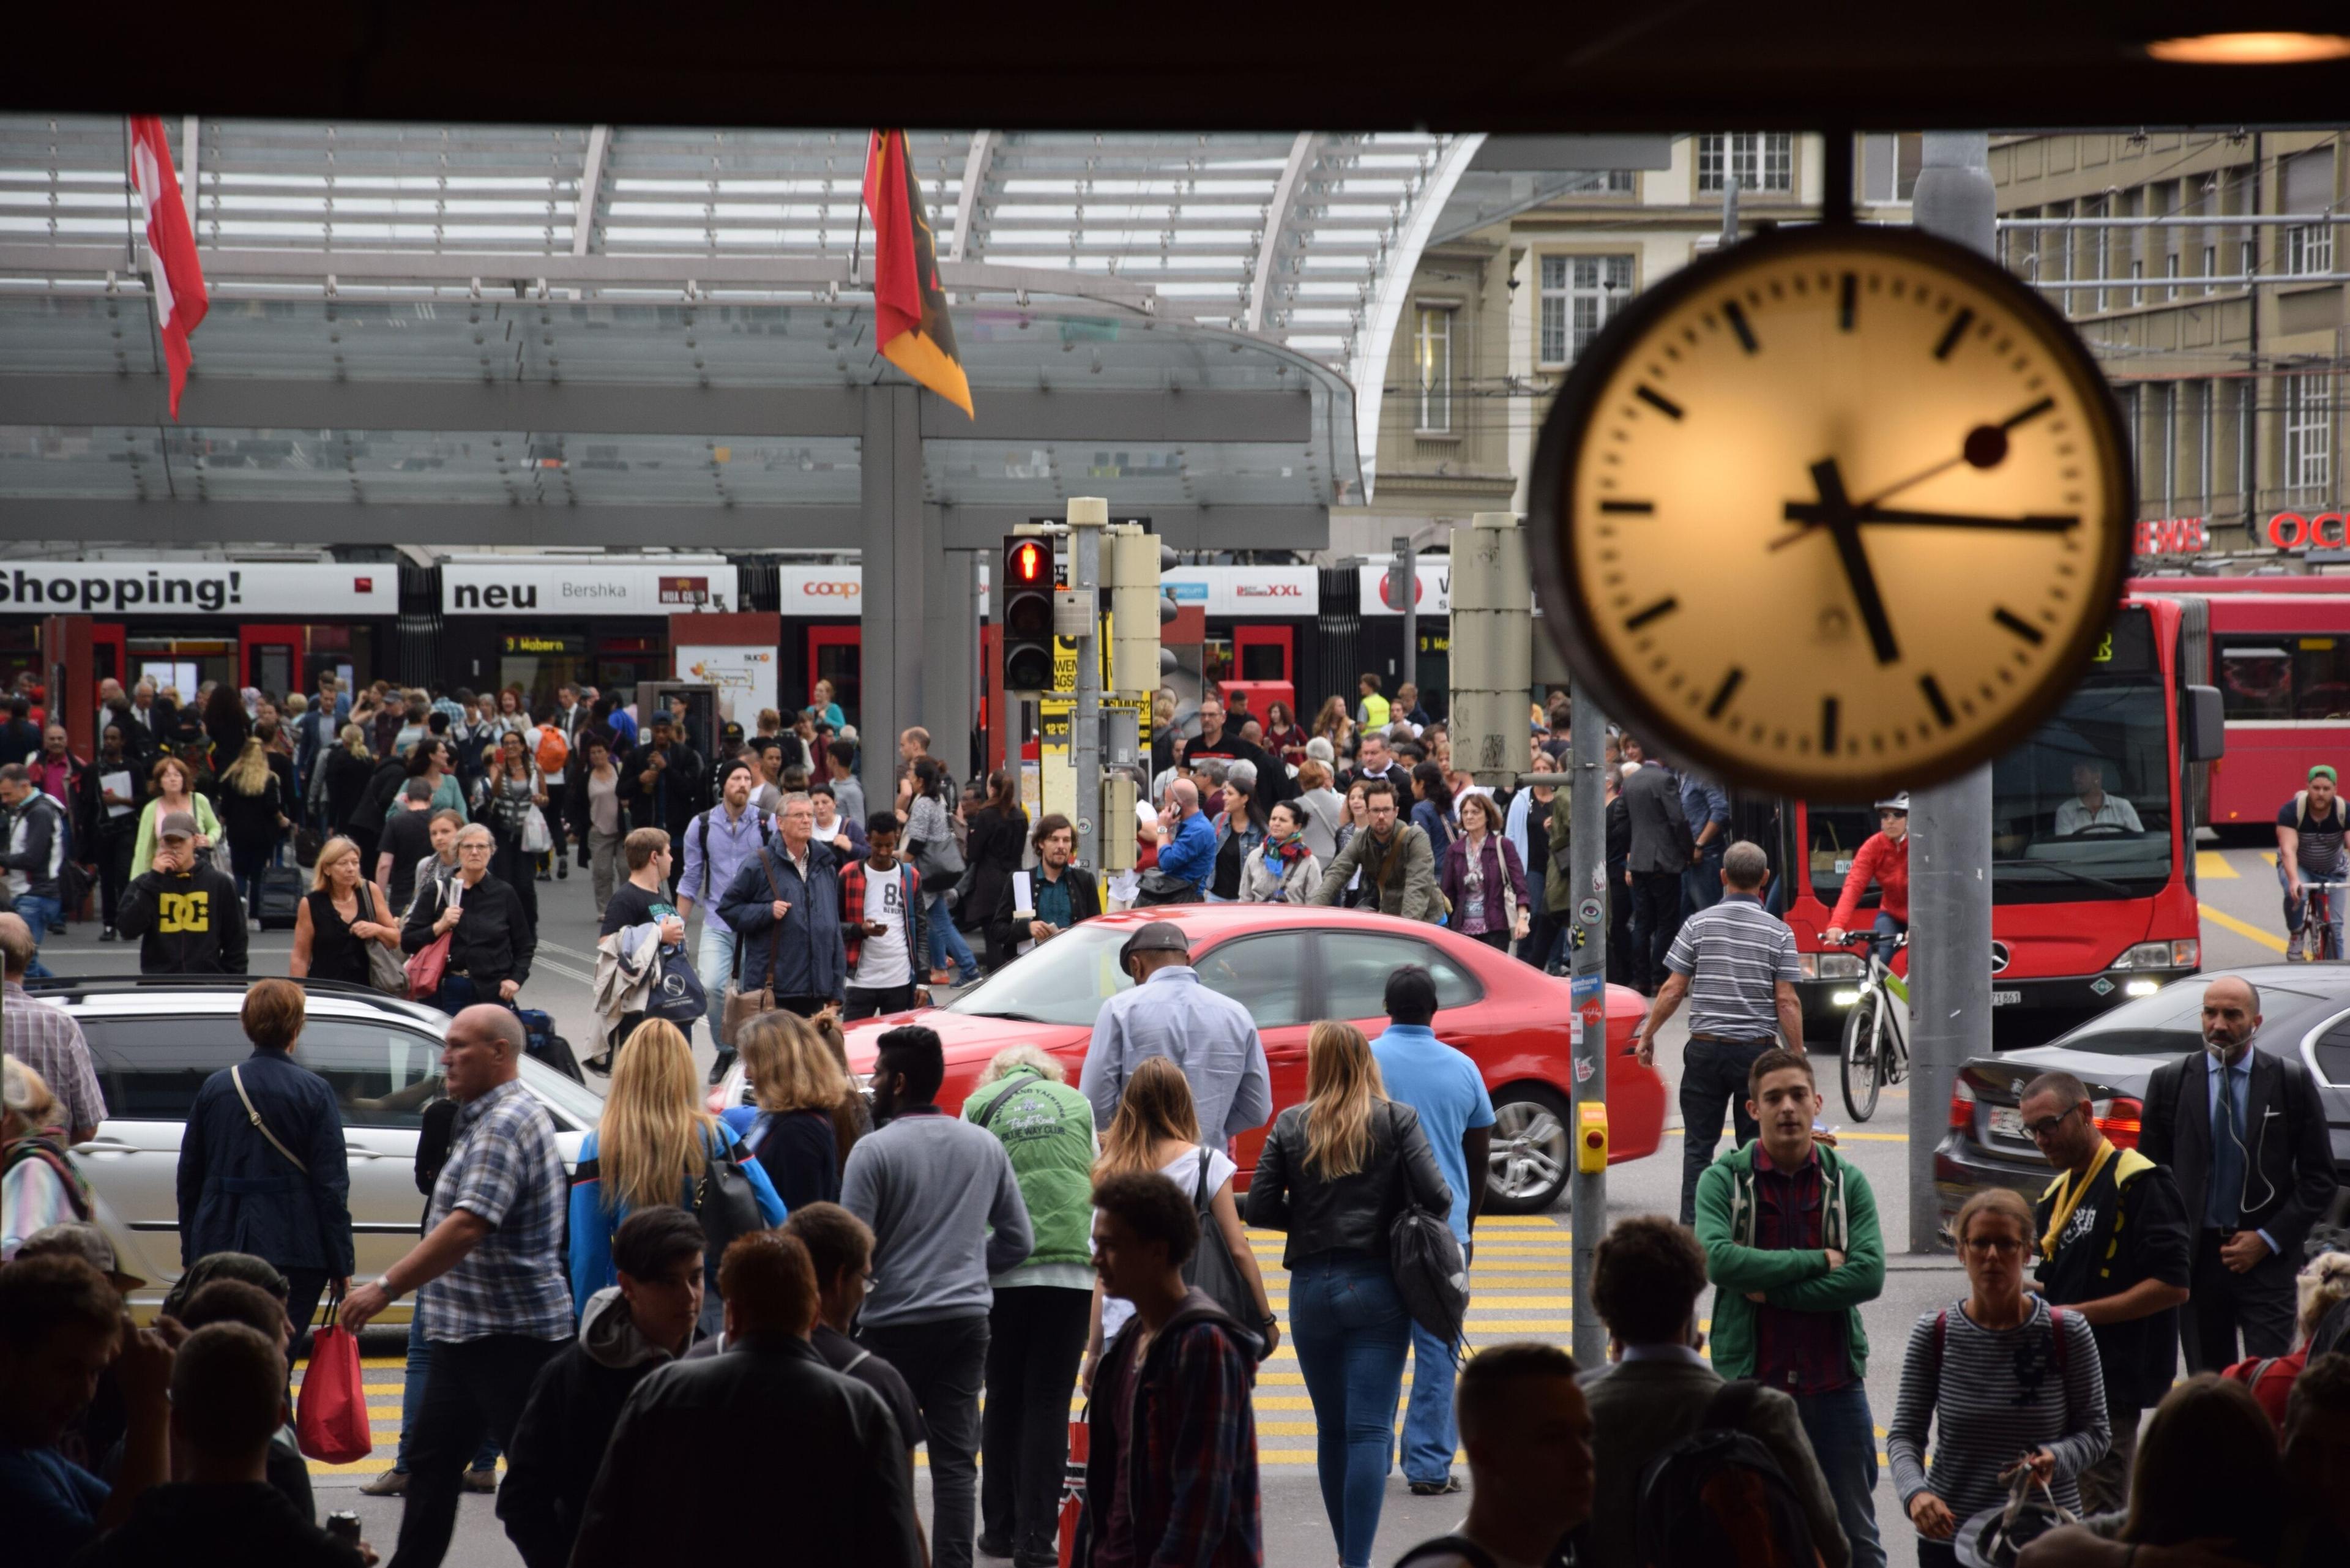
Rush hour in Bern's main train station, Switzerland.
Study Methods and Techniques
Lucille compared two sites: one at Grenoble, France, and another in Bern, Switzerland. The Grenoble site constituted an “urban background” site, since, whilst the area is built-up and hence not free from the impact on air quality of human behavior, the difference in traffic volume around the site caused by lockdown restrictions was not significant. In contrast, the Bern observations were obtained from a roadside location directly adjacent to the main train station, where traffic was reduced significantly during the study period.
At each of these sites, the study compares pollutant metrics from the long-term historical average for the given time of year with the observations collected during lockdown. Because the difference in pollution between the two sites was largely attributed to traffic, this allowed the researchers to quantify the effect that traffic has on air quality.
Lucille’s team recognized that the overall trend of pollutants in the 20-year historical dataset was decreasing, and hence that the difference between lockdown levels of pollution and the historical mean might not give the most accurate representation of the effects of traffic reduction, since a part of the effect could be attributed to the trend.
She therefore decided to repeat the comparisons, this time against a “business as usual”dataset. This synthetic data attempts to capture the expected level of pollution at both sites in the absence of a lockdown, taking the existing trend into account.
This is where Meteomatics data came in. Because every year, including 2020, has different weather conditions, an accurate “business as usual” case could only be constructed if the effect of the weather on pollutant concentrations could be taken into account. To do this, Lucille used a machine learning model called “random forest” and a selection of relevant weather variables. She trained the model using historical weather conditions and the corresponding observations, and then used the model to create her “business as usual” case. I asked Lucille about her experience of using Meteomatics data:
“I was in the middle of my analysis and I realized that I would greatly improve the model if I had meteorological data, but acquiring met data is not very easy in academia, there are so many steps to go through. I found Meteomatics, I reached out, the response was very quick, the time resolution of the met data is really good and the location of the weather [data] was exactly where I needed it to be”

Aerosol Scientist
The State University of New York
I found Meteomatics, I reached out, the response was very quick, the time resolution of the met data is really good and the location of the weather [data] was exactly where I needed it to be.
Results
As expected, in the urban background site, the changes in particulate matter concentrations during 2020 were modest, particularly when compared with the “business as usual” case, suggesting that most of the observed differences could be attributed to the existing trend. In the traffic-sensitive site, however, differences were more pronounced. Statistically significant differences between both the observational and the “business as usual” datasets were found for particulate matter concentrations.
The difference in OP was more challenging to interpret. One of the challenges here is that OP has to be measured by observing the reaction of assays to the matter to which it is exposed, and that different assays react differently with the various chemical species within the particulate matter, meaning that results can vary depending on the source of the matter. Of the assays used in this study, one was more sensitive to the organics which would be produced by wood burning, whilst the other was more sensitive to the emissions from fossil fuel burning engines. Hence, a key finding of Lucille’s study was that, although traffic reduction has a significant effect on the presence of some kinds of particulate matter in the atmosphere, other kinds of pollution, particularly that from domestic wood burning, still contributed significantly to health risks.
Since completing this study, Lucille has relocated to New York, where she is researching volatile organic compounds at State University of New York. Her current research doesn’t involve work on OP, however she’s very interested in incorporating it into her work in the future. She hopes that, within three to five years, it will be a commonly used metric when considering the impacts of pollution, and expressed a particular interest in using the metric to study highly-resolved time-series of pollution data, so that the precise causes of harmful pollution can be traced more directly.
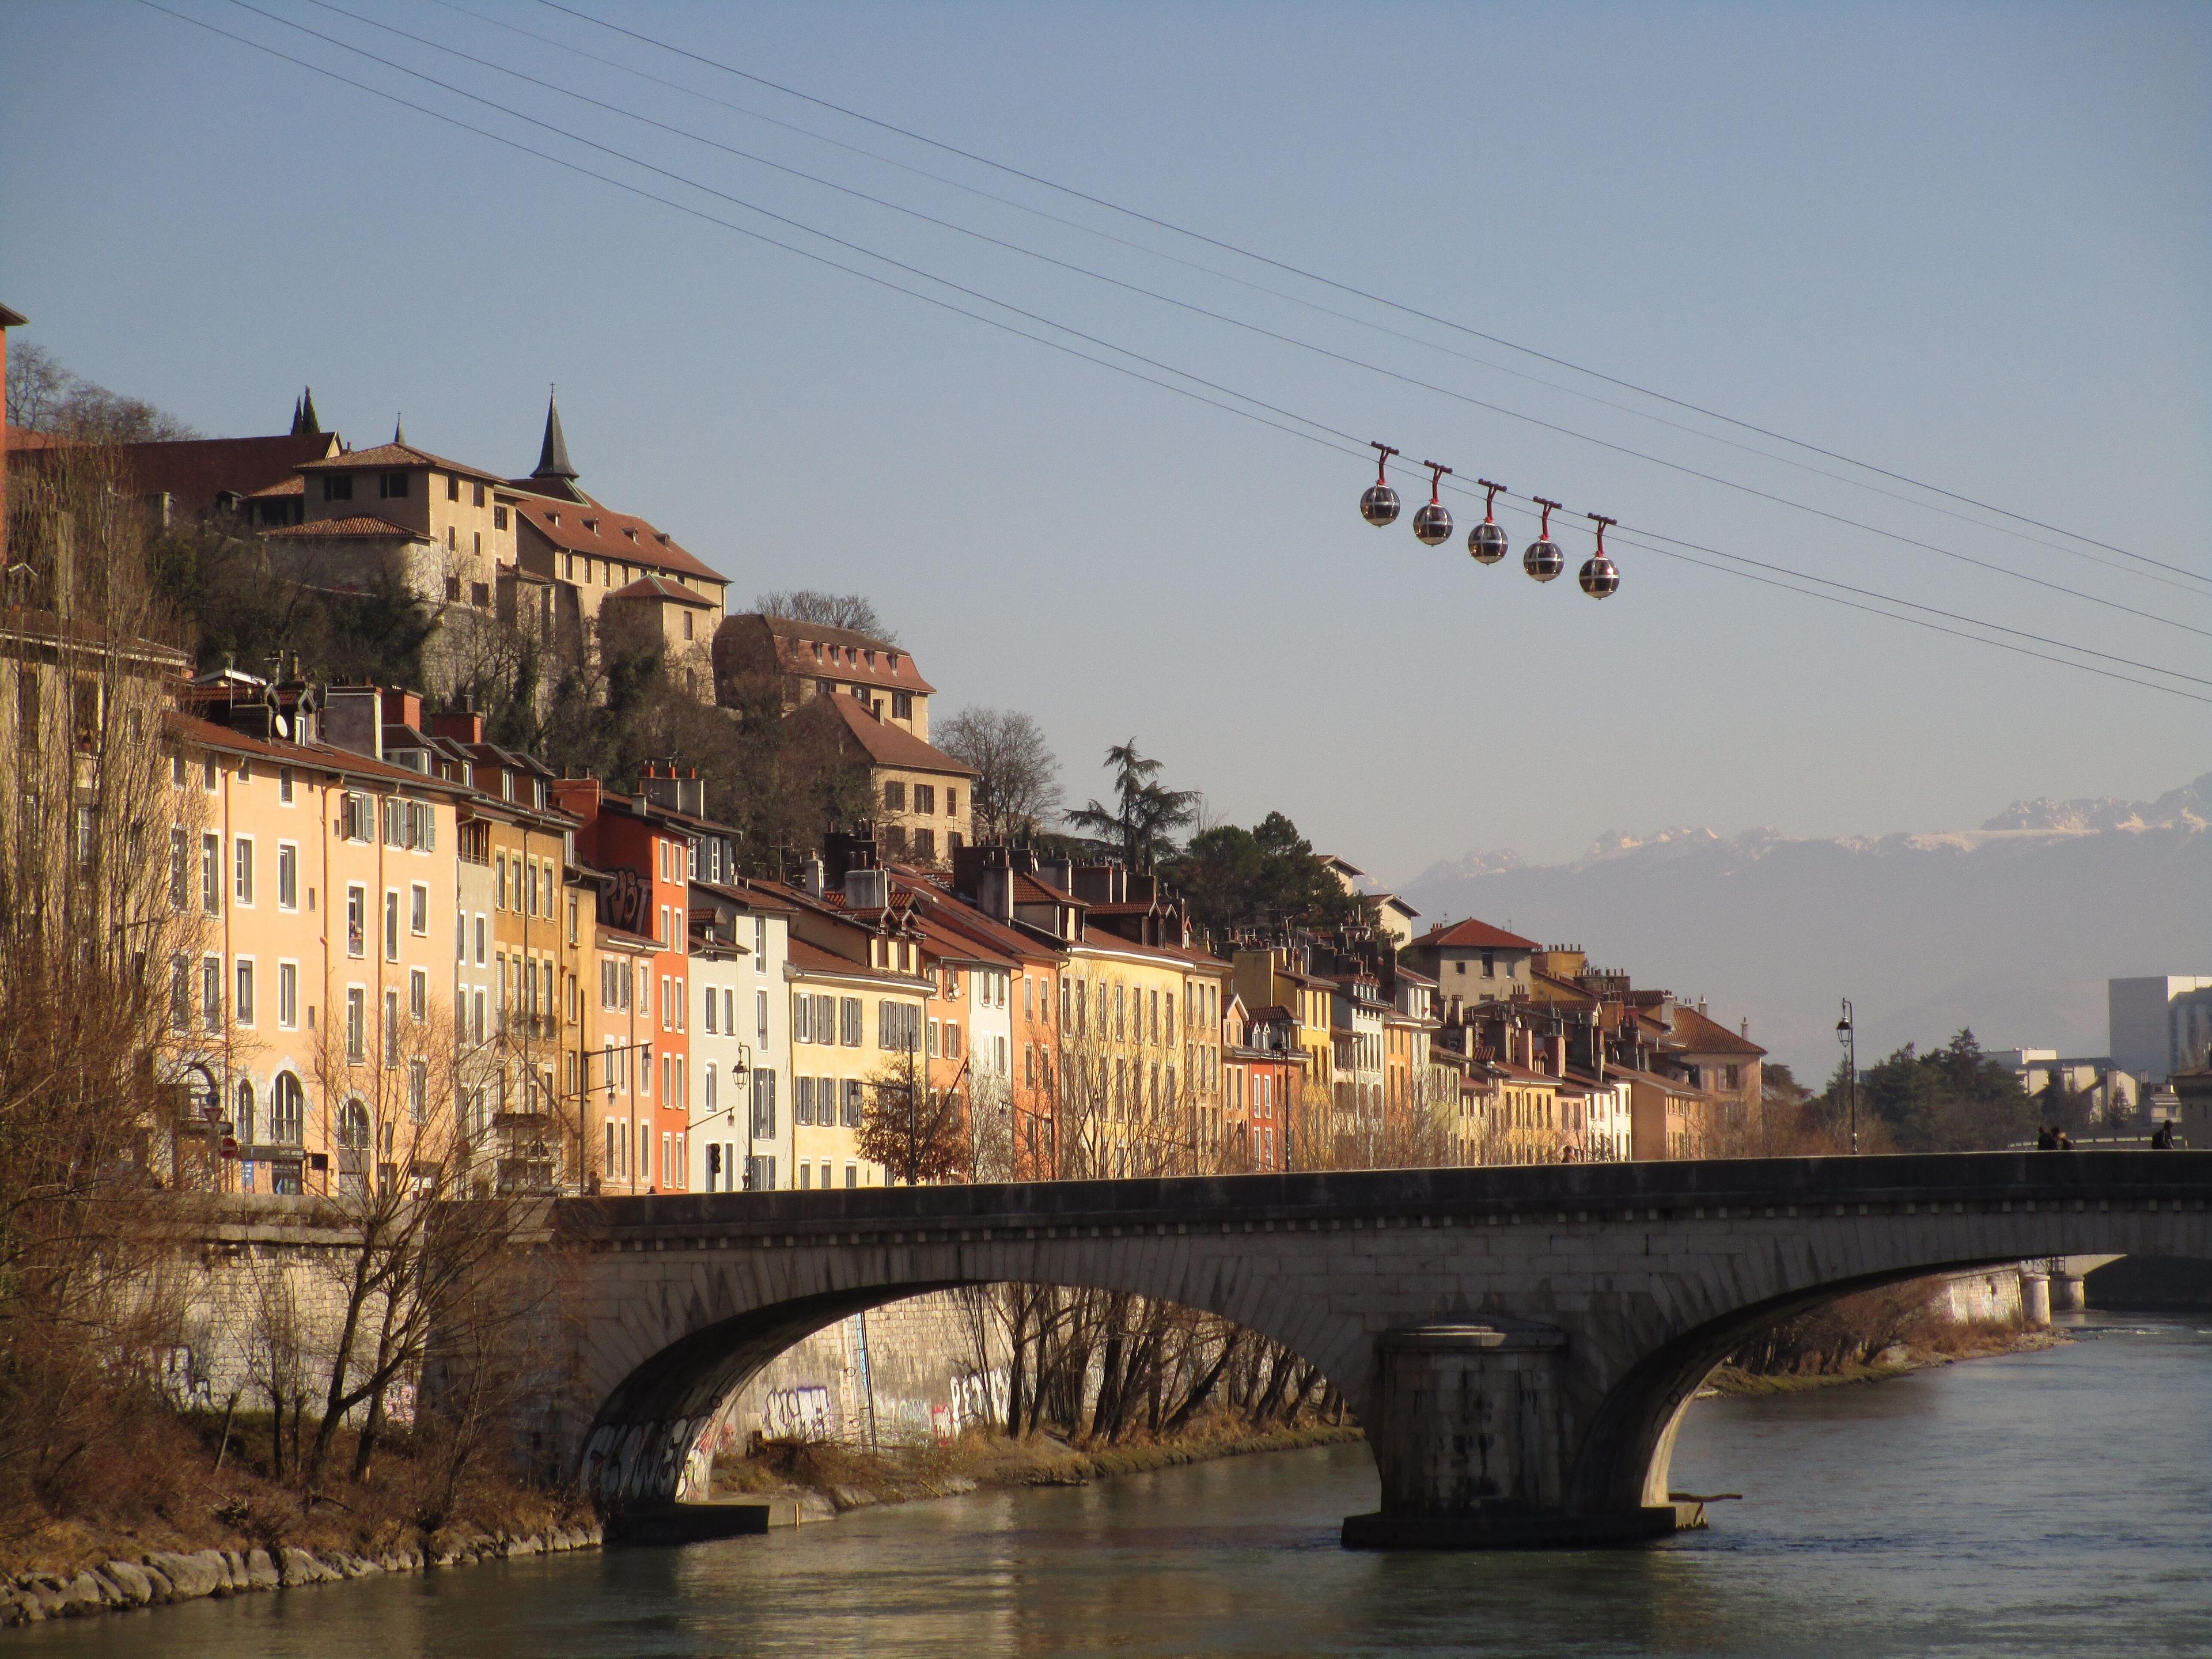
About the University of Grenoble Alpes
The University Grenoble Alpes is a public research university located in Grenoble, France. Established in 1339, it is the third largest university in France, hosting approximately 60,000 students and over 3,000 researchers.

Expert Call
Let’s Find the Perfect Solution to Your Problem. Talk to an Expert.
Related Articles


We provide the most accurate weather data for any location, at any time, to improve your business.