04/13/2023
Historical Weather Data API
Meteomatics offers access to a range of station data, radar and satellite imagery, historical forecasts and reanalyses.

When it comes to historical weather data, there are various sources available to help you solve your specific problems. Meteomatics offers access to a range of station data, radar and satellite imagery, historical forecasts and reanalyses. What are these? And what subscriptions do we offer? Find out below.
Types of Historical Weather Data You Can Get Through Our Weather API
Broadly speaking, historical weather data can be separated into two categories: observational and modeled.
Observational Data
Observational data is generally considered to be the most trustworthy, as it contains a record of what actually happened in the past. However, there are two kinds of observational data:
- in-situ data which is measured at the location of the event, such as that from a ground-based station, a radiosonde or a weather drone; and
- remotely sensed data, such as that which is derived from satellites or radar.
Although remotely sensed data does involve the direct measurement of a physical event, that event is not the meteorological phenomenon itself, but instead some consequence of it (usually energy in the form of electromagnetic radiation which has interacted with the phenomenon and hence has been affected in some way).
To infer the state of the quantity of interest — i.e. the amount of liquid water in a cloud (in the case of radar) — some mathematical modeling has to be applied to calculate the result. Hence remotely sensed data can provide us with quasi-observations which, whilst covering a larger spatial extent and potentially generating much more information, cannot be said to be as accurate as direct observations.
It should also be noted that, whilst in-situ measurements such as those from thermometers and anemometers are the gold standard for accuracy in meteorology, there remains an associated uncertainty. By way of an analogy: when you measure the length of a table, you can only be as precise as the ruler you use to measure it — most rules will not give you the ability to measure to the nearest micrometer.
Model Data
Although a small amount of modeling is involved in retrieving remotely sensed variables, we generally reserve the term "model" to denote that data has been produced either in a forecast or a reanalysis.
Forecast
A forecast is a prediction of future weather conditions produced by a weather model, with the goal of providing useful information for decision-making. It must be produced quickly and with a limited amount of data, as it is meant to predict weather that has not yet happened.
A weather forecast essentially works by taking a large network of observations from a point in the past, then using physical laws and mathematical equations to fill in the gaps in space and time. If the temperature where you are sat is 21.1 ºC, and the temperature 10 m away is 21.3 ºC, then it’s reasonable to assume that the temperature halfway between is 21.2 ºC. If it was 20.7 ºC where you were sitting 10 minutes ago, you could also guess that the temperature 5 minutes ago was 20.9 ºC, and you might also guess that the temperature 5 minutes from now would be 21.3 ºC.
This is a very simple example of how a model works — it uses a mathematical rule to make predictions about things you do not know based on the things you do. The model that we just described is a bad one — it assumes a linear relationship between temperature and time which, if extrapolated to its logical conclusion, would suggest that in 33 hours the air around you would boil, and that right now some point about half a kilometer away from you is freezing.

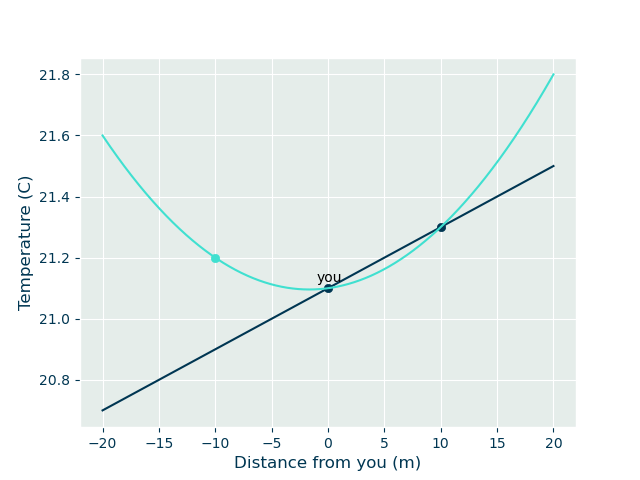
Obviously we need to add some more complexity to our model. If we add another data point, instead of simply fitting a straight line we can add a curved line to the model — however this is clearly still not realistic.
Fortunately, generations of scientists and mathematicians have painstakingly described how the world around us behaves using mathematical formulae, and, thanks to the power of the modern supercomputer, we can solve huge numbers of these equations in the blink of an eye.
However, as you doubtless will have experienced at some point in your life, a weather forecast is not a perfect prediction of what will happen. Why is this? Well, there are two main reasons: the inadequacy of the model equations, and the propagation of errors.
The equations we use to describe how atmospheric variables unfold are undergoing constant revision as we understand the universe better. Furthermore, because of the huge number of calculations a weather forecast needs to make per second, we have to intentionally simplify some equations.
But perhaps the bigger problem is that chaos. The observations we use to constrain the model before we run it can only practically be known to a finite precision — just like how it requires extra effort to measure the length of our table to micrometers. When we extrapolate these numbers in space and time, the uncertainty grows rapidly, because the atmosphere is a "chaotic system" where uncertainty grows exponentially.
Weather forecasts are, of course, produced primarily so that we can make predictions about the future. Using them as historical data may seem nonsensical, but it’s important to remember that they provide much more uniform spatial coverage than a scattering of ground-based observatories, and that this is a desirable property. Since they’re being produced anyway, we might as well save the data and use it to fill in the gaps if we have questions about the weather on a certain date.
Meteomatics purchases and saves historical weather forecasts on our servers, where they can be provided to you stress free at our patented 90m resolution. TerraBytes of data lie at your fingertips with the Meteomatics Weather API.
Reanalysis
A reanalysis is a weather model that uses the same principles as a forecast but is not constrained by the need to produce predictions before the weather occurs. This allows for more calculations and data to be included, resulting in a more comprehensive and up-to-date representation of historical weather conditions. Reanalyses are not used for forecasting future weather but instead provide a retrospective view of historical weather patterns, making them useful for climate research, understanding extreme weather events, and other applications.
Whilst a reanalysis is still a model, rather than a direct observation, in most locations, it will also contain a much larger number of observations and up-to-date model physics (i.e. we can use the equations we developed in the 2010s to model the weather in the 1990s). A subtle point is that, since we are now modeling a longer period of time, we can provide observations from multiple different time steps. This means that, if a reanalysis of the last week is produced, and it is making incorrect predictions about day three, we can nudge it in the right direction by providing the correct answer. This process, called "data assimilation", is also used in modern forecasts, but has enormous benefits for the reliability of reanalyses because of the number of historical observations which can be assimilated.
Historical Weather Data from Meteomatics

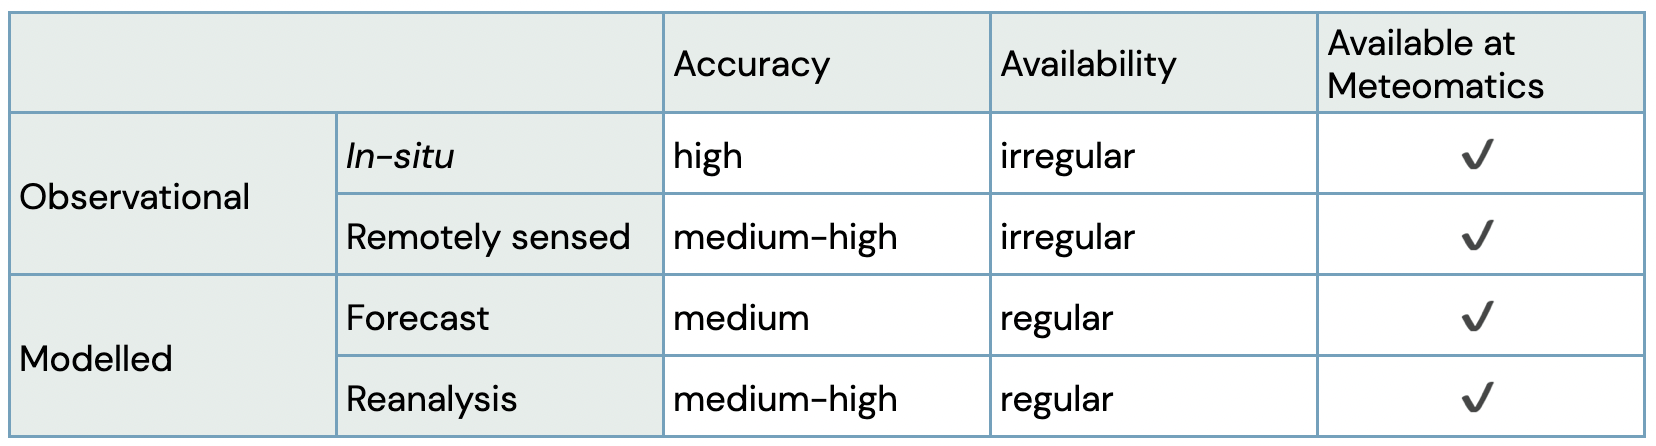
The table above summarises the key points of the previous section. But what can you expect from Meteomatics?
The precise answer to that question depends on the configuration of your package. But Meteomatics has data available from a global network of ground-based stations — starting from 1980 depending on the station — as well as, for selected regions, radar observations from 2004.
In addition, we provide historical forecasts from 2017, as well as the widely acclaimed ERA5 reanalysis — the most trustworthy single model of the whole globe — from 1940, all downscaled to our trademark 90m resolution, of course.
In summary, Meteomatics provides all kinds of historic weather data outlined in this article. Check below how to get access to the kinds of data you need.
You can get all of this data through our Weather API. Our Documentation describes how you can create a query in your web browser by writing a special URL. In general, querying historical data is as simple as changing the date in your URL to some time in the past.
Unsure what to query? Our step-by-step URL Creator provides a graphic interface to help you create your first queries, like this simple query for the air temperature in London during February 2023:
Of course, we understand the needs of our customers, many of whom will be integrating weather data into their software applications. That is why we also provide support for a huge range of programs and programming languages through our API connectors, so you do not need to code up an HTML parser from scratch — all you need to do is download the connector for your chosen software, and we will have already handled the backend business, getting you data in whatever format you need!
Historical Weather Data: Some Use Cases
While the term "weather data" may instantly evoke thoughts of forecasts, historical weather data has numerous practical applications. In fact, there are many compelling reasons to use this type of data. To give you an idea of just how potent this information can be, here are some examples of the various use cases for historical weather data that Meteomatics provides:
Machine Learning
Machine learning and artificial intelligence are increasingly popular across all business domains today. Because of the ubiquity of data science skills and easy to use packages like Python’s SciKit Learn, almost everyone can now implement simple machine learning use cases.
Imagine, for example, you own a consumer business like an ice cream shop. It is pretty clear that your business is going to make more money during hot spells. This is a simple example of correlation. You can use a technique called "regression" to derive an equation for ice cream sales which depends on the temperature, and use it to predict your sales in the future.
Regression is a type of statistical learning algorithm. It learns, because the result of the algorithm (the equation for predicting future sales) changes as you add more information. An only slightly more complicated problem can be solved by a "multivariate regressor".
Let’s now say the relationship between your business and the weather is more complicated. Perhaps you own a restaurant with an outdoor area, and want to know if you should open it on a given day. In this case, cold temperatures will probably make your customers think twice, but rain could be even more catastrophic. Strong winds will probably also play a role.
Whilst the simple, linear regression above is easy enough to do with a pen and paper, a multivariate regression is not. However, by leveraging the abilities of a computer, finding the solution to just such a problem is easy!
A huge number of different machine learning algorithms exist, each of which is designed for a specific type of problem, but with Meteomatics our historical API data can be easily incorporated into your solution.

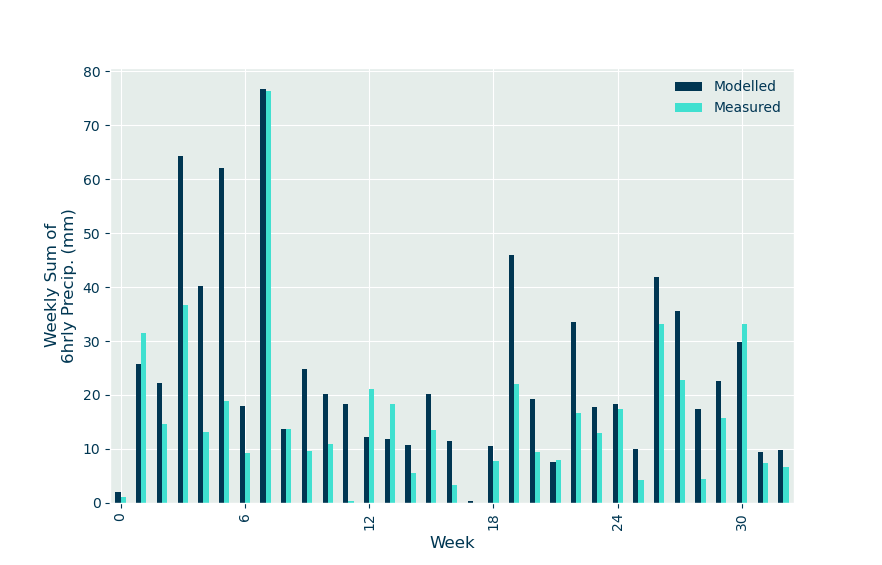
In the picture here we see the difference between the total precipitation that occurred per week for 32 weeks at an observatory in Konstanz, Germany, and the amount predicted by a weather model (ERA5). Differences like this present an opportunity to implement regression models to enhance the correspondence model data and reality in hyper-localised situations.
Site Assessments
Another use case in which Meteomatics historical weather API data sees a lot of application is in the choice of locations for renewable energy plants. Wind, solar, hydrological and tidal power stations all need a reliable source of energy. By using the historical weather data from Meteomatics, our customers can plan their outlay of hardware.
For wind and solar farms, the technique is relatively straightforward: simply look at a long time series of historical data and apply power curves based on your hardware to estimate the power yield from different sites. Make sure you check at sub-annual timescales to confirm networks can dispatch the right amount of electricity during particularly dark or windless months!
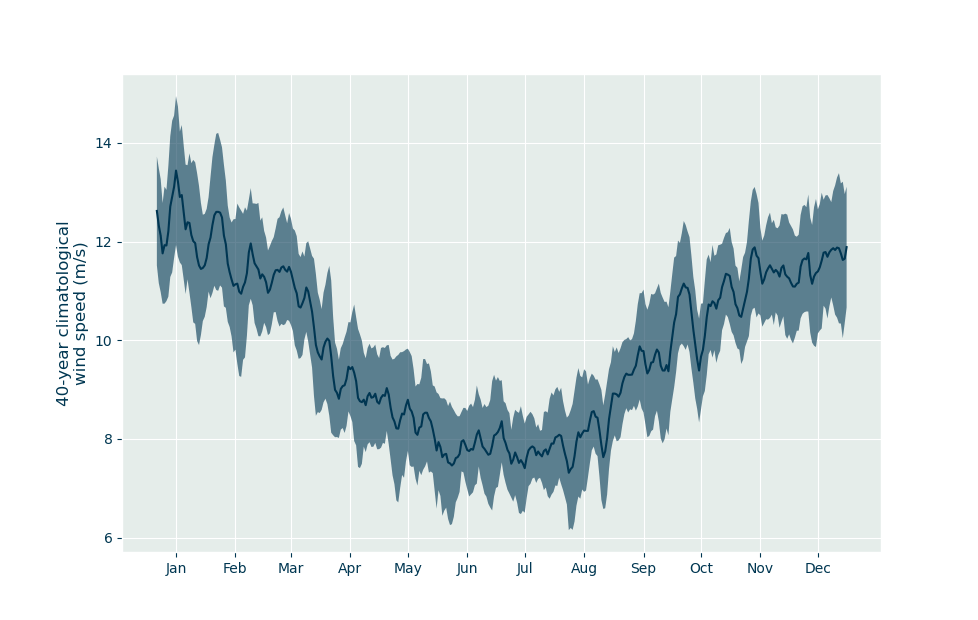
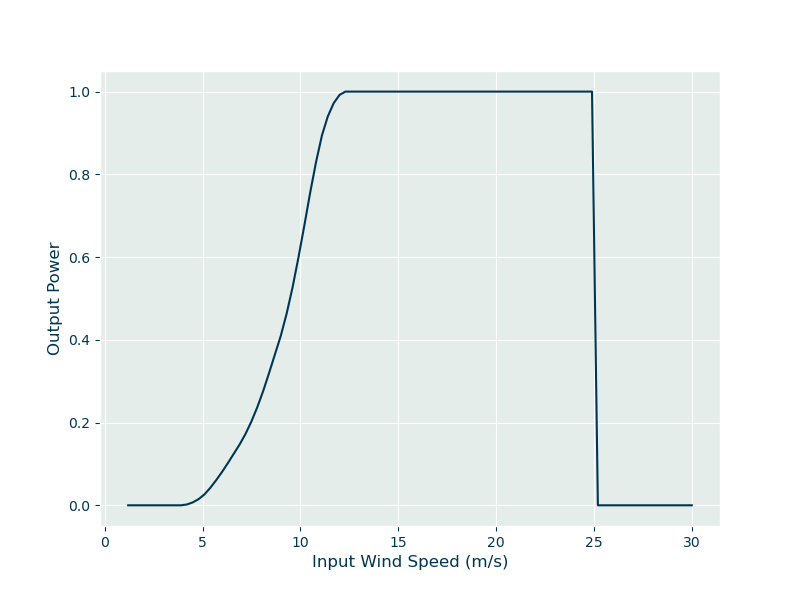
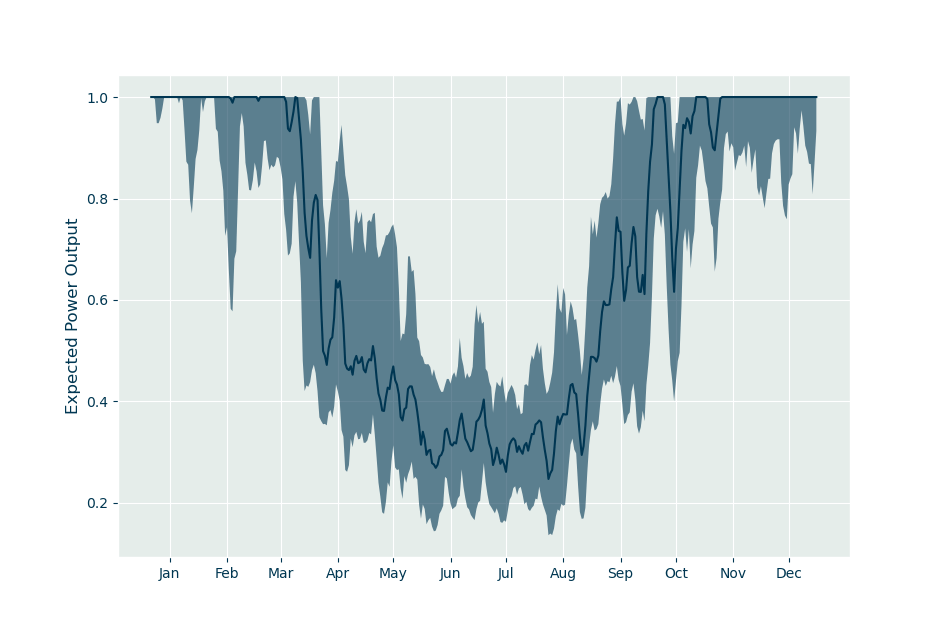
The following figures illustrate the process for data driven wind-farm site assessments. We choose the location where we’d like to investigate the conditions. In this case, I’ve chosen coordinates near the Isle of Colonsay (Scotland) — an existing wind farm. I first use historical data from ERA5 to derive a 40-year climatology of wind speed at 100m above sea level, then use a "power curve" for a hypothetical turbine to convert this into a relative power output.
My power curve has the typical properties of a power curve — a cut-in speed at about 5m/s, below which the turbine does not rotate efficiently; a ramping up to a maximum efficiency at about 11m/s; and a cut-out wind speed of approximately 25m/s, above which turbines are typically locked to prevent damage. The scale of the output is between 0 and 1, i.e. can be multiplied by installed capacity to estimate actual production. The choice of a 100m hub height is arbitrary, as Meteomatics provides wind speed at any chosen height. Onshore turbines are typically a little smaller than this, and additional modeling should be done to capture the roughness of the surrounding area.


Access to historical data through our API can also facilitate much more complicated modeling! For instance, in the case of a hydroelectric dam, you might need to capture how rain falling in a large area flows through the watershed to the pour-point of your plant. With Meteomatics area requests and terrain models this is also achievable.
See our webpages for more examples of how we support customers in the energy industry, and get in touch to find out more about how we can help engineer a solution for you!
Climate Studies
Climate is simply the long term average of the weather, so historical weather data can be used to calculate the climate for any region of the world.
This is incredibly important these days, with the changing climate creating risks and opportunities in many industry sectors. Being able to map this information and respond to it is a huge challenge for businesses increasing their resilience.
For instance, recent data to emerge about the 2022 summer heatwave in the U.K. shows that a fifth of hospitals were forced to cancel elective surgeries, and a further third had planned to, should the heatwave have continued. This example shows that, when planning future hospitals, designers ought to consider the impact of the climate, and by understanding how that has changed historically and been dealt with, we can better plan the infrastructure of tomorrow.

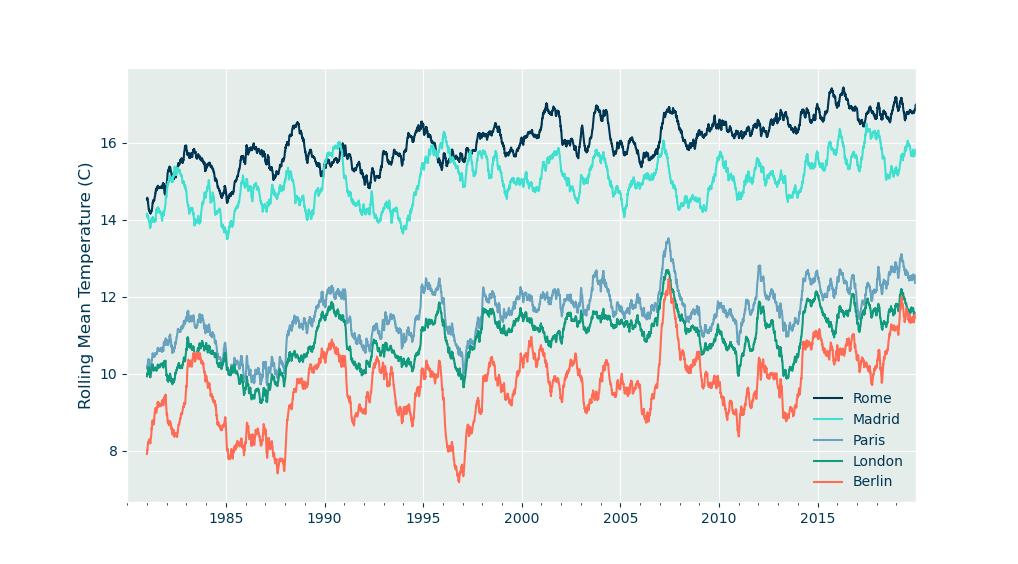
The plot above shows, for five capitals in Western Europe, the temperature trend as a rolling average for the last 40 years. Despite local and interannual variations, the warming trend is clear and shared amongst the locations. This kind of climatology can be easily derived from Meteomatics’ data.
During heatwaves, more people require healthcare, and buildings are also damaged by the stress, and there are also consequences of increased snowfall, flooding and windstorms which, depending on the region, may also present problems which, with the right historical data, can be seen coming.
In addition to the use cases above, you could use historical data to…
Calculate changes in flight times due to jet-stream locations
- Find optimal locations for agricultural facilities
Determine insurance premiums
…and much much more. Everything is possible with historical data from our API.

Talk to an Expert
Related Articles


We provide the most accurate weather data for any location, at any time, to improve your business.