08/12/2021
Climate Change May Double Area Annually Burned by Wildfires in California Within the Next 30 Years

Head of Marketing
Wildfires have become an increasing feature in the news across the world. Southern Europe experienced its worst-ever fire season this month. Smoke plumes from wildfires in permafrost areas of Siberia reached the North Pole for the first time ever recorded.
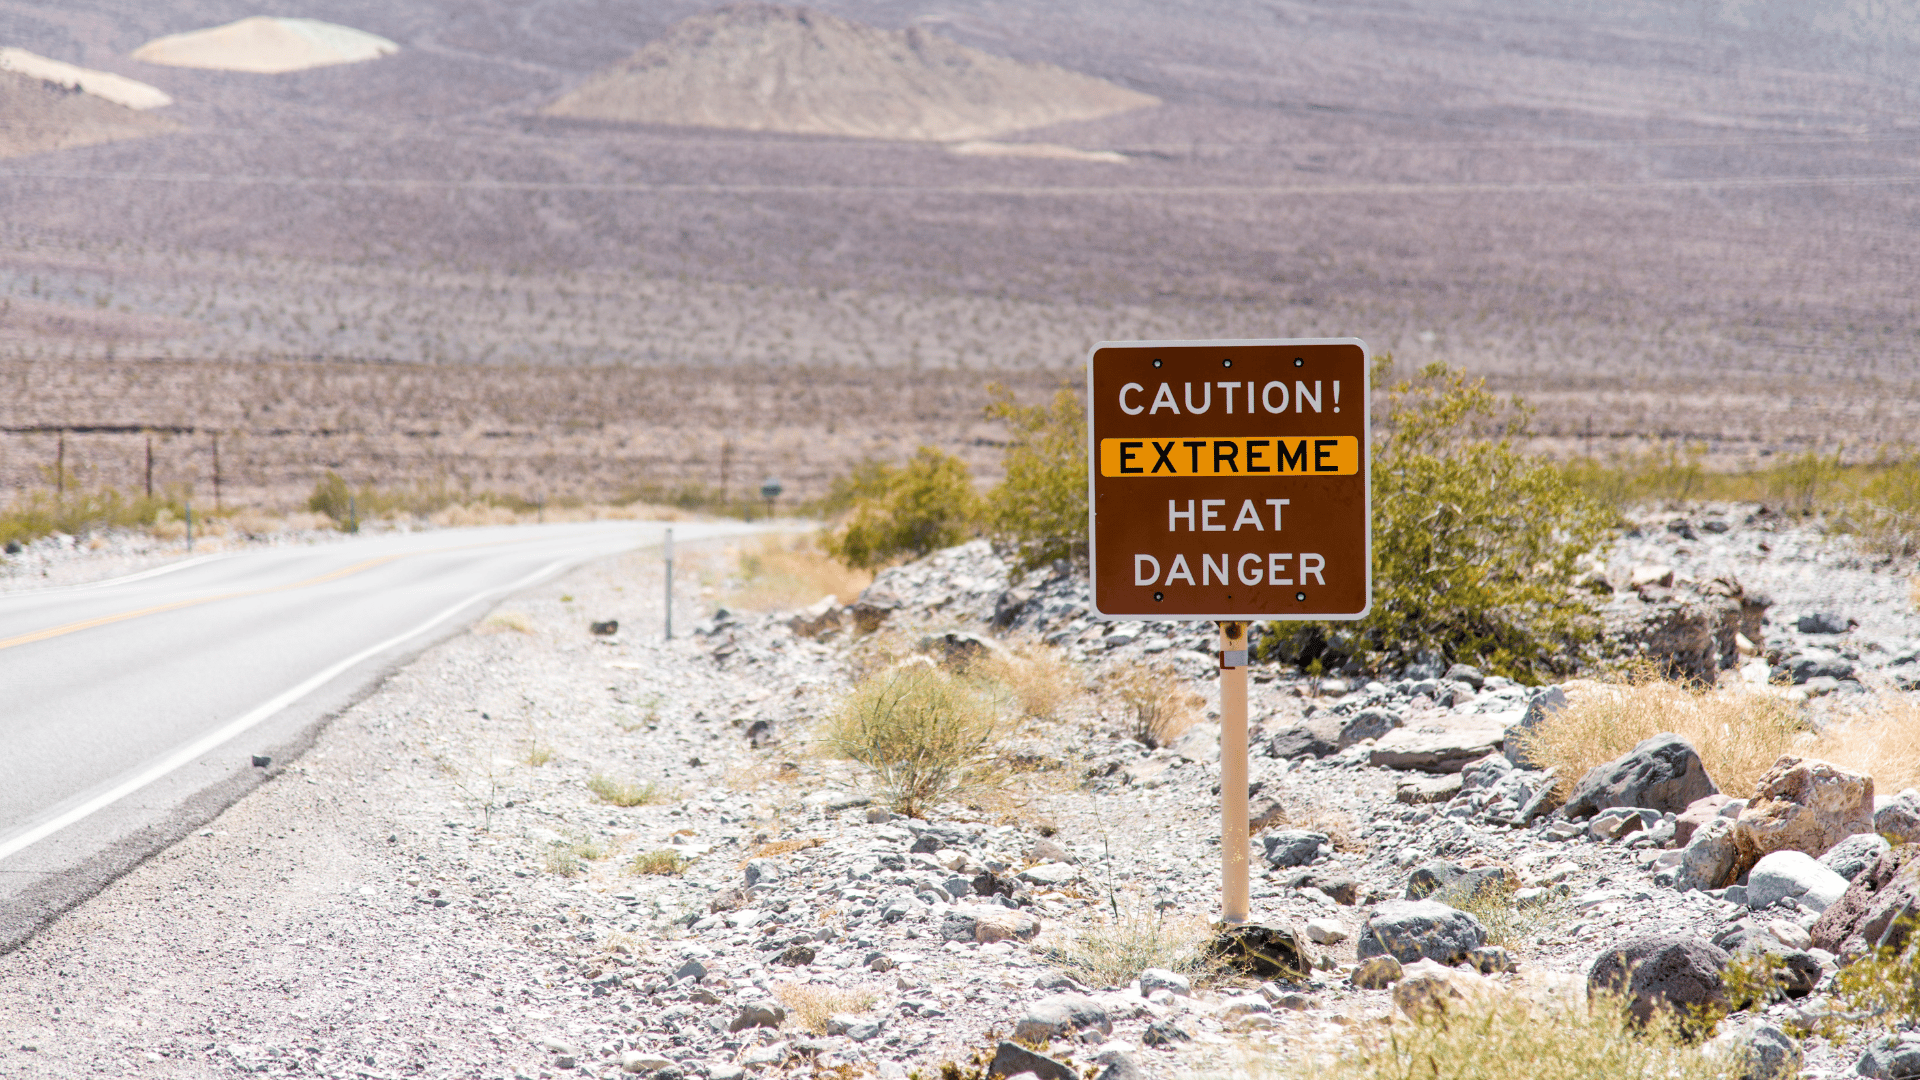
The heat dome in Canada led to record temperatures of 49.6°C in the town of Lytton, British Columbia, which was promptly destroyed the following day by a wildfire. Western states in the USA are predicted to have their worst fire season ever and smoke from the West coast was shifted across the continent creating hazardous air quality conditions for millions in New York City.
The climate crisis has been widely reported to be the driver for the increasing number of wildfires that the globe has experienced in recent years. This article will examine the role of the changing climate by focusing on California’s experience with wildfires to determine: How has wildfire damage increased over the last decade? How could Climate Change affect conditions which have high wildfire risk in California? What could this change mean for wildfire damage?
How does the last decade, and the 2020 wildfire season compare with previous years?
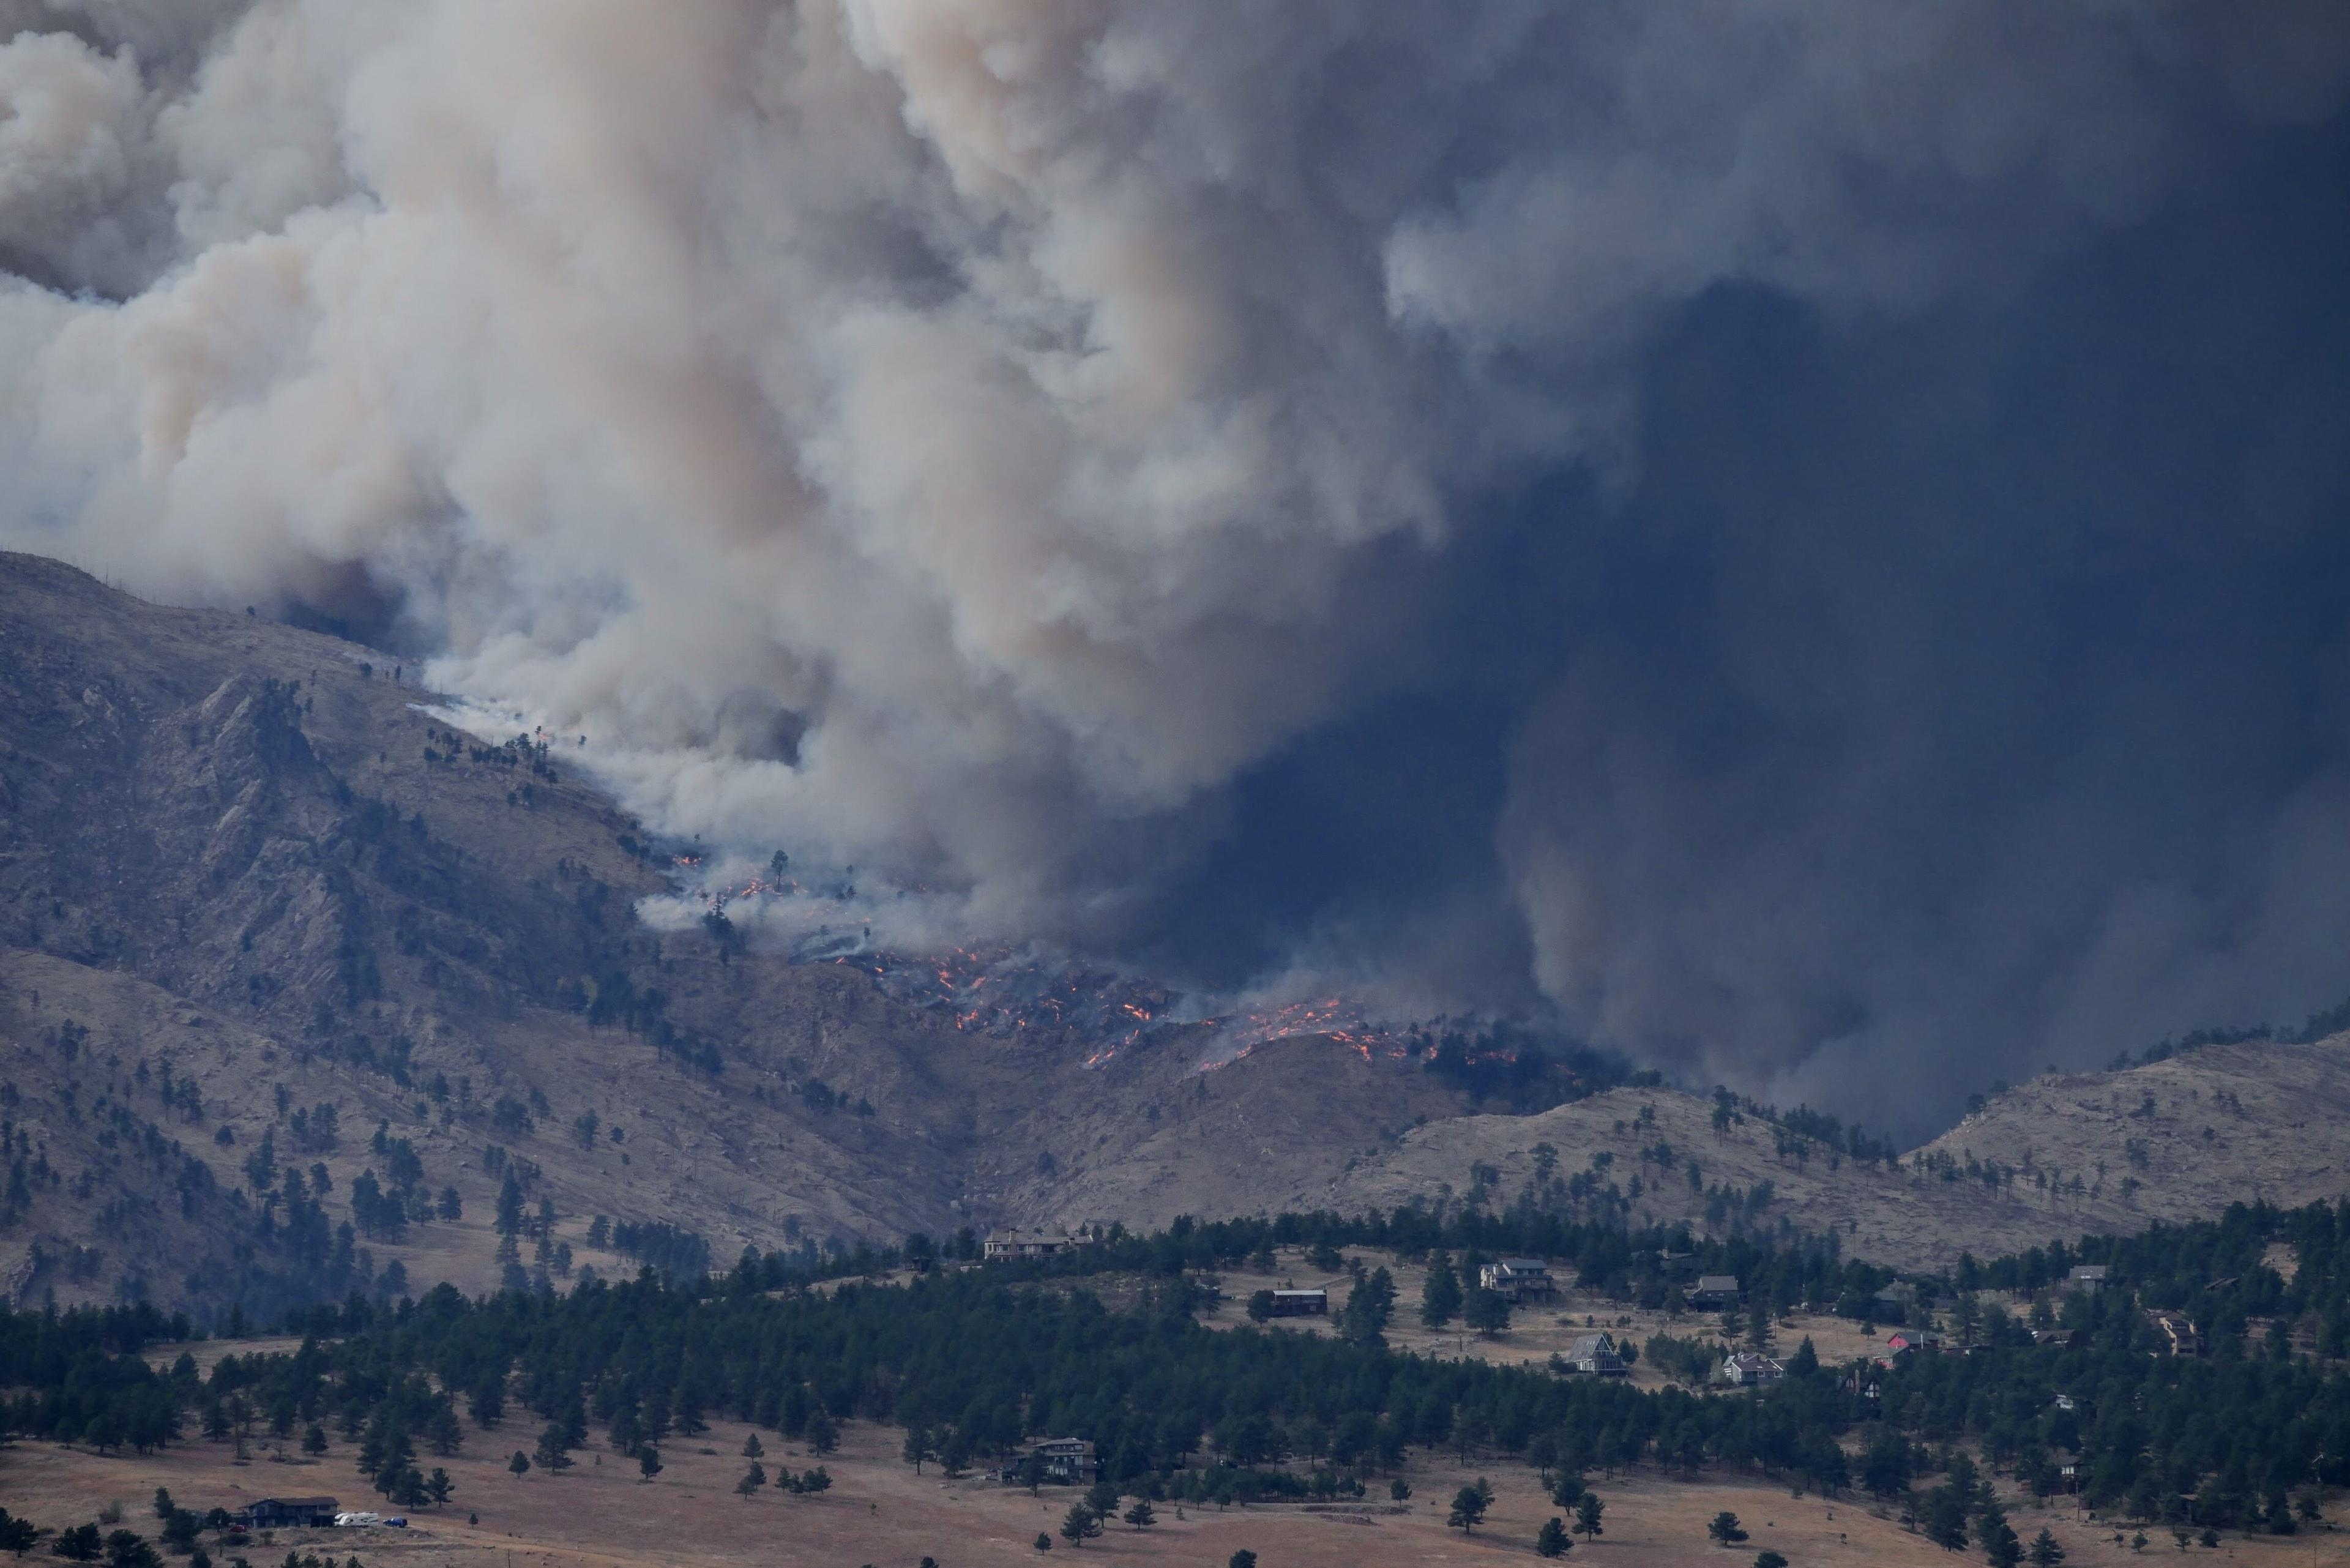
Wildfires are an annual, recurring phenomenon throughout large parts of California. Communities are experienced living with wildfires and recovering from the impact of even large fires. The increasing scale and frequency of wildfires since 2011 can be seen as an indicator of the seriousness of the climate crisis we all face.
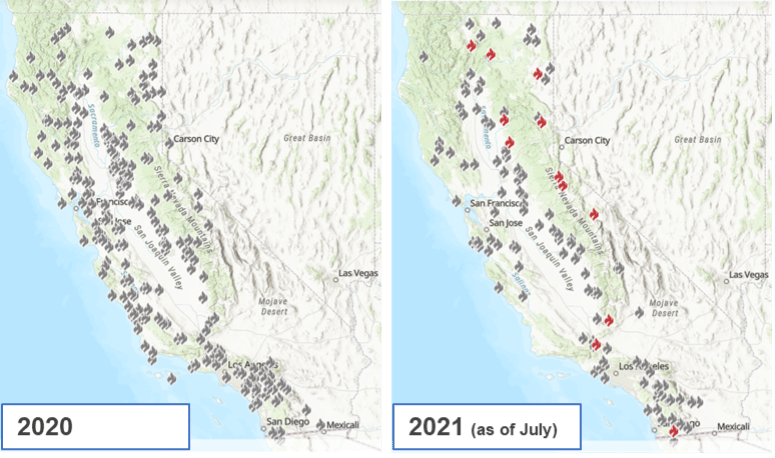
The 2020 wildfire season broke all records of the industrial age: both largest area burned and the largest single fire was recorded in 2020.

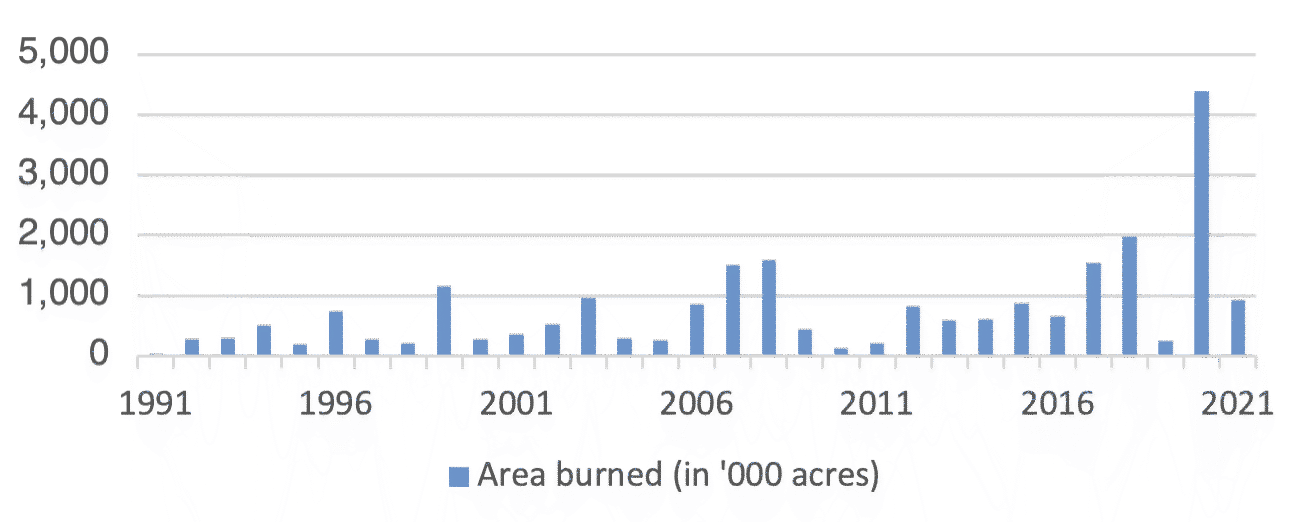
2021 looks set to become another major fire season, with wildfires burning almost a million acres by mid-August – more than twice the area compared to the five-year average at that time. Continued drought and high temperatures fuel more fires.

Dr Susan Prichard, from the School of Environmental and Forest Sciences at the University of Washington, says: "We now have the conflagrations in California that we feared, following the record-setting heatwaves.”
What changes in weather patterns increase the risk of wildfires?

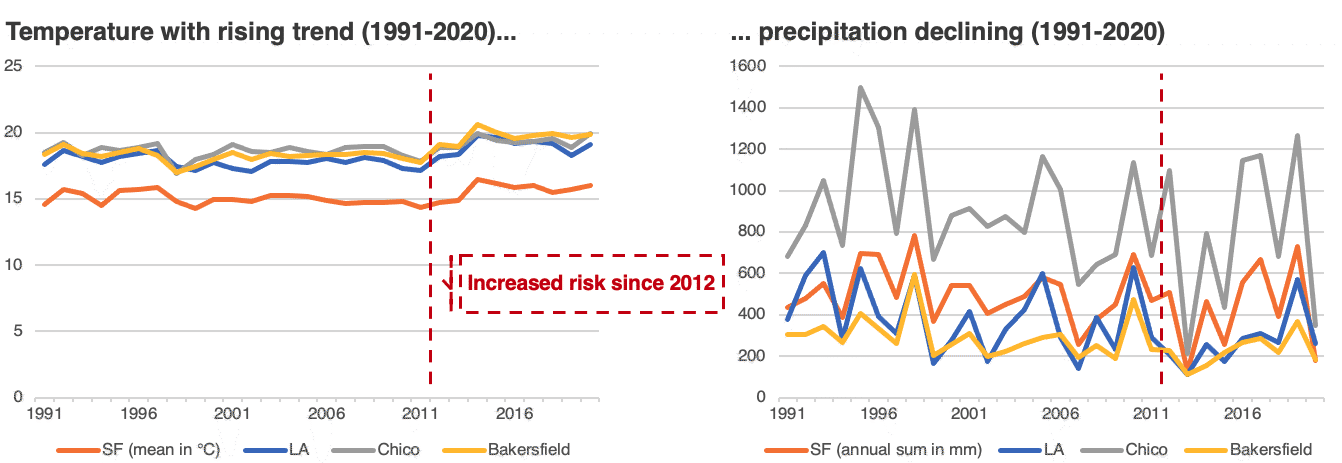
Meteomatics temperature records for key locations across California (SF-San Francisco, LA-Los Angeles, Chico & Bakersfield) all show a small rising trend in annual mean temperatures between 1991-2020, with a notable rise since 2012.
There has also been a declining trend in annual precipitation, observed across all four locations, with annual levels since 2012 in line with the long-term trend.
What risk of wildfires is expected in the future?
The release of the 6th IPCC Climate Change report, published on 9th August 2021, anticipates that the changes in extreme weather patterns will very likely continue to persist and even worsen at least until the period 2040-60 under all SSP scenarios.
The changing climate increases the risk of hot and dry weather that is likely to fuel wildfires. Meteomatics climate change data thus shows a continuously rising fire risk brought by rising temperatures, declining precipitation, and soil moisture levels, as illustrated by the increasing number of Fire Risk days experienced and Fire Risk days forecasted in the future.

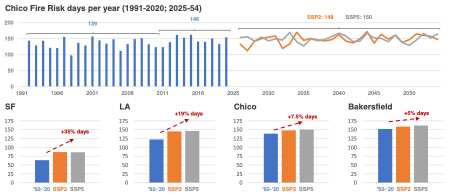
Note: Fire Risk defined as {cumulative hourly precipitation of last 21 days <50mm AND hourly temperature >20°C}
How could a higher fire risk affect the annual fire damage?
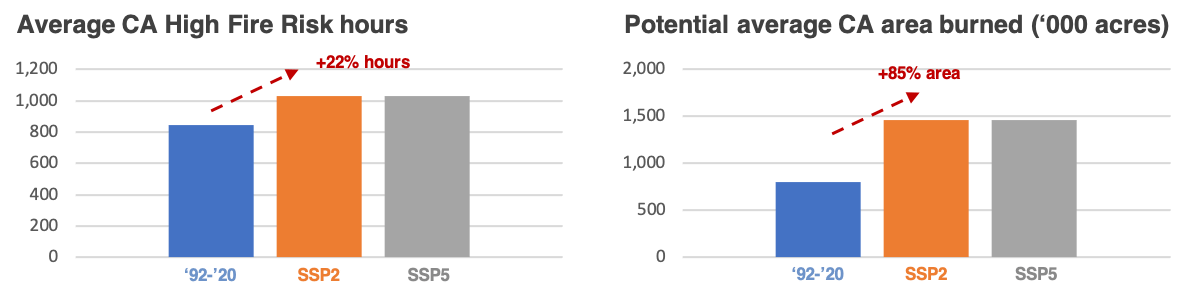
The area burned by wildfires is exponentially related to vapor pressure deficit (AP Williams, JT Abatzoglou et al. 2019). As illustrated in the chart below this relationship can be approximated using high temperatures (temperature > 28°C) and low precipitation (cum. 21-day precipitation <50mm).

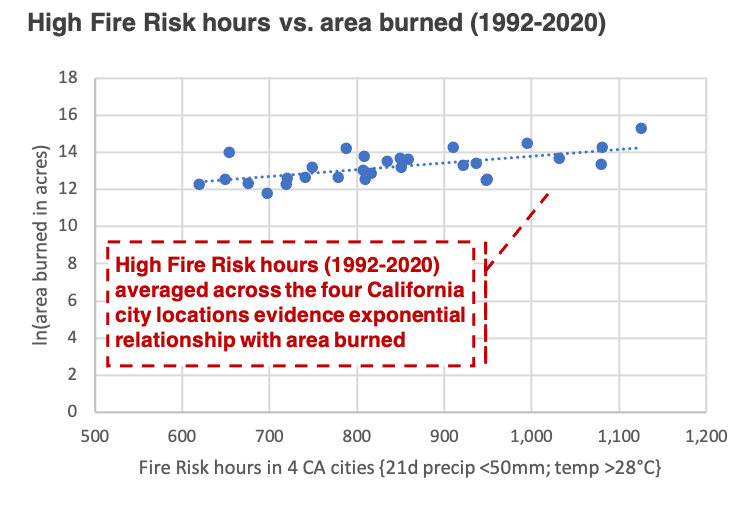
The development of High Fire Risk hours under SSP2 and SSP5 in the period 2025-54 indicates that the area burned annually in California could almost double by 2054 compared to the last 30 years.

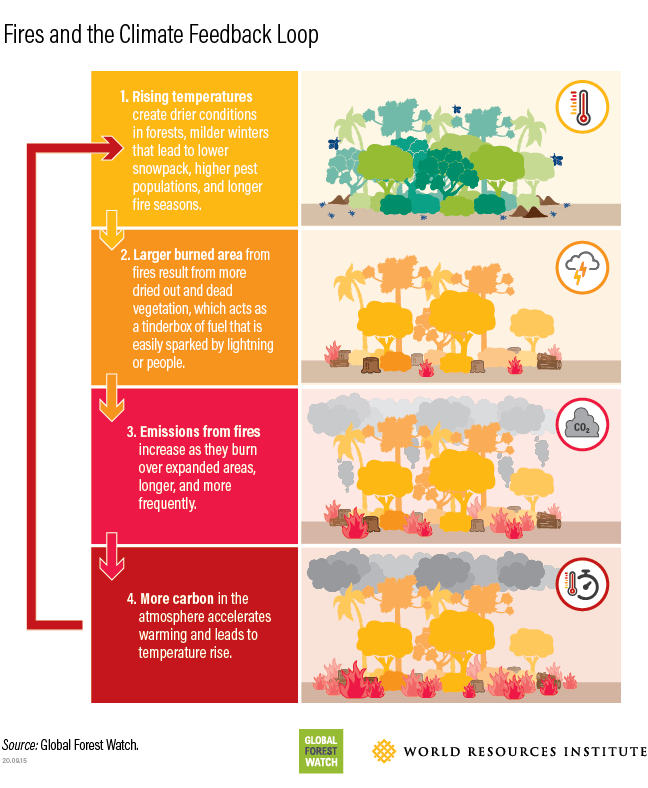
More wildfires and increasing emissions may exacerbate Climate Change
Wildfires are a natural part of the environment and an integral part of many ecosystems. Wildfires typically produce several greenhouse gases (GHG) and aerosols such as CO2 and methane. The plants that re-grow on burned areas remove CO2 from the atmosphere. If wildfires burn more frequently and across larger areas, the amount of released GHGs may not be completely removed from the atmosphere if plants cannot reach maturity. If “new” areas (i.e. so far not subject to massive wildfires) are burned the GHG emissions may be very material and take a long time to be removed. Wildfires thus carry the risk of speeding up global warming and exacerbating conditions that lead to more wildfires – a vicious circle.

Meteomatics' Climate Changes Services: helping clients understand and assess exposure to Climate Change
Meteomatics has designed a client-centric service to help communities and businesses identify, assess, and plan for the risks presented by climate change impacts, such as the risk of wildfires.
Meteomatics offers unique insight into the physical Climate Change Impacts:
- Quantification of hyperlocal physical Climate Change Impact
- Ability to convert commercial problems and questions into analytical frameworks
- Tailoring of analysis of specific meteorological and business parameters to client needs
- Initial, high-level assessments and asset or portfolio deep dives
- Addressing both the effects of New Normal and extreme events
- Scenario analysis with most recent CMIP6 scenarios
For more information please visit our climate services webpage. Alternatively, please contact [email protected]

Talk to an Expert
Related Articles


We provide the most accurate weather data for any location, at any time, to improve your business.