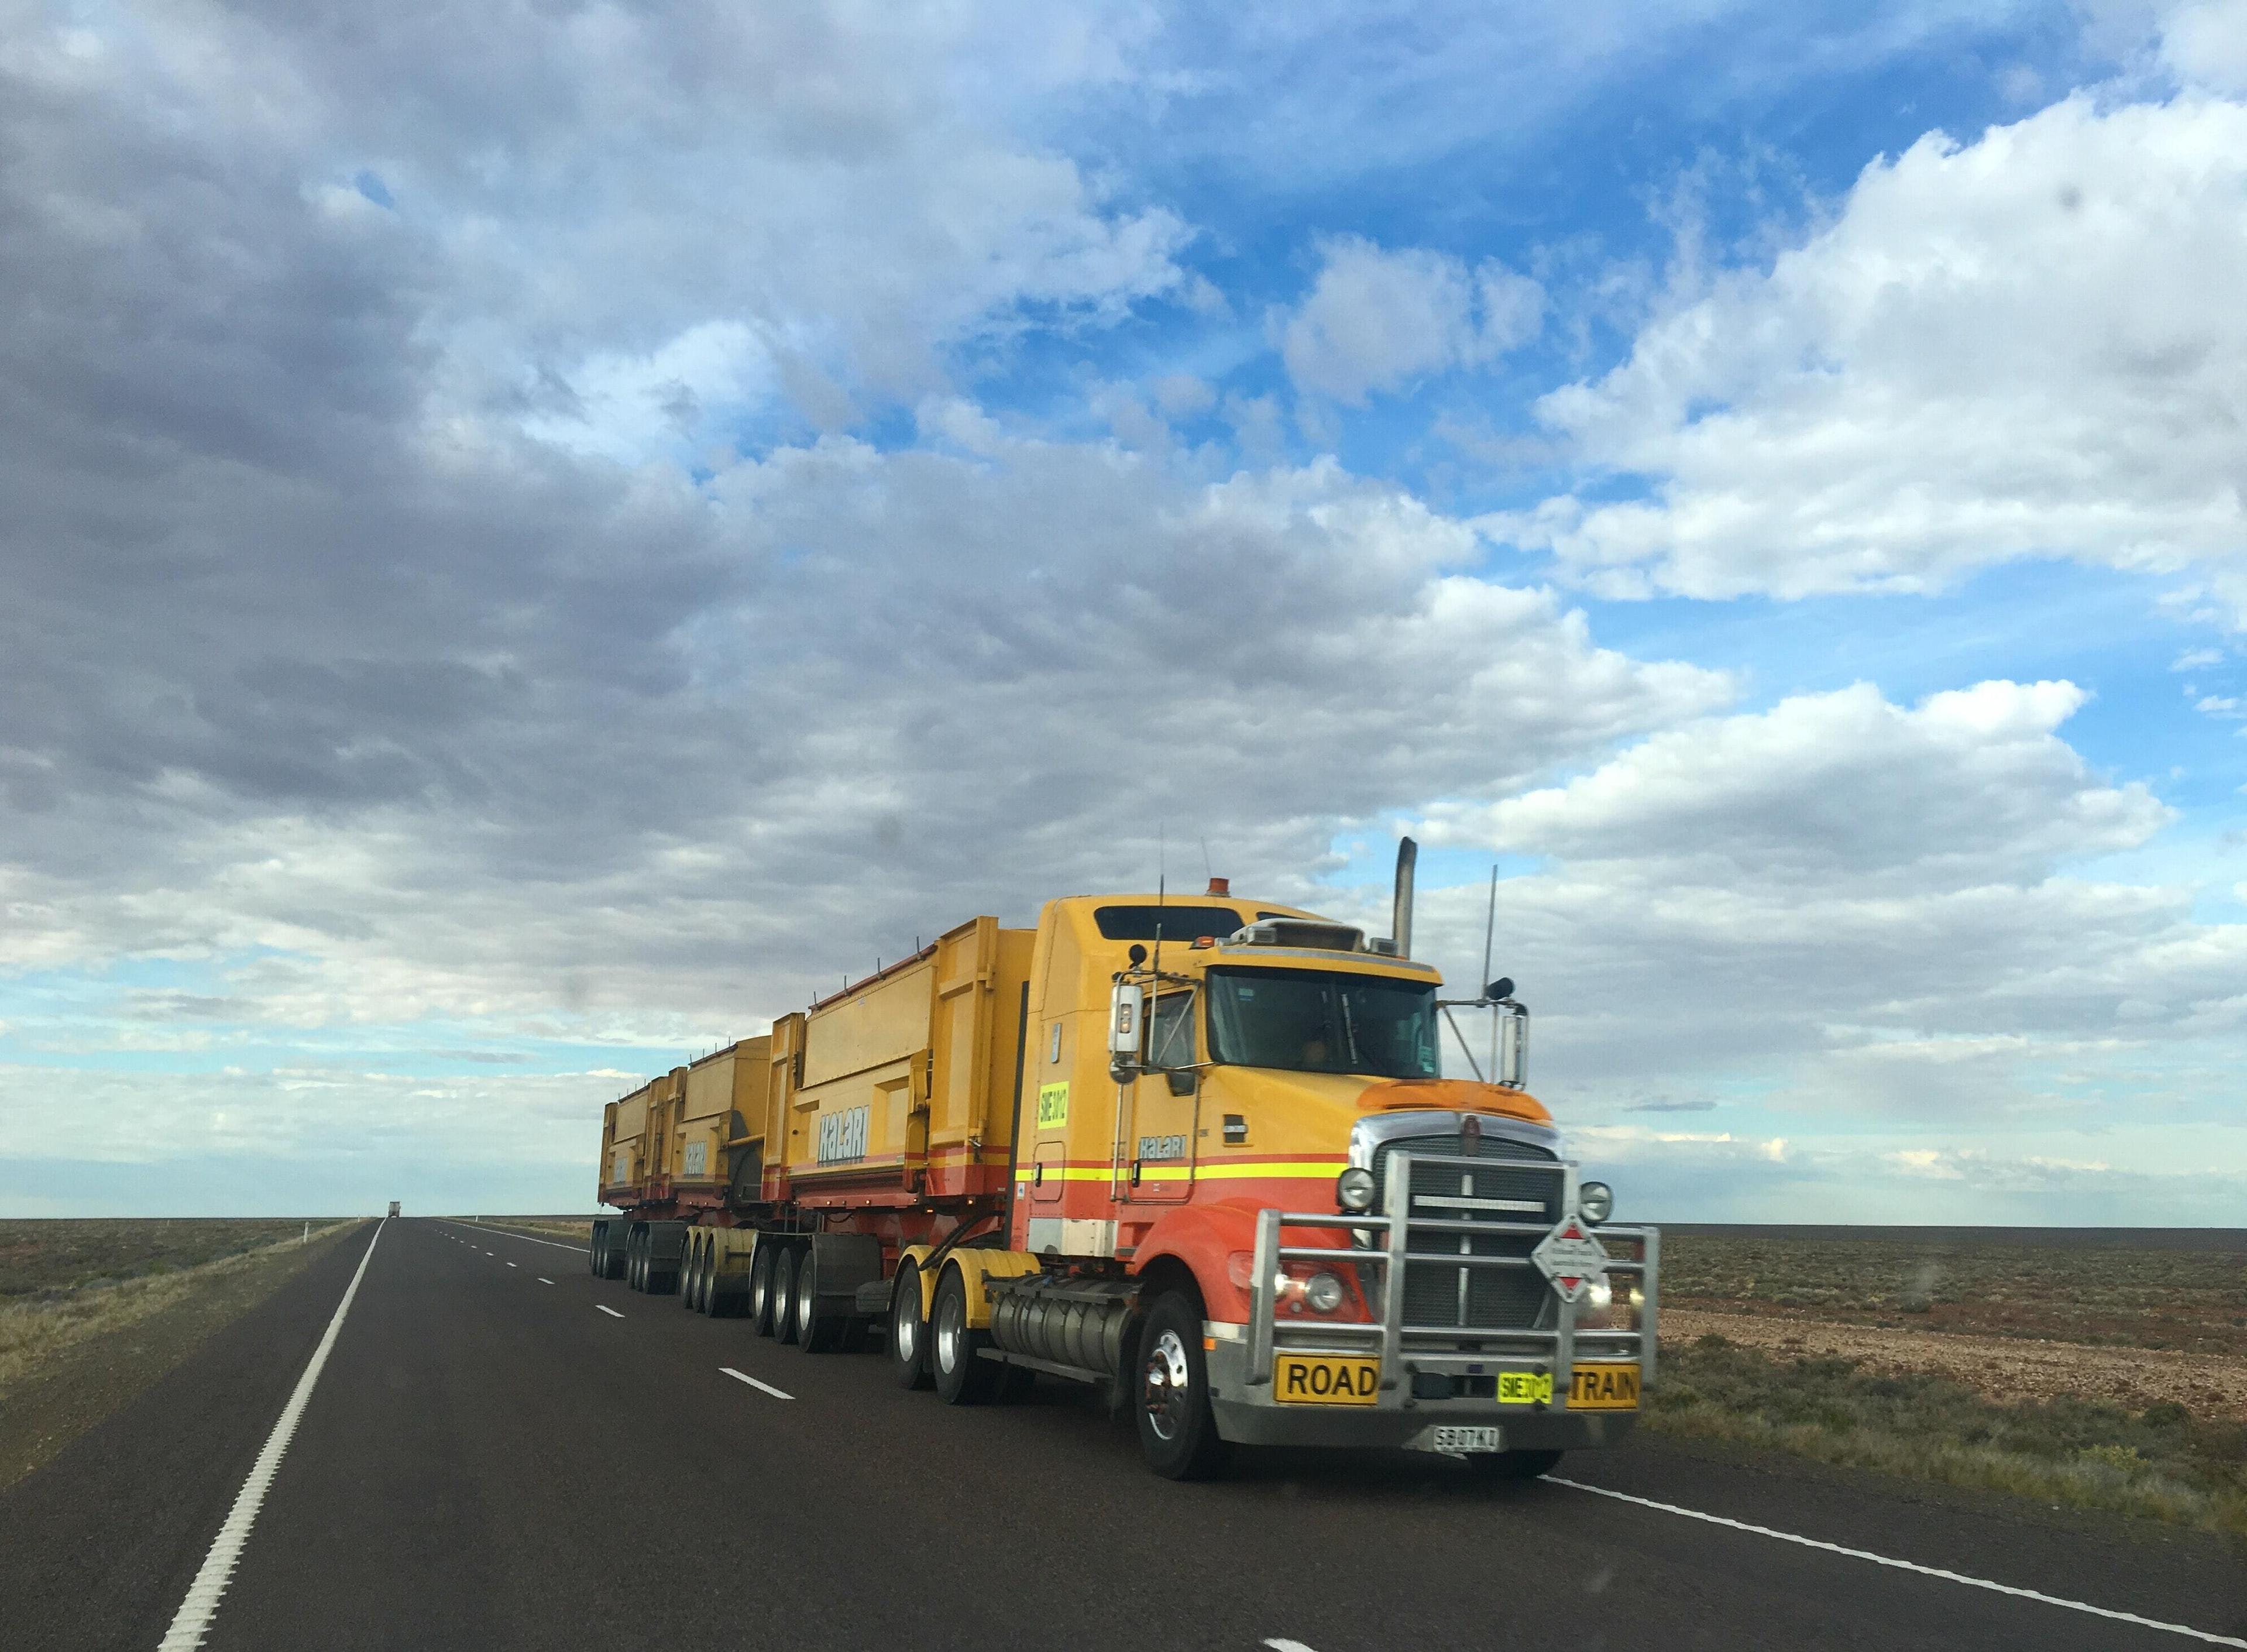
Solutions for Transport and Logistics
Explore Our Solutions
Weather API
Get fast and easy access to the entire universe of weather data with our Weather API.
MetX
Visualize every weather situation to stay ahead and to make better decisions with our Weather Visualization Map MetX.
EURO1k
European weather model at 1km resolution: get accurate weather forecasts across Europe and make better decisions.
Why Is Weather Important for the Transport & Logistics Industry?
Road and Rail Conditions
Moving around in bad weather conditions is frustrating and dangerous for people driving or taking public transportation.
Precipitation, fog, and snow can slow traffic and cause accidents due to impaired visibility and friction loss. Storms in areas with poor drainage systems lead to floods and landslides, putting people on the road at risk. Ice, snow, and extremely high or low temperatures often force trains to stall, disrupting timetables.
For the logistics sector, adverse weather can be devastating as delivery delays, loss of transported goods, and damage to infrastructure affect the efficiency of the supply chain.
Analyzing weather data allows stakeholders of the transport and logistics industry to cope with severe weather conditions. By planning ahead of time, you can adjust timetables and routes, increasing the reliability of your services and the safety of your workforce and passengers. Cost reduction is another advantage of having access to accurate weather forecasts as it increases the efficiency of fuel consumption planning.
Ocean and River Conditions
As the shipping industry is responsible for the transportation of around 90% of world trade, weather conditions on the high seas, large rivers and ports heavily impact the international supply chain.
Monitoring water levels and temperature is crucial to prevent ships from running aground or getting stuck in frozen rivers and harbors. Having accurate weather information about the conditions at sea can help you optimize routes for maximum time and fuel efficiency, while avoiding extreme events like hurricanes, storm surges, fog, ice floes, and high winds, which can impact the course of the vessels and cause accidents.
Check our Shipping and Offshore industry page for detailed information on how weather data can help predict ocean and river conditions.
Quality of Transported Goods
Transporting temperature-sensitive goods – such as meat, plants or livestock, is a delicate task.
Regardless of the weather conditions, trucks and trains need to be able to maintain the appropriate internal temperature during the entire journey. Failing to do so will lead to food spoilage or, in the case of animal transportation, death due to extreme heat or cold.
Besides monitoring events like precipitation, fog, and snow to prepare for unusual road conditions, you can use our weather data to check factors that impact your refrigeration system, such as temperature, wind, and humidity.
Climate Change Impact
Climate change affects transportation infrastructure not designed to endure the effects of higher temperatures.
While rising sea levels and intense flooding can compromise the safety of bridges and trestles, extreme heat can cause thermal cracks on roads and track buckles on rails.
The effects of a warming climate will increasingly bring more operational challenges to the industry. To save costs and ensure people’s safety in the future, stakeholders need to optimize transportation infrastructure for this changing climate.
Climate Projection Data
We make CMIP6 climate projection data available via our API and offer our expertise in weather and climate science to help the transport industry’s stakeholders understand how climate change will impact them.
Our users are able to request the latest CMIP6 data across all 5 socioeconomic pathways, out to 2100. We have applied our expertise to standardize and process the raw climate projection data from the CMIP6 models. This makes it easier for the transport industry to consume and to integrate with their existing data systems.
In addition, Meteomatics broadens the applicability of climate projection data by:
- downscaling the horizontal resolution to 90m to take into account the local topography
- downscaling the temporal resolution to create consistent time series
- calculating around 40 derived parameters that help increase the usability and relevance of climate predictions to more users, such as temperature, wind direction, precipitation and global radiation
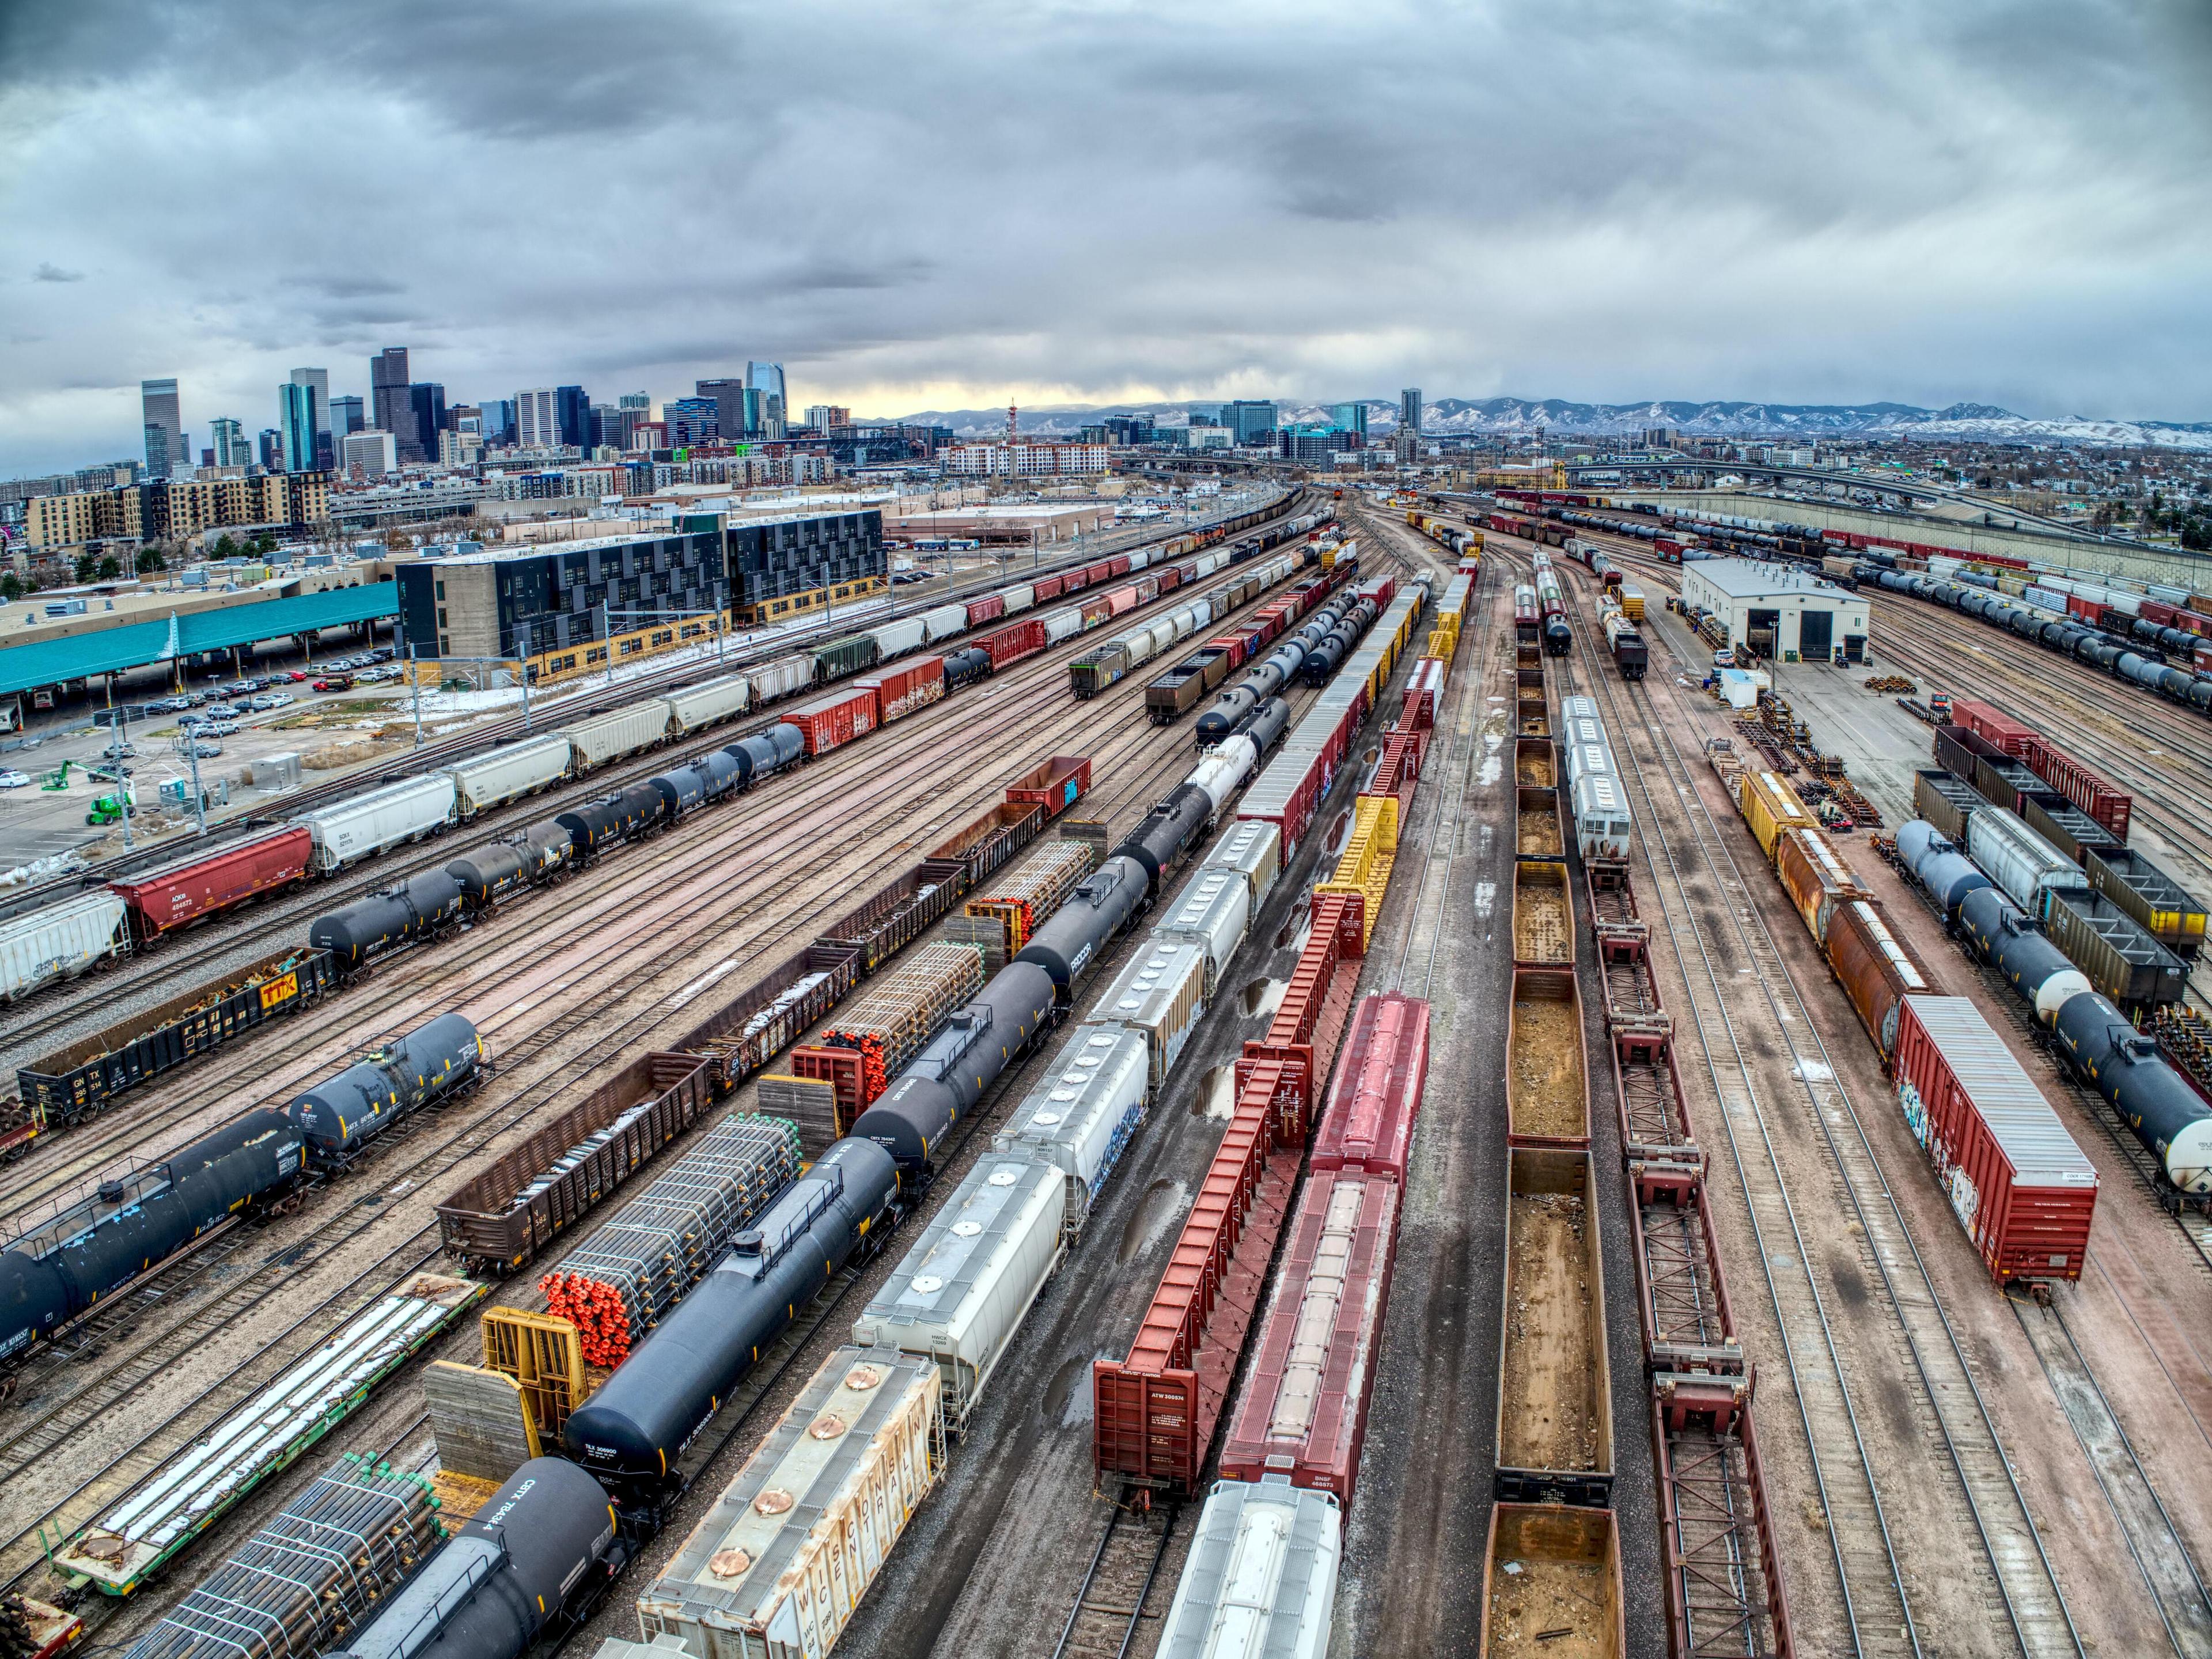
Meteomatics Solutions for the Transport & Logistics Industry
- Snow depth and probability
- Slippery Road index
- Weather Warnings such as Heavy Rain Warning, Snow warning, Wind Warning, Thunderstorm Warning, frost warning
- Temperature at different levels
- Wind speed, gusts and direction
- Relative humidity and dew point
- Precipitation type, amount and probability
- Weather symbol and code
- Solar radiation and cloud cover
- Visibility and fog
Route-based Queries
Meteomatics offers route-based forecasting within its API. Users can simply use a polyline to specify the times and locations that make up their journey. Route-based queries offer users the opportunity to reduce the size of their data payload, enabling them to request a forecast covering their specific planned route and continually update the forecast while underway, ensuring that drivers and support staff have access to the latest weather information to aid operational decision making. Forecasts outputs are available as either csv, json or xml.
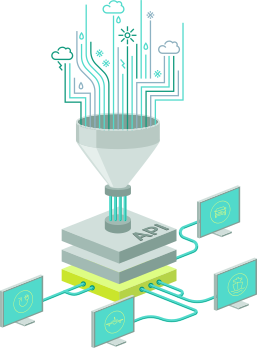
An API (Application Programming Interface) provides an interface for various programming languages that allows developers and programmers to integrate the data directly into their systems in the desired format in just a few steps. The Meteomatics weather API contains data on weather and climate.
It provides access to over 25 weather models (e.g. GFS, ECMWF, DWD, MeteoFrance, UKMetoffice and many more) and over 1800 weather parameters. Our interface is thus considered the gateway to the largest database of historical weather data, forecast data and climate data in the world.


With the availability of over 1800 different weather, environmental, and water parameters in over 25 different models, such as ECMWF or UKMO, through a single interface you can simply access all data in real time as needed through our weather API.
In addition, the flexible sourcing of all data enables the trial and testing of new products and services, allowing innovations to be implemented more quickly or to push dedicated projects faster ahead.
Explore the Power of Our Weather Visualization Map
- Temperature
- Relative Humidity
- Precipitation (radar nowcasting)
- Visibility
- Fog
- Wind Speed / Direction & Gusts
- Severe Weather Warning
- Lightning
- Hail
- Precipitation Type
- Probability for Snow Cover
- Snow Depth
- Slippery Road Index
The combination of our weather data from the Weather API and the MetX visualization software provides one of the most advanced weather forecasting systems available today.
MetX visualizes all available meteorological and oceanographic API parameters such as temperature, pressure, humidity, cloud height, and more.
Our maps are generated with multiple API queries at the same time to quickly visualize the weather data even over large areas including global view. With MetX you always have the complete overview of the global as well as the local weather events. Through the animations you can also observe the development of the weather in detail. By using MetX you make better decisions based on the overall picture of the weather situation.
Our tool facilitates highly flexible weather maps. By using and combining different layers, users can:
- view only relevant weather parameters
- create and remove different layers as needed
- arrange and move layers on top of each other as desired
- combine layers to evaluate different scenarios
- adjust the layers with the help of various setting options, e.g. color saturation


Customer Success Stories
Our expert team of meteorologists and scientists is continuously working on the optimization, accuracy and availability of our data to deliver reliable solutions for your business. Select a customer story and get insights from our various use cases.












We Work With Groundbreaking Companies
We are proud to work with leading companies in the transport & logistics industry. Together, we realize efficiency benefits, better integration of renewables and help our partners realize digital innovations.









Talk to an Expert