01/26/2022
Radar, Station and Model Data: How Meteomatics Mix Provides the Best Data Every Time - a Comparison of Different Data Sources for Scandinavia

Weather data comes from a huge variety of different sources, but thanks to Meteomatics’ Mix Model, you’re always provided with the best data for your use-case. In this article, Tom discusses the differences between sources of weather data and demonstrates that these are not all created equal by examining radar measurements of precipitation in Scandinavia, showing that these outperform model data.
If you’re a Meteomatics customer, chances are you already know that weather data is complicated. Not only are a huge number of variables – some more abstract than others – required in order to understand our atmosphere, but also there are typically many sources of information on each of these. Even if you know which specific aspect of the weather- and climate system is relevant to you – be it for business applications or for research interests – the huge range of data available can be incredibly daunting.
Luckily for our users, a guiding principle of Meteomatics is that our API should not simply provide all the information our customers may require, but also make using it as straightforward as possible. Hence, whilst we facilitate careful choosing from amongst our data sources, in the absence of further specification, our ‘mix’ provides the best available data for the parameters and locations queried through a series of fallbacks.
But what even are the differences between all these sources in the first place? And what kind of impact can the provision of the optimal data source for your problem have? Over several blog posts, I’ll be exploring both of these questions in the context of radar precipitation data, which is available through our API.
What kinds of weather data are there?
At the highest level, weather data can be broken down into two large categories: observations and model data. Observing the weather is quite natural – most of us do it every day when we go outside (or, more recently, gaze longingly out of the window). Observational data, however, has to come from a standardized technique. Instruments for recording standard observations have proliferated since the 16th century, and ground based observatories have spread across the globe, typically recording temperature, pressure, humidity, wind and rainfall.
These days, as well as fixed locations distributed across the Earth’s surface, drifting buoys take measurements of oceanic parameters, and radiosondes take soundings of meteorological parameters through the atmosphere. Meteomatics’ MeteoDrones are changing the game again in the domain of atmospheric observations, providing a remotely controlled miniature observatory for obtaining measurements for specific locations in the air.
The ‘in-situ’ observations summarized above are generally considered the gold standard in meteorology. Of course, instruments need to be carefully calibrated, but there is a direct physical link between the sensor and the measurand, and in general this makes the measurements very trustworthy. This physical link is something of a double-edged sword, however. It is unfeasible to place meteorological observatories at every point throughout the atmosphere, for reasons of both practicality and economy.
Fortunately, just because we don’t have direct observations for all points on the globe, there’s no reason we can’t take an educated guess. As our ability to measure the atmosphere has improved, so has our understanding of the physical processes which underpin the evolution of weather. Over time, our theoretical framework has expanded to such an extent that we’re now able to fill in the gaps between observations with model data, including in the vast reaches of the upper atmosphere which are incredibly difficult to directly measure.
The problem with models in general is that they are based on an incomplete understanding of how nature behaves. Oftentimes we are still unsure of how a process works, and even when we’re pretty confident, we regularly make simplifying assumptions for the benefit of easier calculation. The problem with meteorological models specifically is that the atmosphere is made up of many billions (1) of molecules, each of which interact in ways we can’t deterministically calculate (2). However, as well as being able to provide estimates for the gaps in our observation network in space, models are also amazingly able to do this in time as well, enabling us to reconstruct the past and predict the future!
This categorization of all data as either purely observational or purely model derived is neat, but not entirely accurate. For the last 100 years an additional sub-category of observations has been increasingly available and relevant in meteorology: remotely sensed data. Owing to our discovery of the full spectrum of electromagnetic radiation and its ability to transport information about objects with which it interacts, meteorologists have been able to develop new techniques. These allow the measurement of continuous stretches of the atmosphere, rather than discrete locations with an existing station, and, since the dawn of the satellite era, this has meant that the whole Earth can be scanned regularly and rapidly.
The drawback of remotely sensed data is that it too depends on a model for how radiation behaves, which is not entirely understood. Whatever is measured though does depend on the actual current state of the atmosphere – it is not simply an estimate. In the next section, we’ll look at an example of remotely sensed data, and see how it compares against both model data and in-situ observations of precipitation over Scandinavia.
RADAR
Radar (3) is a nice technique to examine in remote sensing because of its relatively intuitive principle of operation. The idea is similar to that of sonar (4) – or ‘echolocation’ – a wave is emitted from an instrument, bounces off an object upon interacting with it, and at least partially returns to the instrument, where it is detected. The physical model that we use to decode information about the target is that the wave travels at a constant speed (5), and by solving some equations we can determine the distance to the target.
Radar uses radio waves because these travel through the atmosphere without much interference until they encounter something solid. One such solid thing is condensed water, both actively precipitating and trapped inside clouds (6). The fact that radar can effectively ‘see’ into clouds and estimate the mass of rain droplets mean that it is effectively part observation, part forecast: heavy enough rain which has not yet fallen from a cloud will do so soon. Furthermore, modern radar can distinguish between different types of precipitation, including hail and snow depending on, amongst other things, estimates of how quickly they are falling (determined from the Doppler effect).
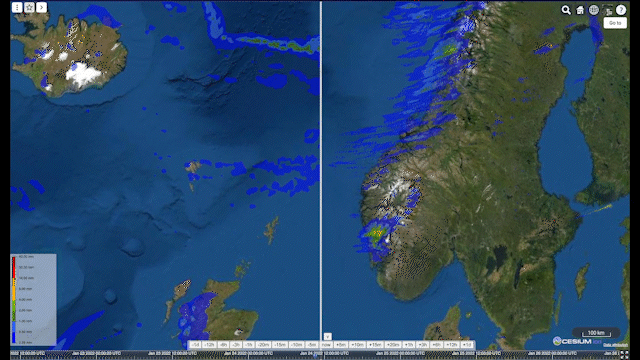
Animation: comparison over Scandinavia of ECMWF’s Integrated Forecasting System (IFS) on the left side with radar data in the Meteomatics API on the right side
In the animation above, I compare data from ECMWF’s Integrated Forecasting System (IFS) with radar data in the Meteomatics API (7). We can clearly see the difference between data from our Scandinavian radars (which we process into a data layer from single sites in-house) and the model. Whilst IFS does a good job of predicting the shape of incoming precipitation events, the overall amount of rainfall is generally much larger than that determined by the radar. This alone doesn’t tell us which of the two data sources is more accurate though. Is radar underestimating the true amount of rainfall, or is IFS overpredicting it?
I was able to answer this question by comparing both of these data sources to observational data from ground stations, using the Python connector. My code for doing so is available on request for anyone interested in similar comparison of Meteomatics data sources.
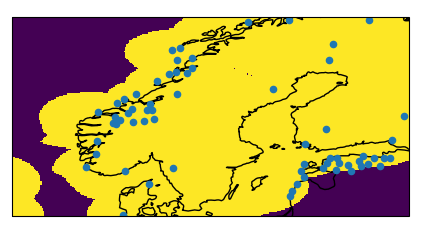
Considering the period from the 1st to the 24th of January this year, I queried radar- and IFS data by specifying the source in the API. Both of these products are available over continuous areas at user specified spatial resolution. I also retrieved time-series for all the stations within the range of the radars, discarding those for which more than 10% of the data was missing. You can see a figure (figure 1) illustrating the locations of these stations, as well as the range of our Scandinavian radar network, below.

By extracting the data associated with the precise locations of these stations from both the radar and the model data, I was able to produce the following plot.

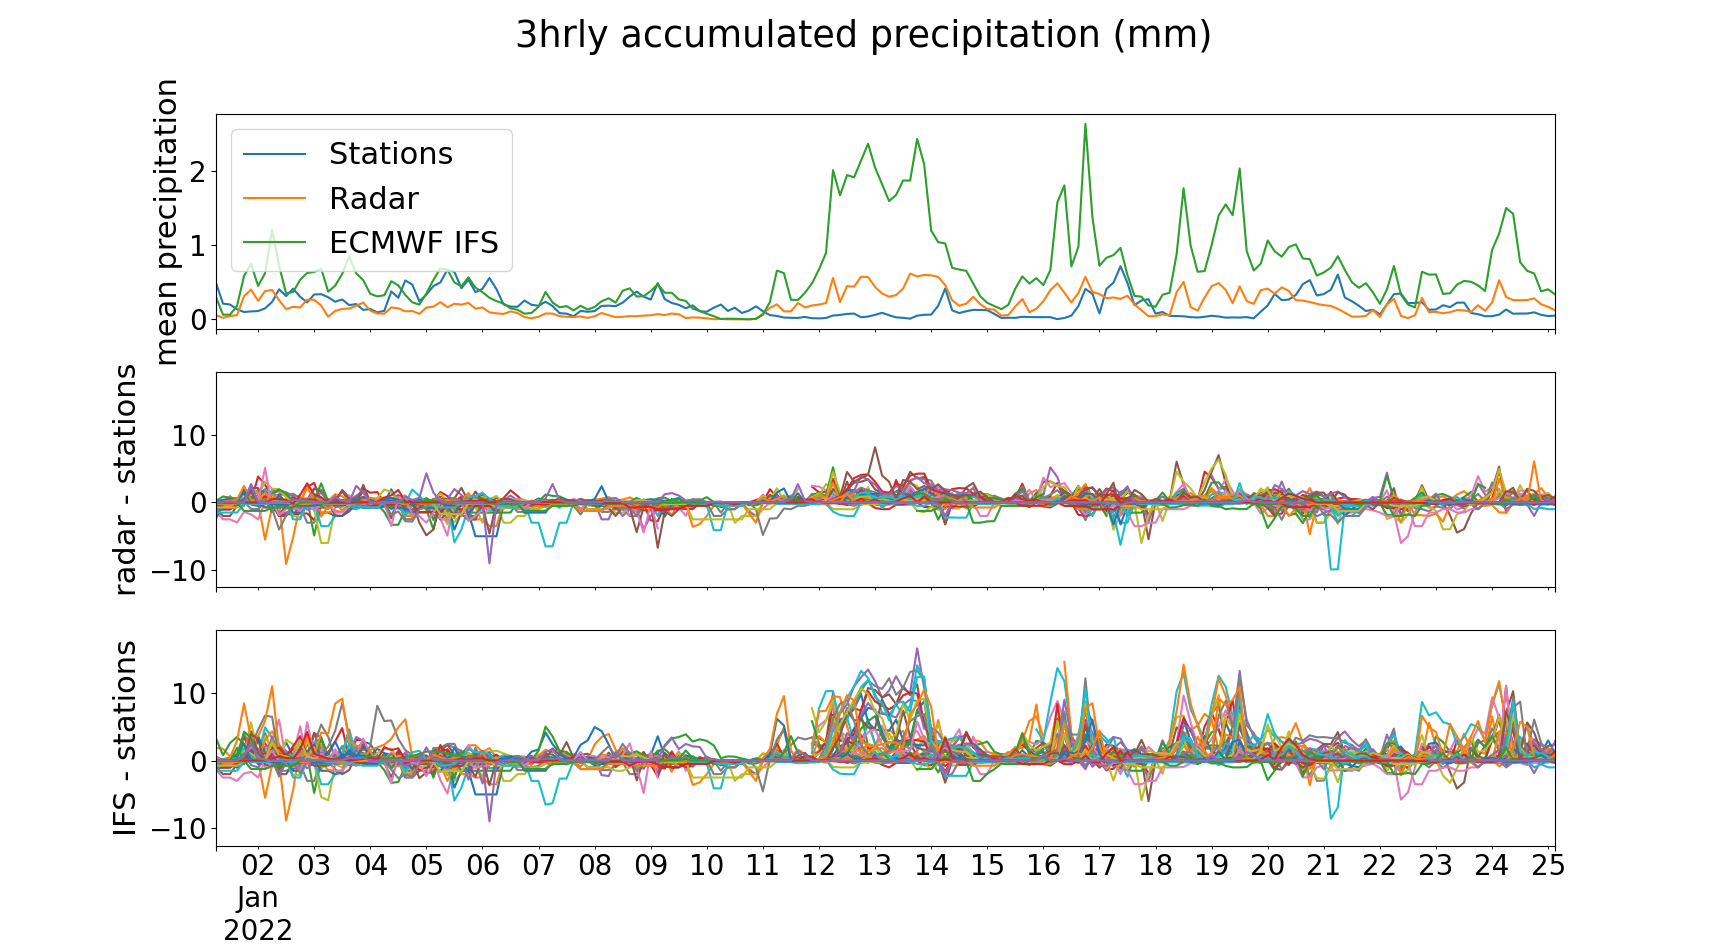
In the top panel of the above I show the average at each station of the in-situ observations (blue line), the radar (orange) and the model (green).
The radar line sits typically within 0.5mm of the origin, and although agreement with the stations is not perfect (which would be represented by a flat line at 0), doesn’t appear to suffer from a systematic bias. By contrast we see that the model almost always overestimates precipitation relative to the radar (as we saw in the animation) and that this is not in line with actual observations from ground-based observatories. It’s interesting to note that the period of most disagreement between the model and the stations occurs when there is almost no precipitation recorded by in-situ stations, and that both IFS and the radar have a tendency to agree pretty well with the stations when there is a real heavy rainfall event.
In the subsequent panels I show separately the difference between the radar and the stations (middle panel) and the model and the stations (bottom panel) without averaging over the stations. I included these to give an idea of the amount of variation in the two data sources. The scale is set by the model, which regularly disagrees with the stations by up to 10mm over three hours of accumulation; the radar, by contrast, rarely exceeds a disagreement of 5mm over the same period.
I should end this article by clarifying that ECMWF’s IFS is a fantastic achievement. We wouldn’t include it in our API if we at Meteomatics didn’t believe it was amongst the best models out there, and this indeed is why it is still our first choice of rainfall parameter in parts of the globe where radar data is not available.
Additionally, I’ll reemphasize that only model data can be relied upon for a true forecast, and IFS has a lead time of 10 days. The general pattern of weather is very well captured by IFS, so if you’ve got a trip planned on Monday for the weekend (in about 5 days’ time) that relies on good weather, it’s your best source of information. Hopefully this article has explained though that there’s nothing as true as an in-situ observation, and that remotely sensed observations give us incredible new power when wanting to extend our network into the clouds.
At Meteomatics, we provide all data sources through our API with real time access, making all the relevant data from stations, radar and models simultaneously retrievable and comparable. This provides the best overview to assess every weather situation and gain the insights that are valuable for your organization. In case you are interested in learning more about this topic or in case you areinterested in learning more about the code I used for my analysis, please reach out to me under [email protected] – I’m always happy to help and engage with weather enthusiasts!
Watch this space for more updates on our radar data, including a more sophisticated model verification method, and some industry specific use cases, coming soon. If there is a specific topic that is of particular interest to you, you are welcome to let me know, and I will consider writing an exciting article on it. I welcome all new suggestions!
- Approximately 1044 actually, so almost a billion billion billion billion billion
- We can attempt to parameterise the important aspects of models, but ultimately the weather and climate system also evolves chaotically.
- More properly RADAR, since it is an acronym of Radio Detection and ranging
- More properly SONAR, since it is an acronym of Sound Detecting and Ranging
- The model that is used in real radar stations is actually more complicated than this, because the atmosphere has a variable density which causes radiation to travel at different speeds. By way of an example: the atmosphere is known to thin with increasing height, which means a radar beam fired into the upper atmosphere will curve, and corrections for this curvature need to be made in order to correctly interpret the reflected beam.
- Radar was initially developed for the detection of aircraft during wartime. In this application, operators noticed that liquid water could interfere with their work, and developed techniques to distinguish and remove the interference. It was only after the Second World War that scientists changed tack and realized that measurements of liquid water in the atmosphere could be a help rather than a hindrance.
- The visualization was produced with the Meteomatics MetX tool.

Talk to an Expert
Related Articles


We provide the most accurate weather data for any location, at any time, to improve your business.