Pressure System
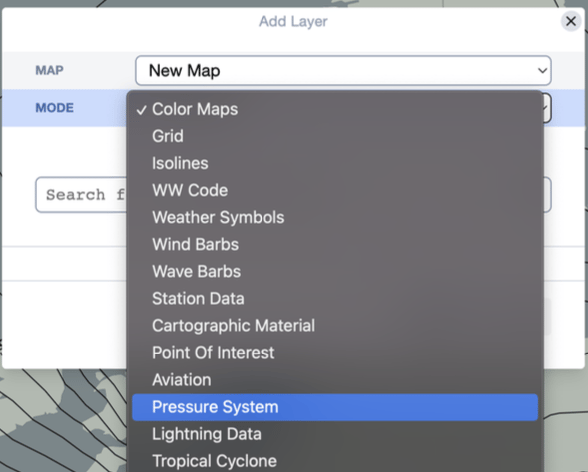
The center of high and low pressure systems are a useful indicator on forecasting maps. With MetX, you can display these pressure systems with ”H” and ”L” in addition to the central pressure. To enable the labeling, click on the Layer Stack, select ”Add Layer” and ”Pressure System” in the ”Mode” section.

Once the layer is added, highs and lows are added to the map. In the Layer Stack, the properties of the pressure systems can be adjusted. Increasing the Median or Gaussian filter reduces the number of highlighted pressure systems.
Adjusting the ”Range” changes the possible values taken by the high and low pressure systems. This can also help to reduce the number of pressure systems displayed. For example, selecting a ”step” of 4 hPa within ”Range” will highlight only the pressure system centres that would be visible if pressure isolines were plotted at intervals of 4 hPa.

