Isolines
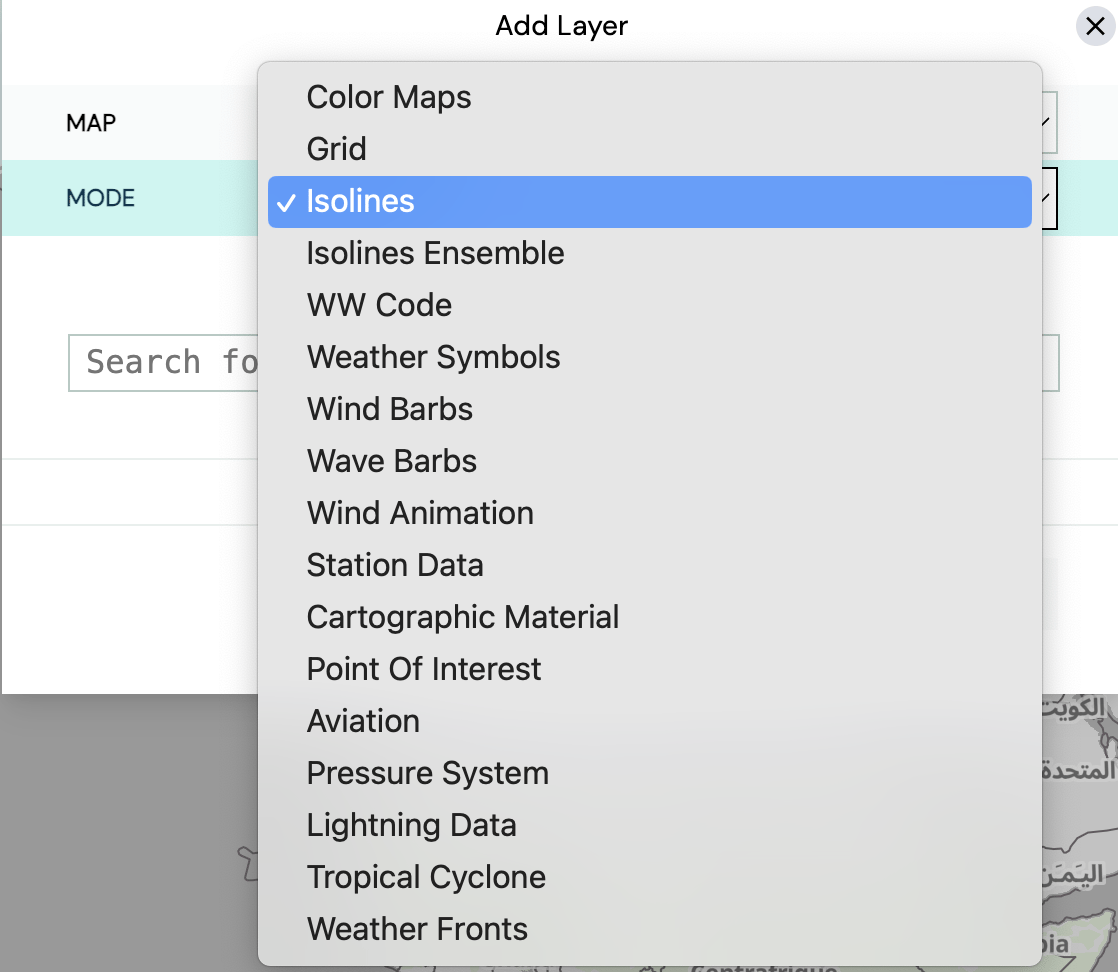
MetX allows you to display data as isolines, In the section, click ”Add Layer” and select ”Isolines” as layer mode.

As an example, let’s add the mean sea level pressure by typing ”msl” in the blank field below the layer mode. Select the first suggestion, click ”Apply” and the layer is added. In the Layer Stack, click on the msl pressure layer and the following preferences are shown:


In addition to the preferences in the Grids, line color and width, values, range, median and Gaussian filter can be modified. Specific ”values” can be specified, i.e. if the user wants to display only isobars of a certain value. Similarly, a user-defined range of isobars can be defined by specifying minimum, maximum and step size, e.g. ”970, 1030, 2”.


Isoline Ensembles
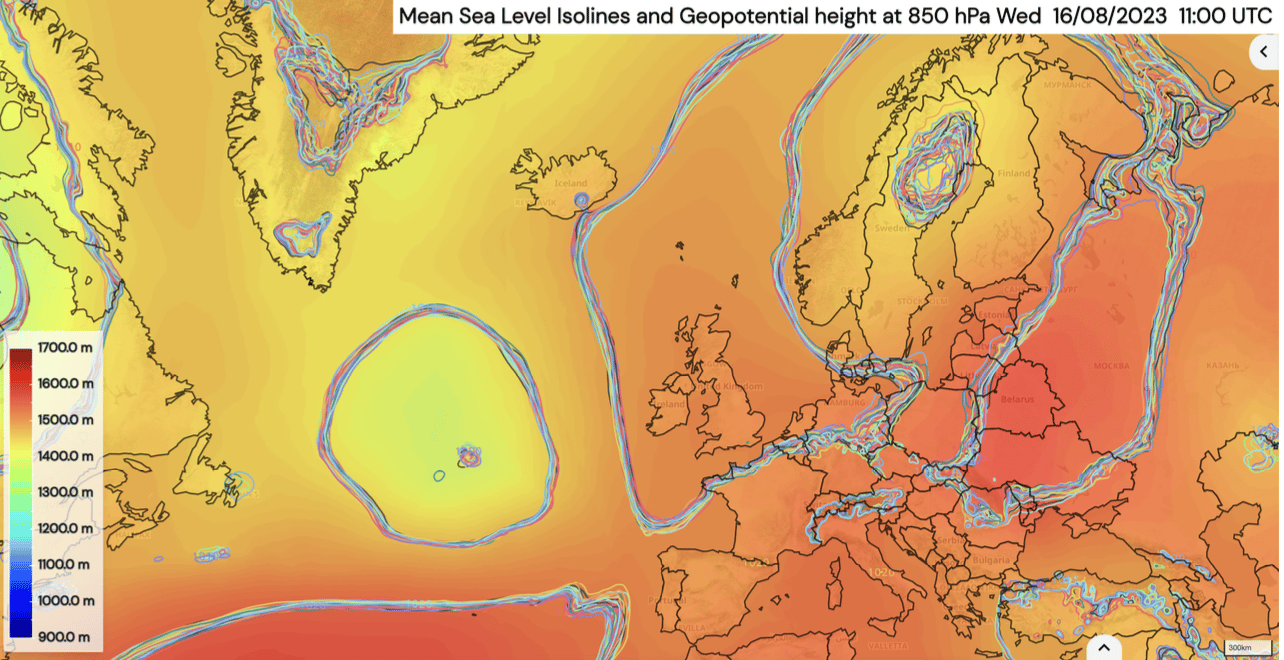
The isolines from the ensemble members of an ensemble model can be displayed simultaneously using an Isolines Ensemble, also known as ”Isoline Spaghetti”. In the Layer Stack, click ”Add Layer” and select ”Isolines Ensemble” as layer mode. In the Layer Stack, select a source with ensemble members, such as ”ECMWF ENS”. Isolines are displayed in different colours for all members or all quantiles, which can then be individually added and removed.


Properties of the isoline ensemble can be adjusted in the Layer Stack in the same way as the standard Isolines.