Layer Stack
The weather layer overview enables the user to add weather data from multiple sources onto the map or into a plot. To add weather layers in general, simply click on ”Layers” and the ”Layer Stack” will open.


The following elements are visible on the layer stack window:
- Map name ”New Title”: Clicking on ”New Title” and replacing the description with a new name changes the map title.
- Copy/paste/ delete existing layers: Layer stacks can be copied or pasted into current dashboards.
- This entry shows the current layer displayed.
- A button to add weather layers to the map.
The user is able to flexibly drag and drop the layer stack window over the map by clicking and holding the left mouse button near the top left on the grip dots. The first layer is added by default and contains a ”Basic” background map (for further information about map options, see section "Cartographic Material"). To add one or more weather layers, click on ”Add Layer” which will trigger the following window:


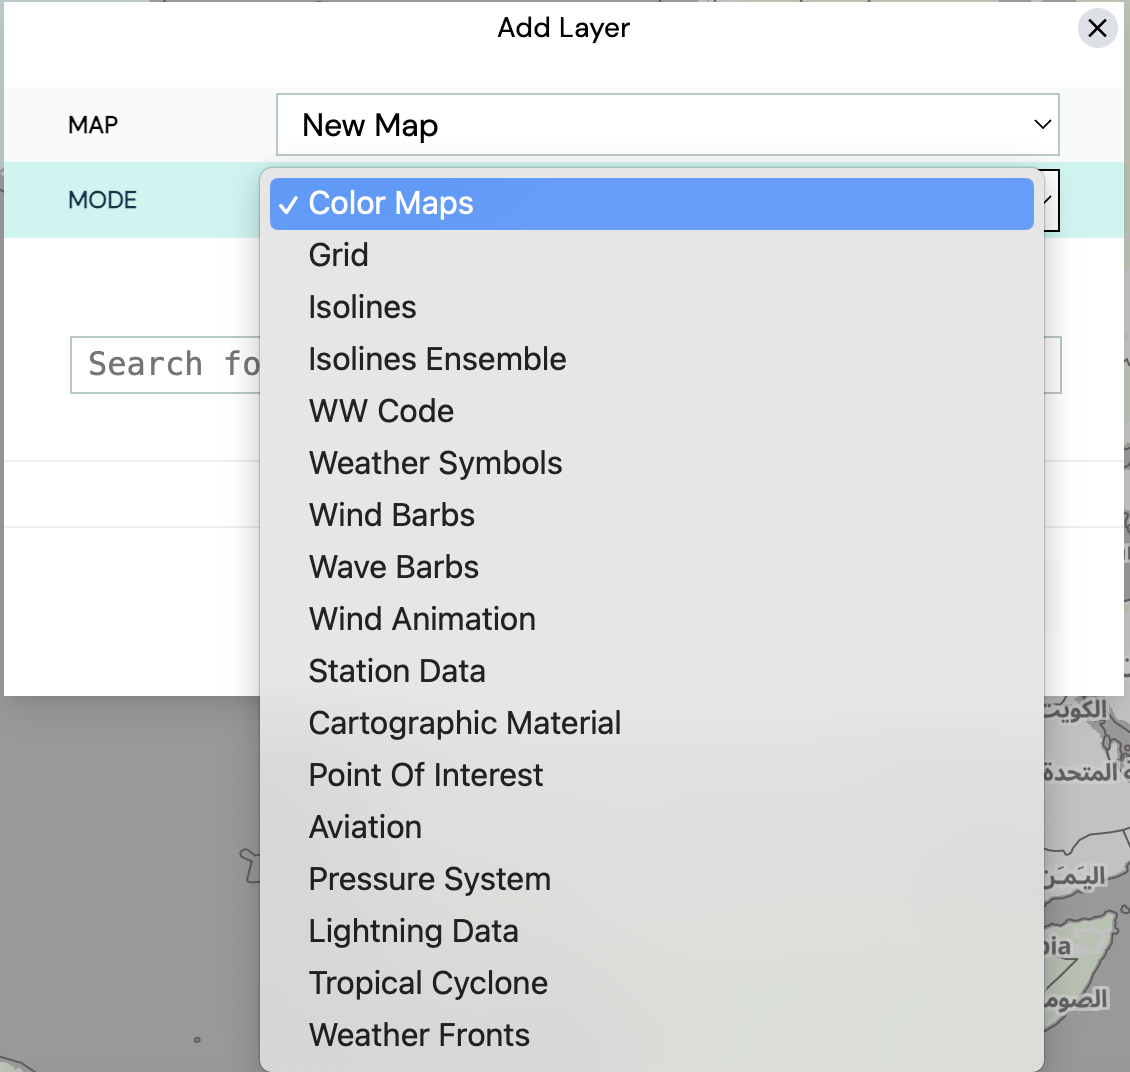
In this window, the user can specify different kinds of weather layers, in particular parameter related to Color Maps, Grids, Isolines, Isoline Ensembles, WW Codes, Weather Symbols, Wind and Wave Barbs, Wind Animation, Station Data, Points of Interest, Aviation, Pressure System, Lightning Data, Tropical Cyclones, Weather Fronts, and Custom GeoJSON. Each layer has its own possibilities and preferences, as described in the sections below. To select a specific layer, click at the dropdown menu ”Mode”, which shows the following window:

If a weather layer is added, the order of layers can also be changed by dragging and dropping the layer to the top or bottom. Clicking on a layer shows its preferences, where the parameter itself can also be changed:

