MetX Example Dashboard: Weather Overview

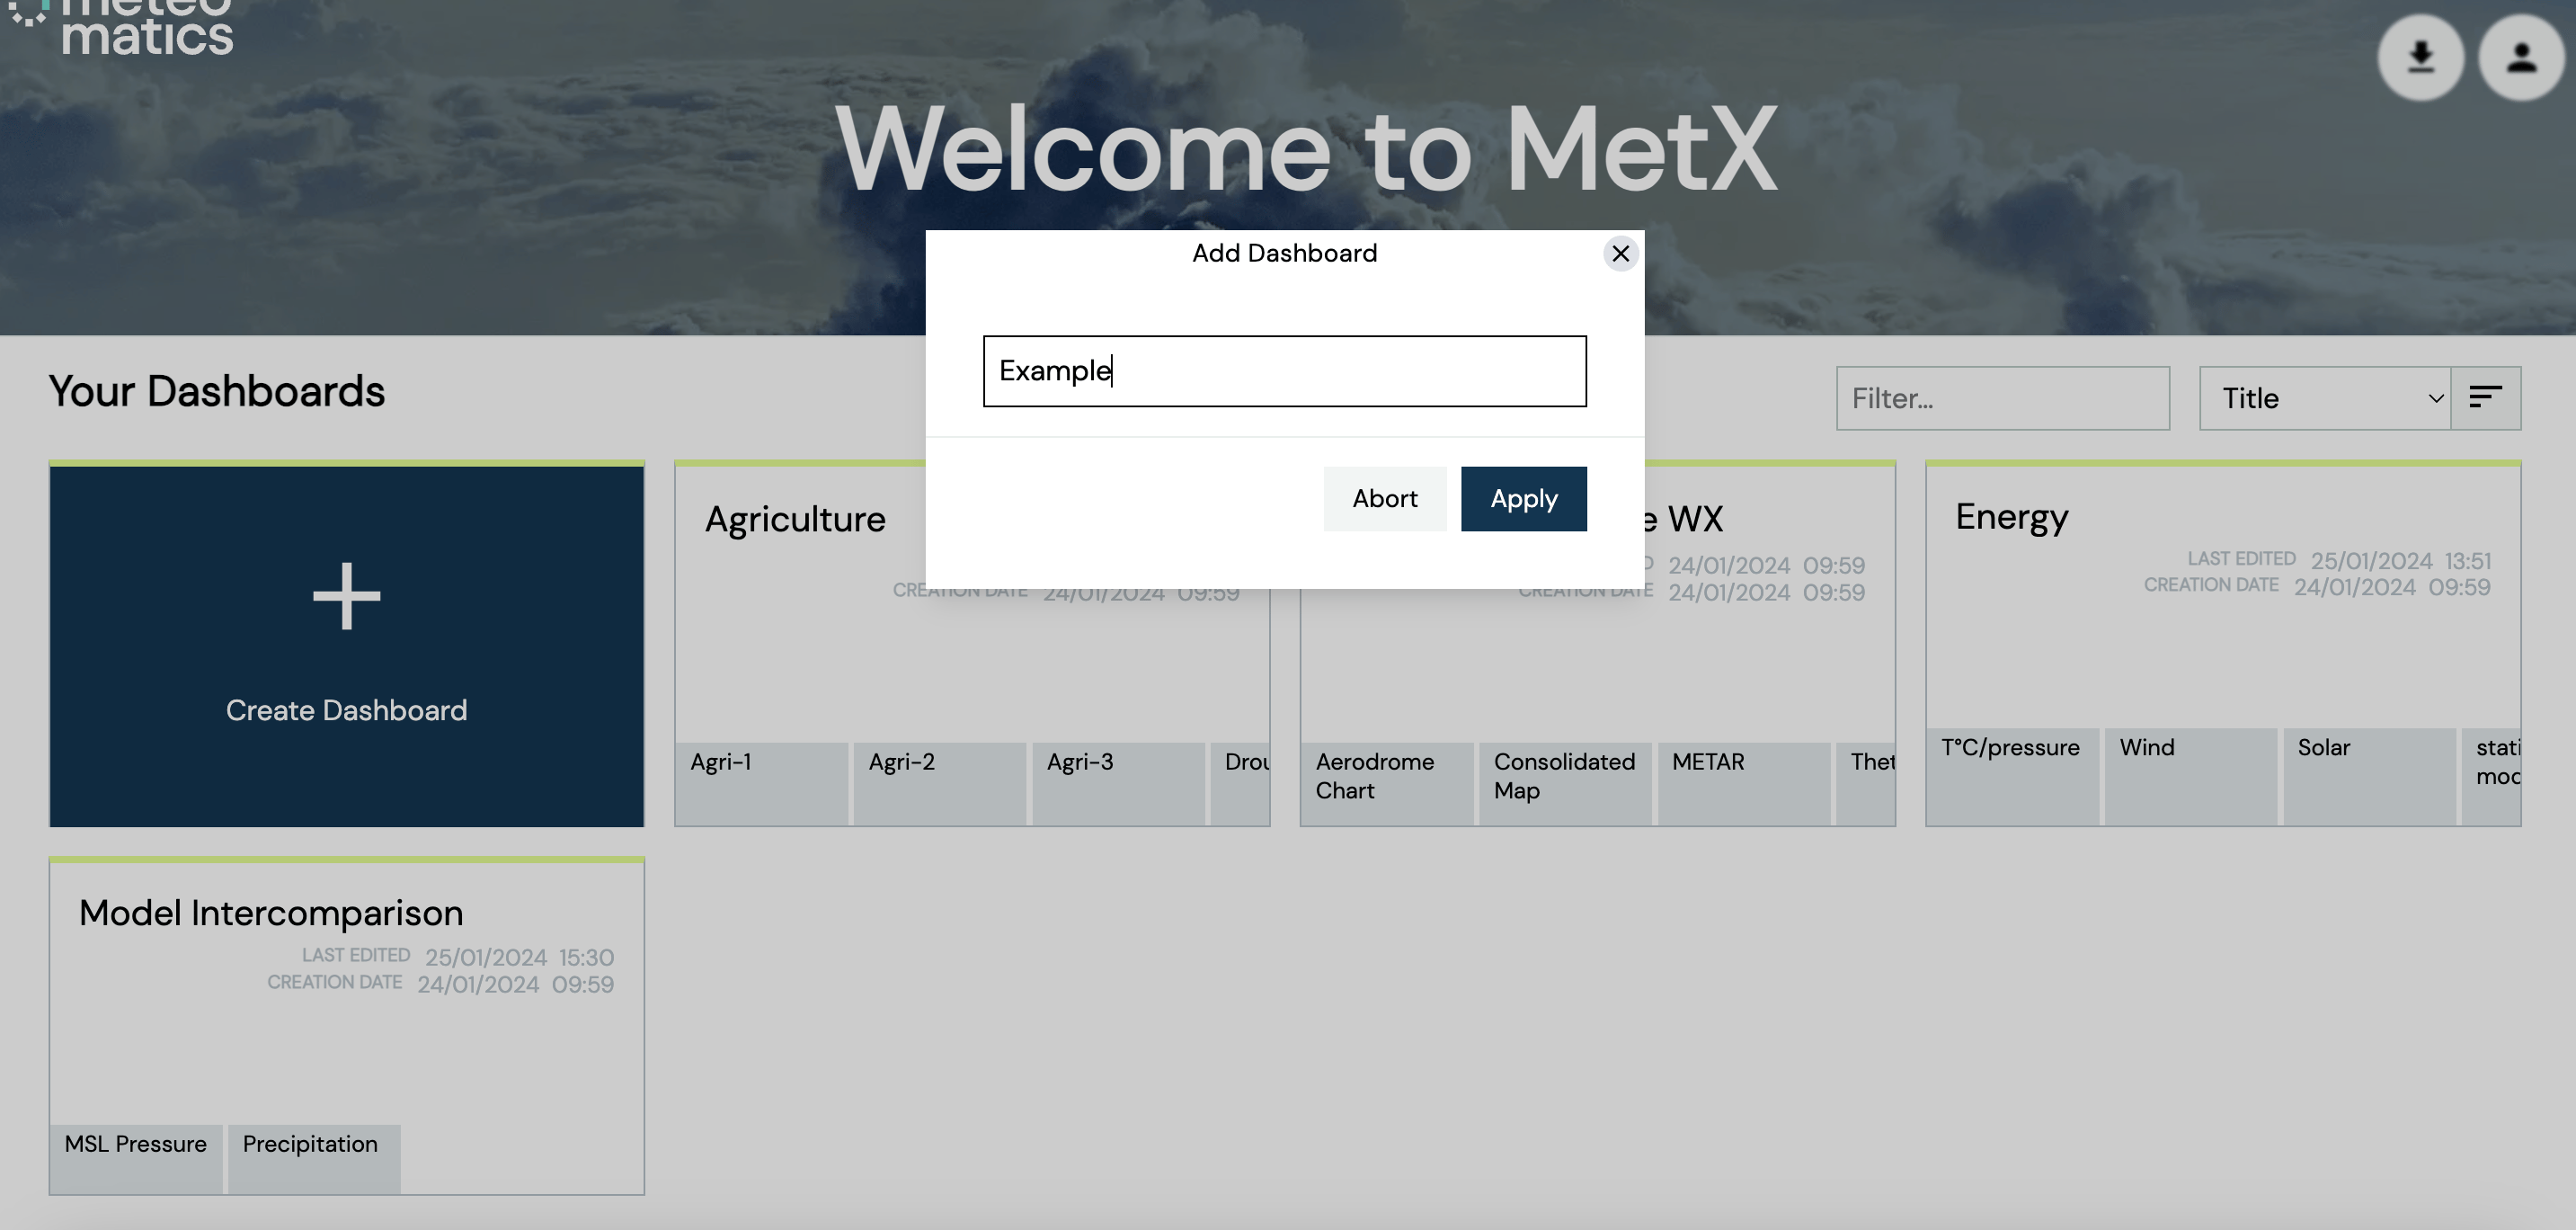
Let’s create a map giving a general weather overview. First, create a new dashboard in the welcome screen. To do so, click on the ”Create Dashboard” button, enter the name of your new dashboard e.g. ”MetX Examples” and click on the ”Apply” button (see section First Navigation).

Alternatively, you can open a new tab in an already existing dashboard.

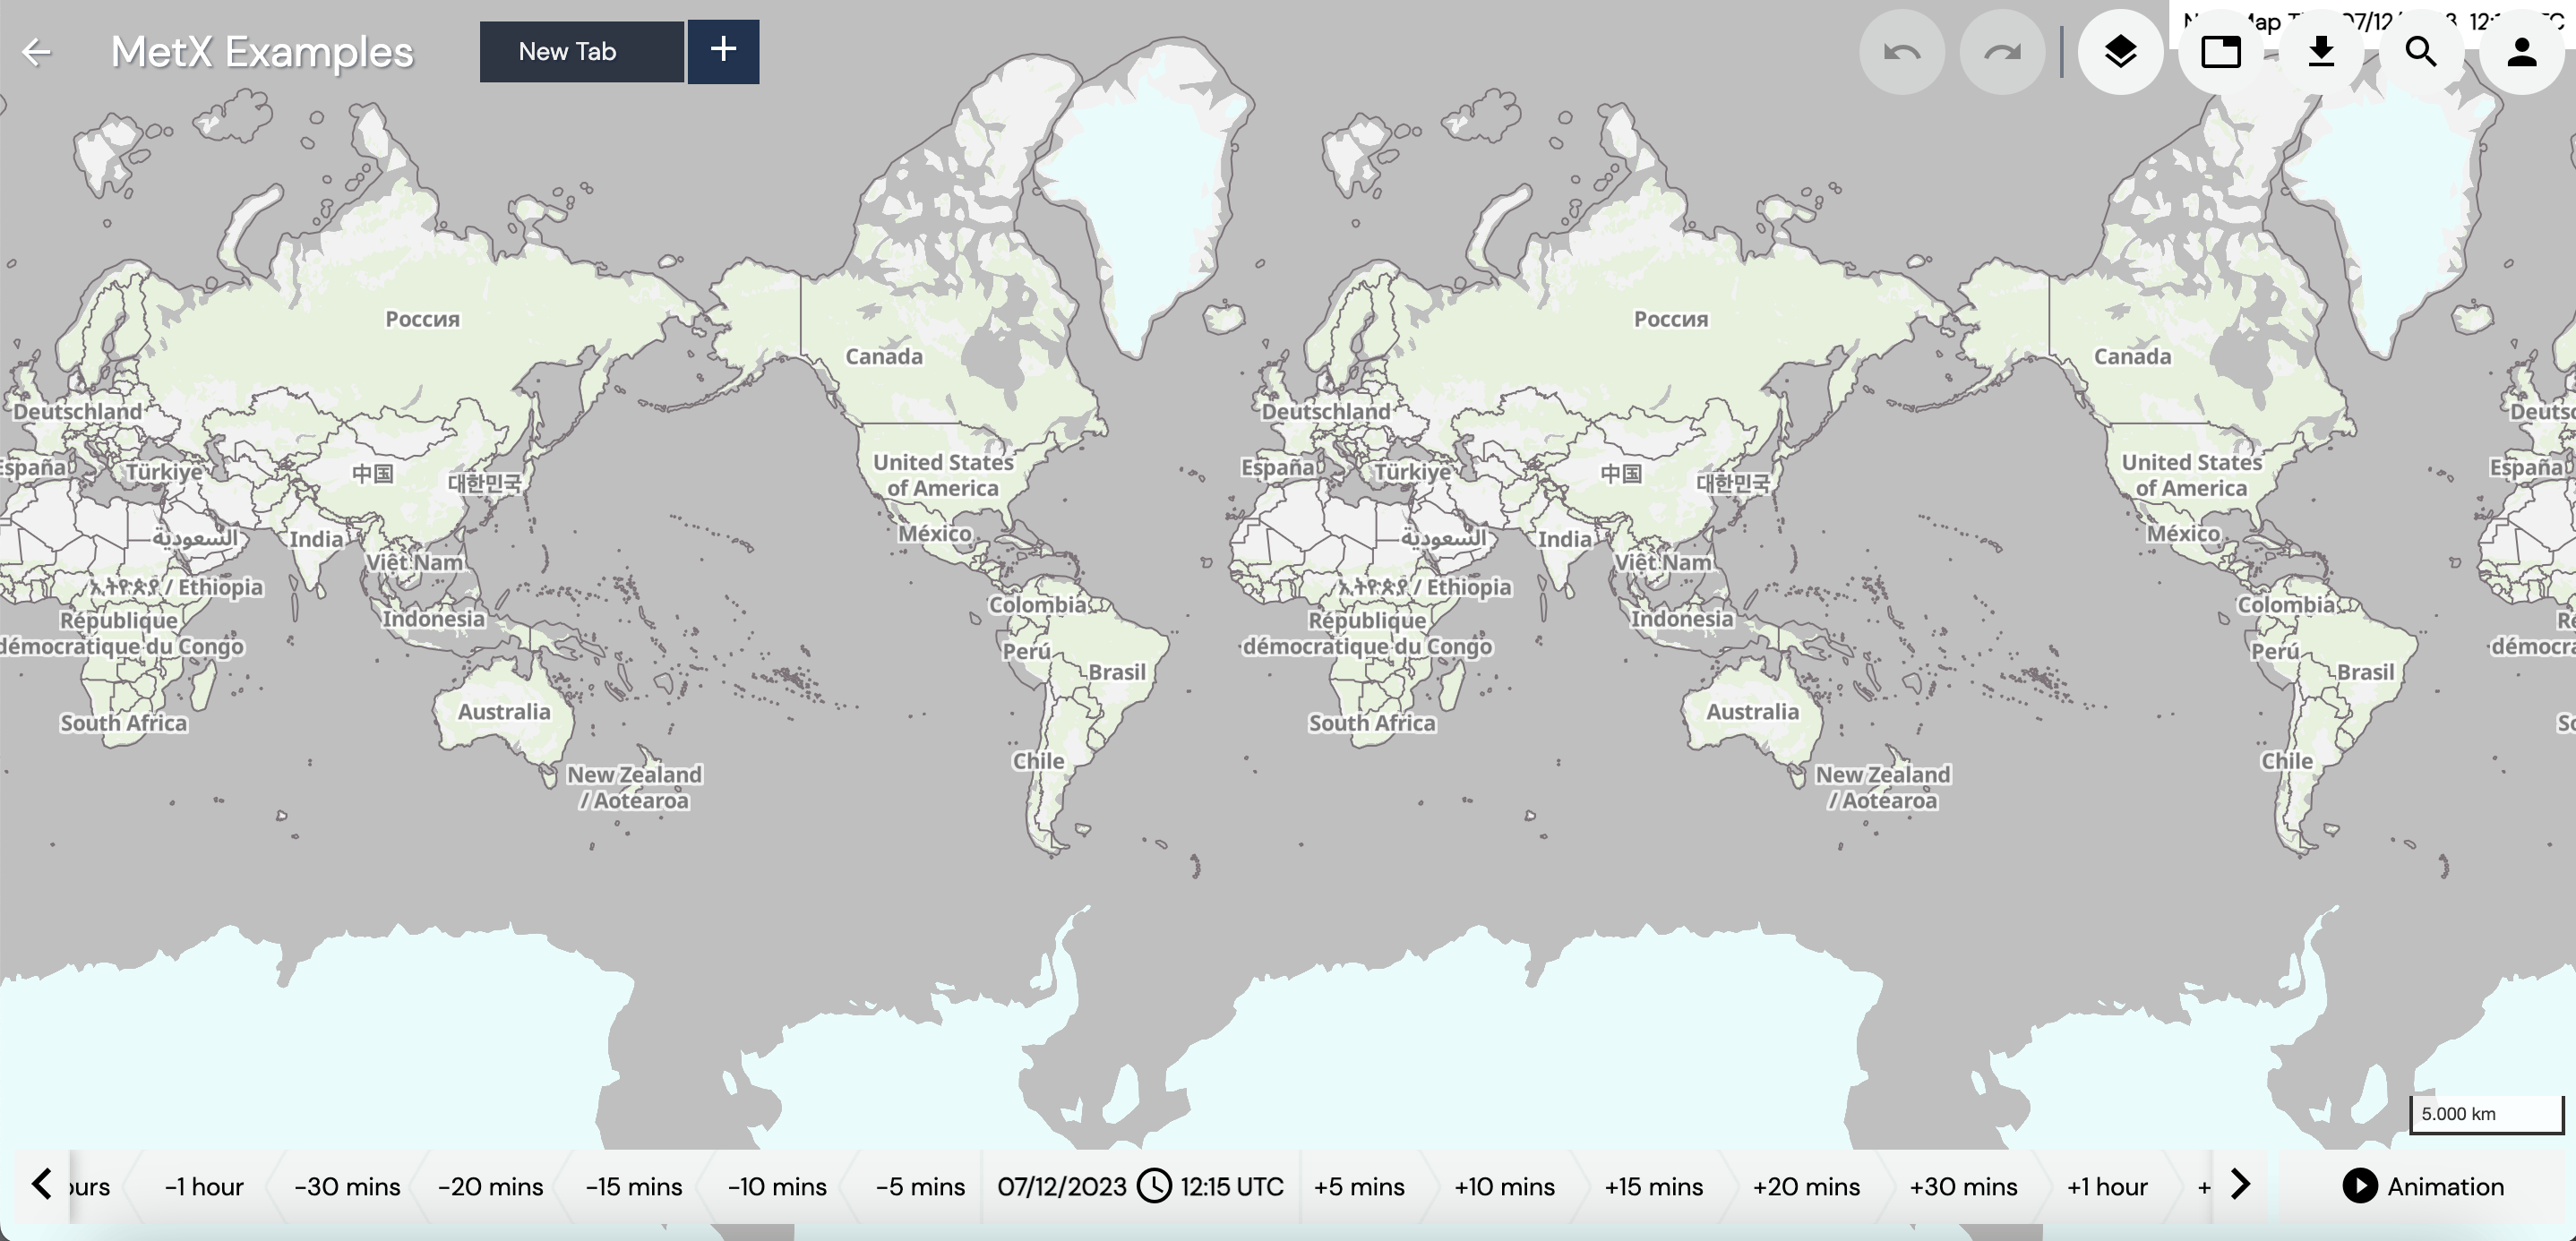

Now, the newly created tab can be renamed e.g. with ”Weather Overview” by clicking on ”New Tab”. In a next step, select the desired parameters. Click on the Layer Stack icon to open the Layer Stack.

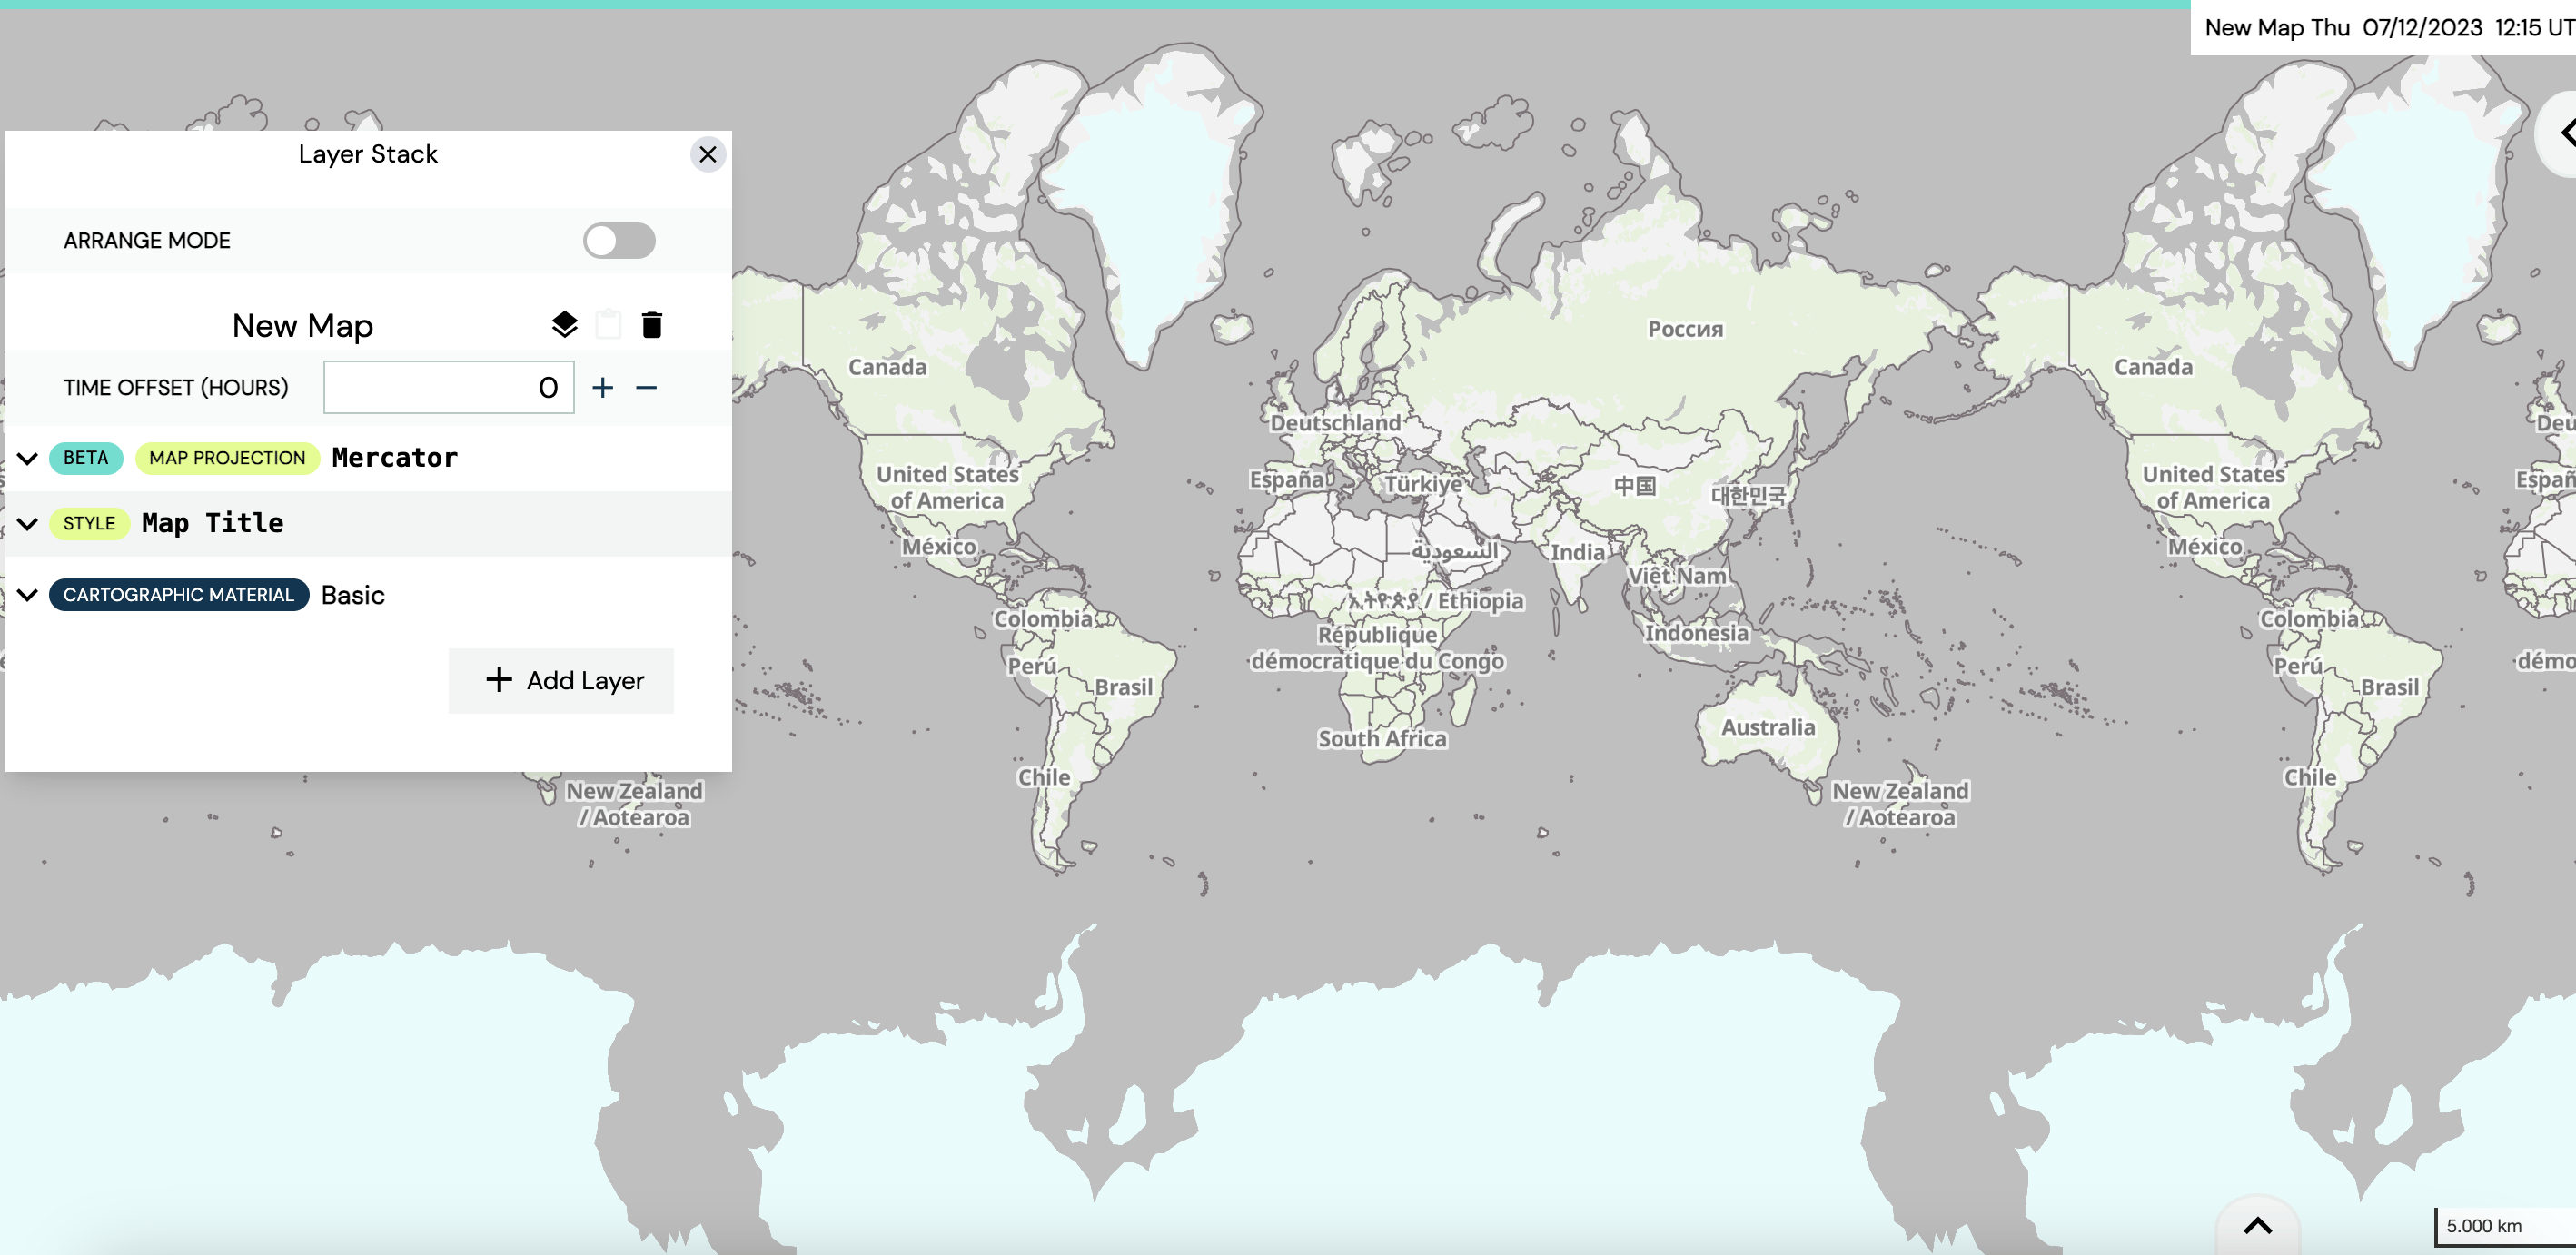

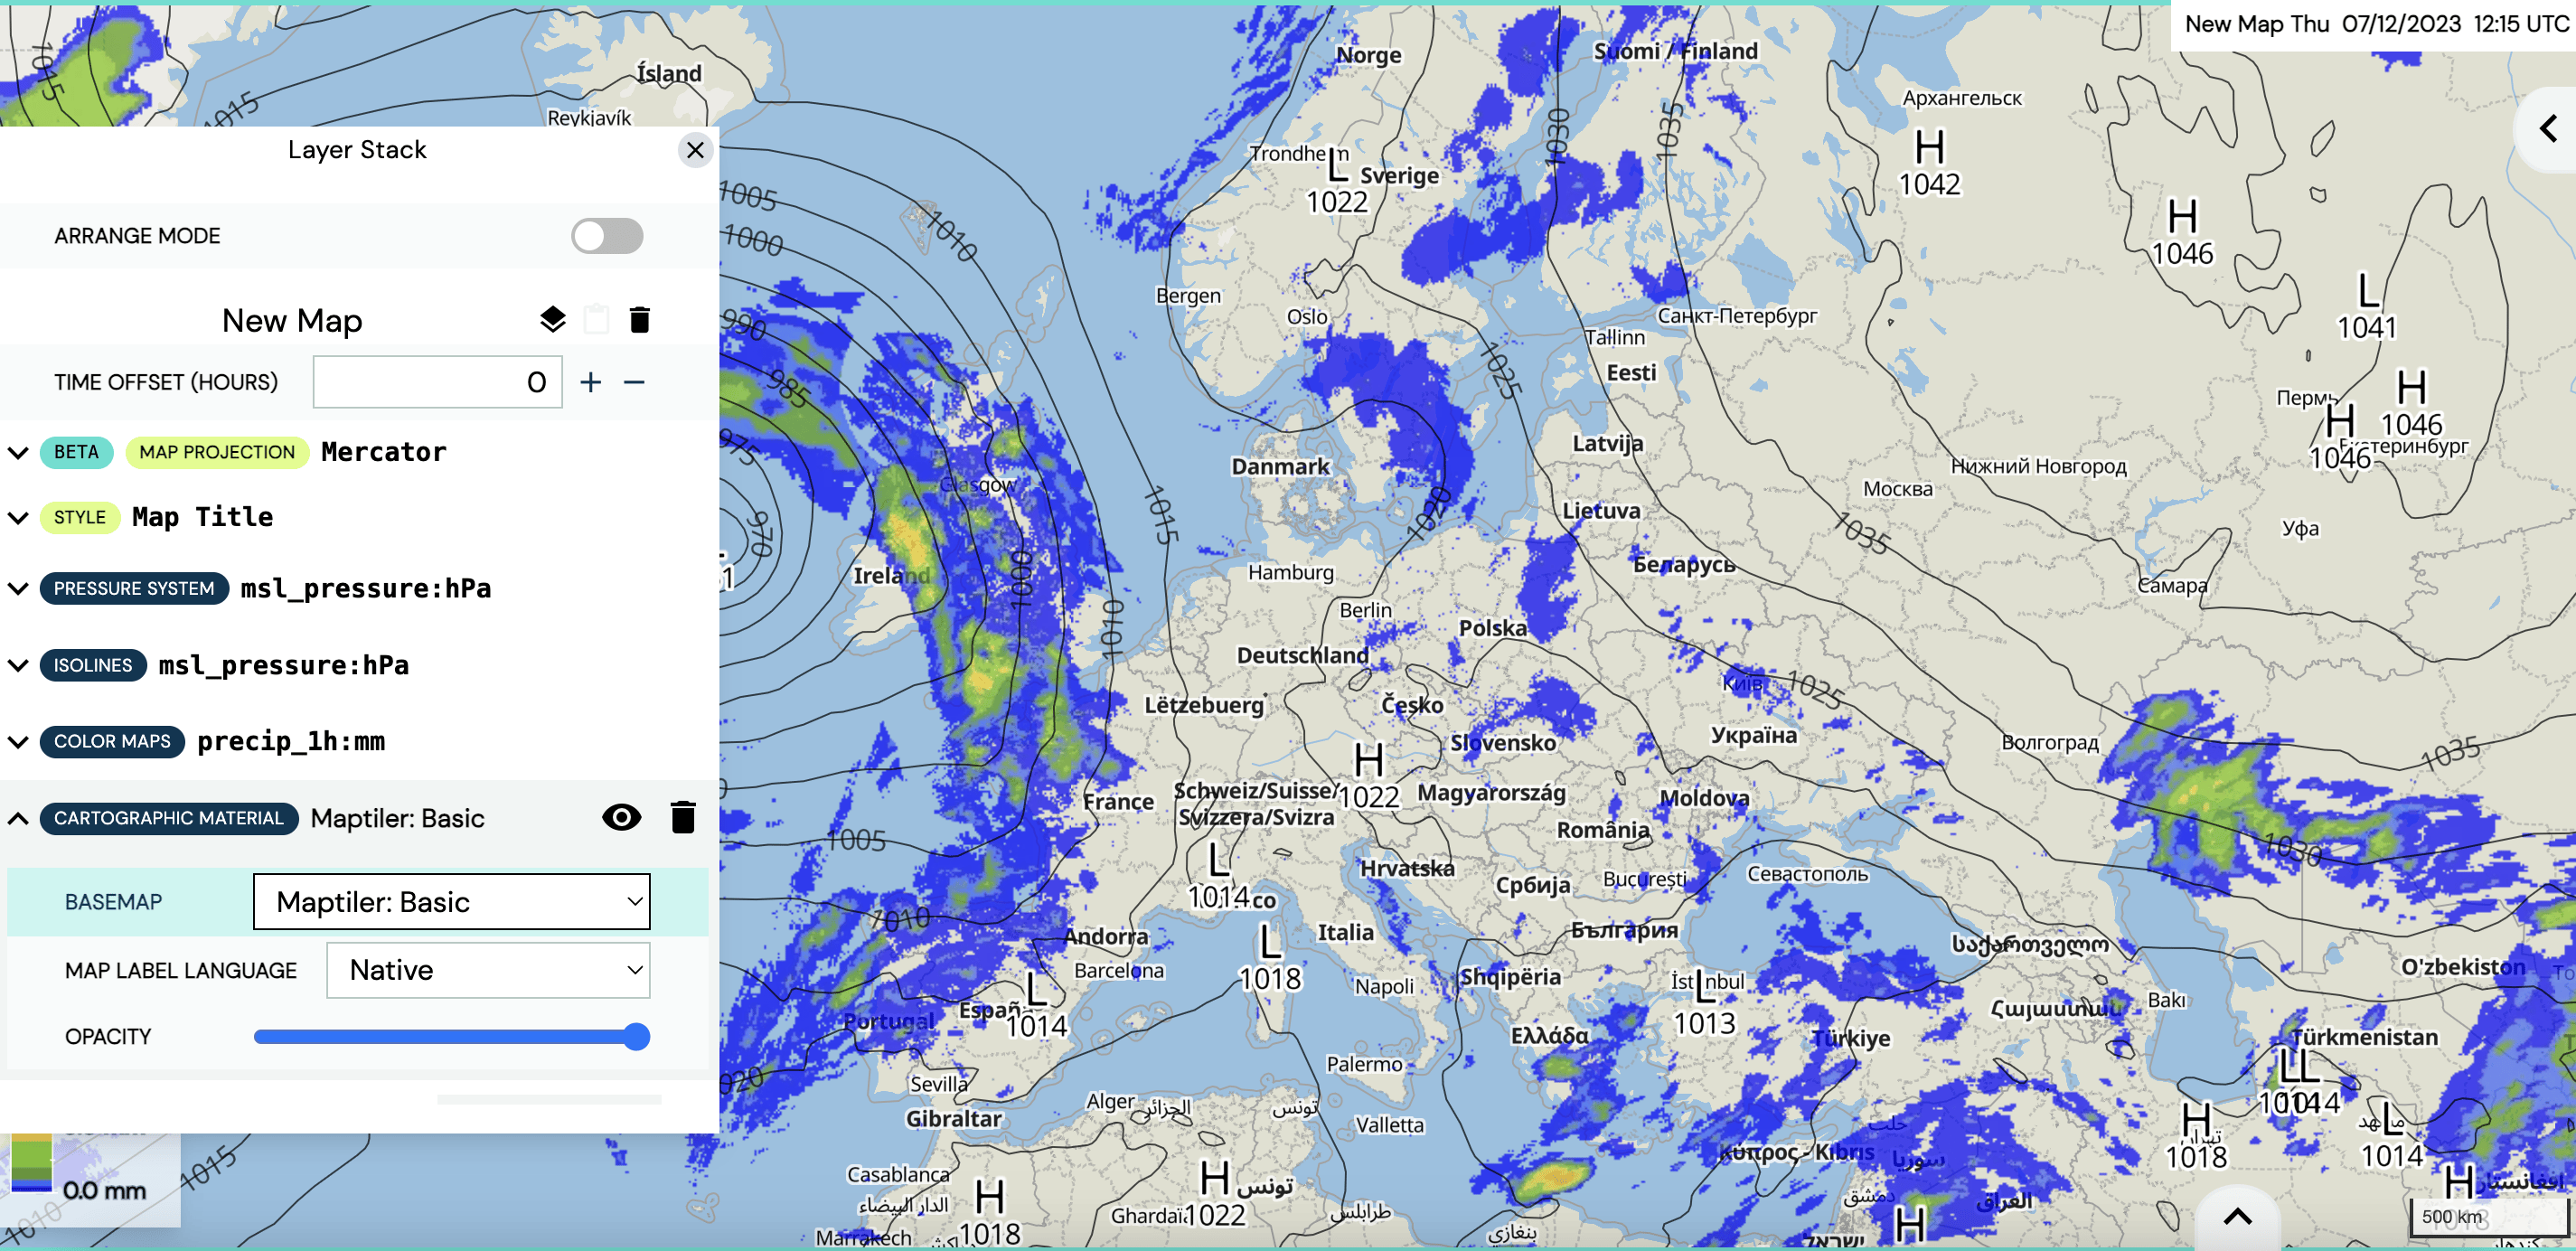
Click the ”Add Layer” button on the bottom right of the Layer Stack. A new window opens. We want to add a new colormap. Select ”Color Maps” as ”MODE” (see section Colour Maps). Then, type ”precip” in the ”Search for weather parameters” box to add precipitation to the map.


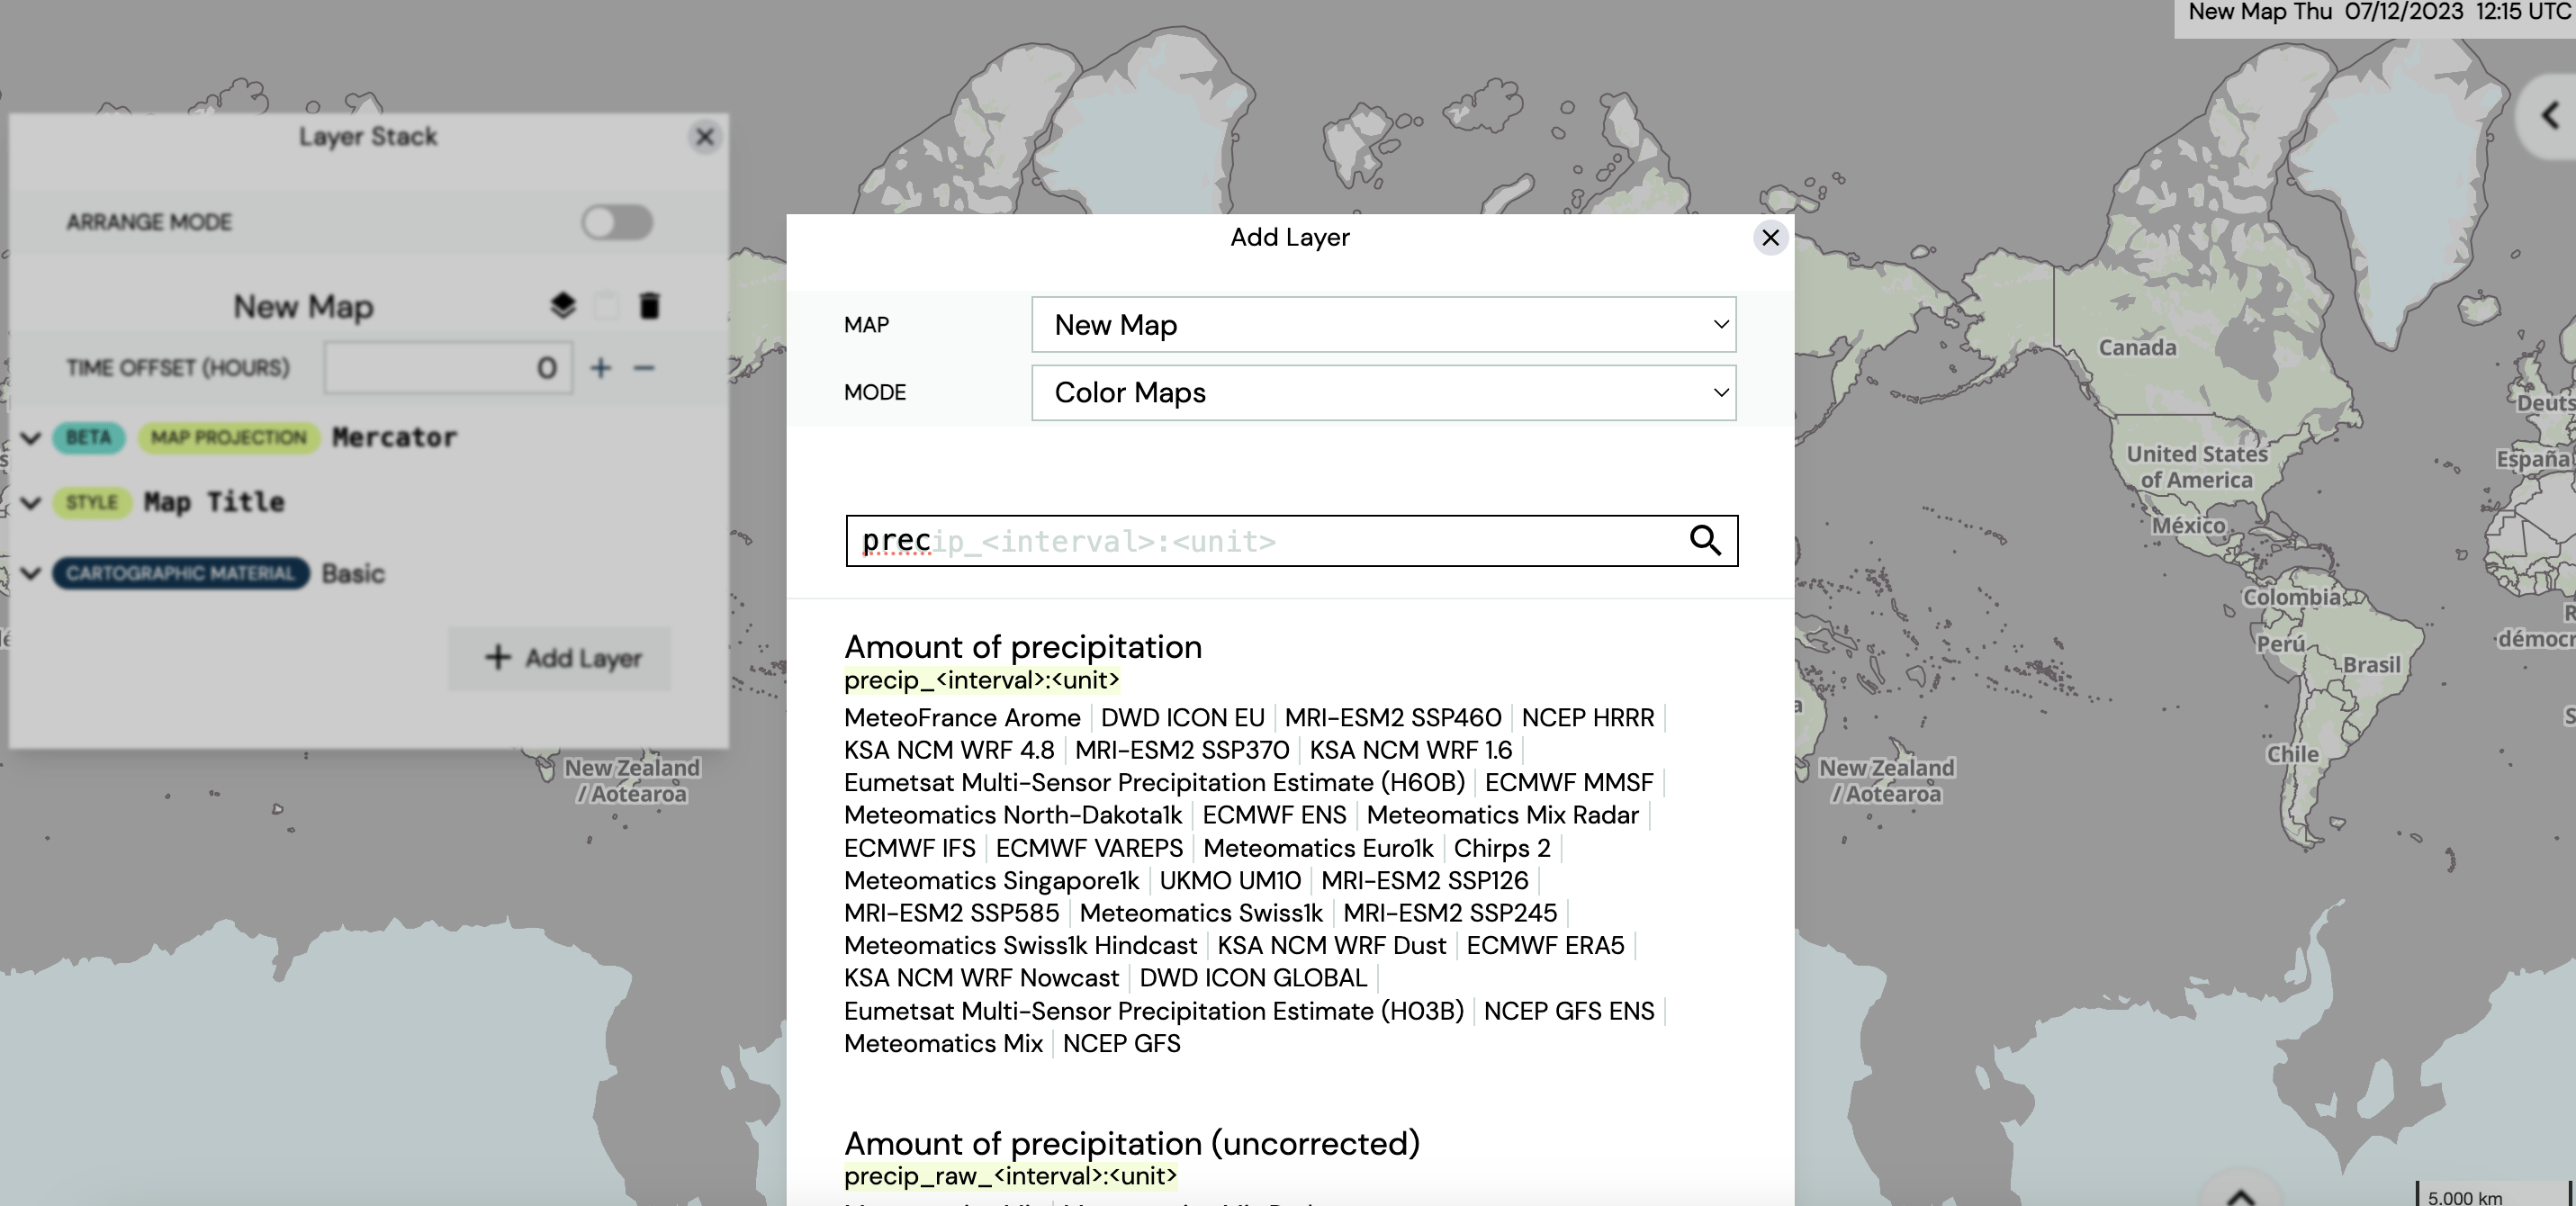
Select the parameter ”Amount of precipitation” at the very top by clicking on it. Now, you can specify the parameter properties (format, unit and interval).

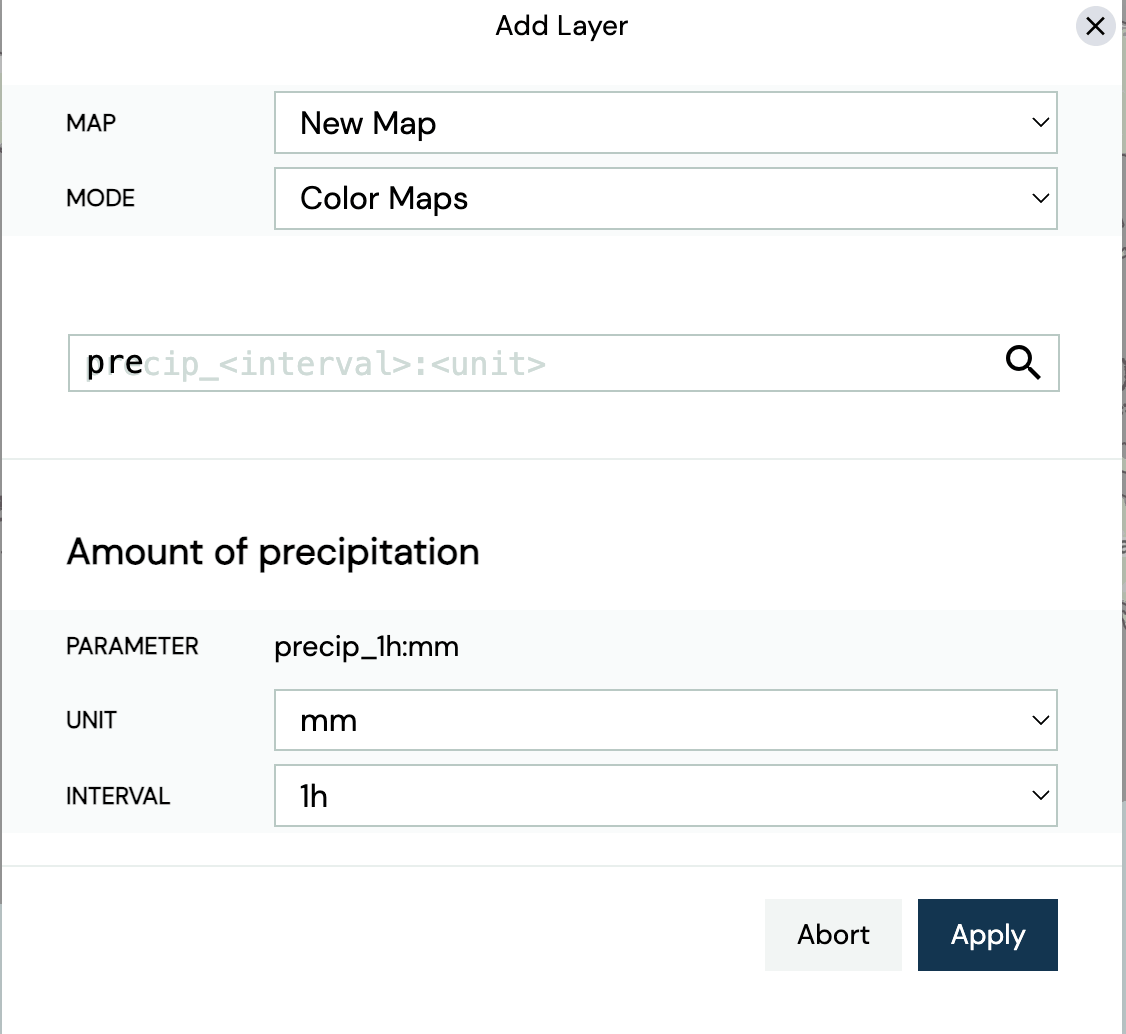

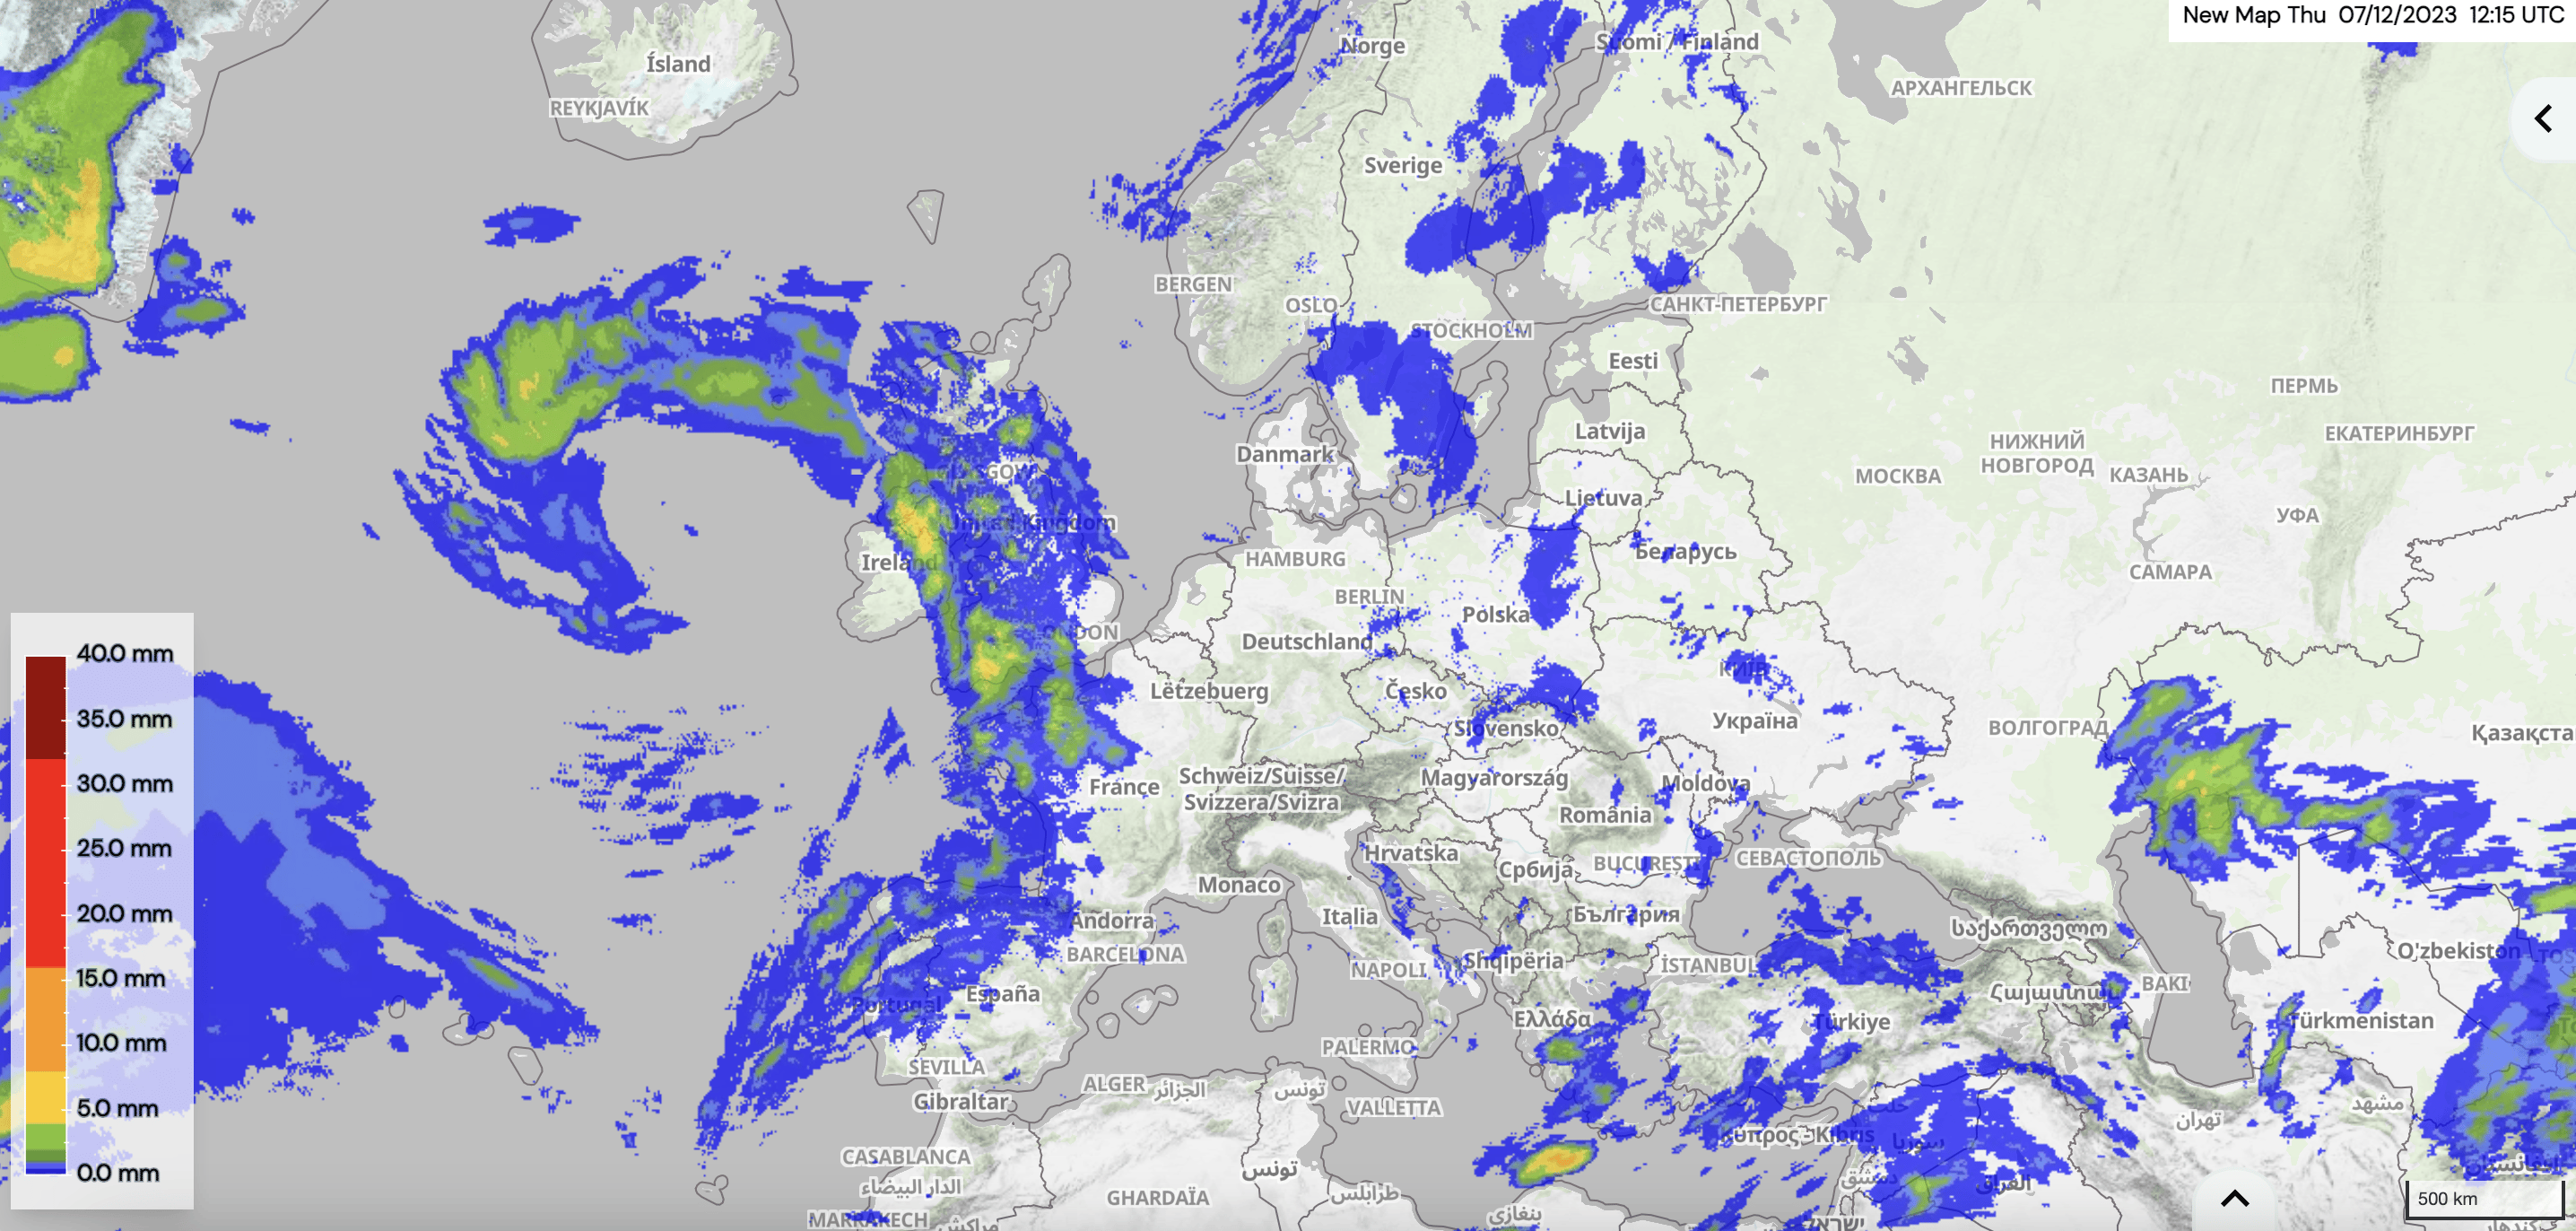
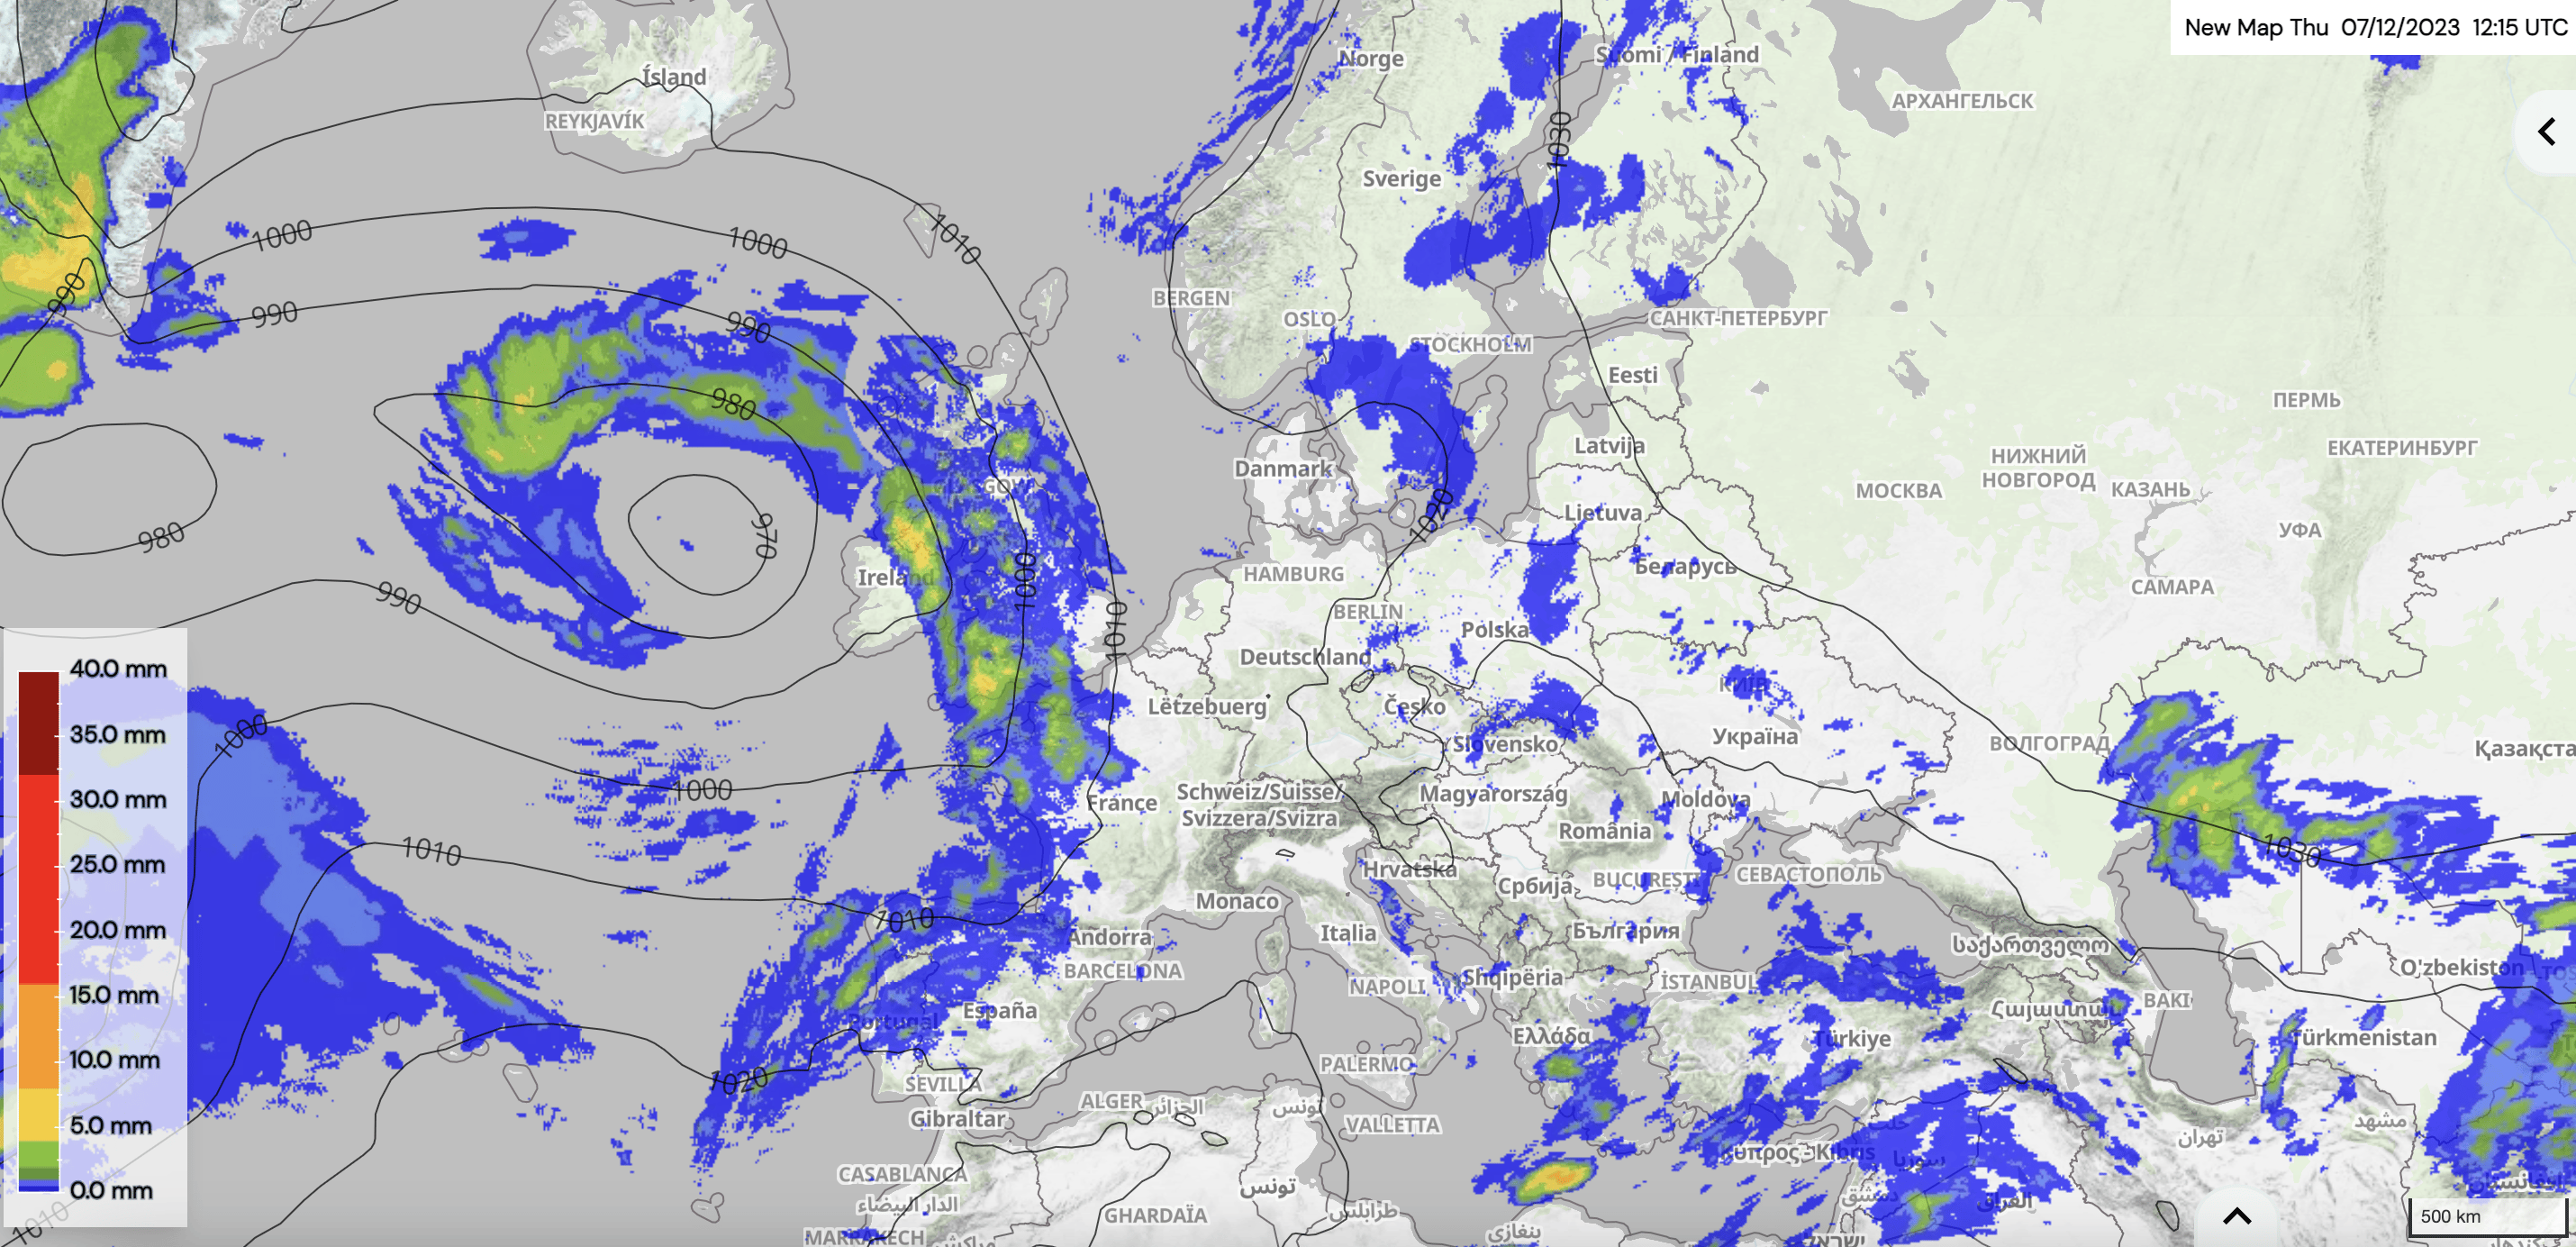
In this example, we choose for the precipitation the format ”precip_<interval>:<unit>”, the unit ”mm” and an interval of 1 hour. Thus, the amount of precipitation in the previous hour in mm is displayed after clicking the ”Apply” button. Your map looks now similar to the following:


The user can now change the colormap’s preferences by clicking on ”COLOR MAPS precip_1h:mm” on the Layer Stack (see section Colour Maps). In this example, we stick to the default values.
To insert a second parameter on the same map, click again on the ”Add Layer” button on the bottom right of the Layer Stack. Select ”Isolines” as ”MODE” and type ”msl” in the ”Search for weather parameters” box to add pressure isolines to the map (see section Isolines).

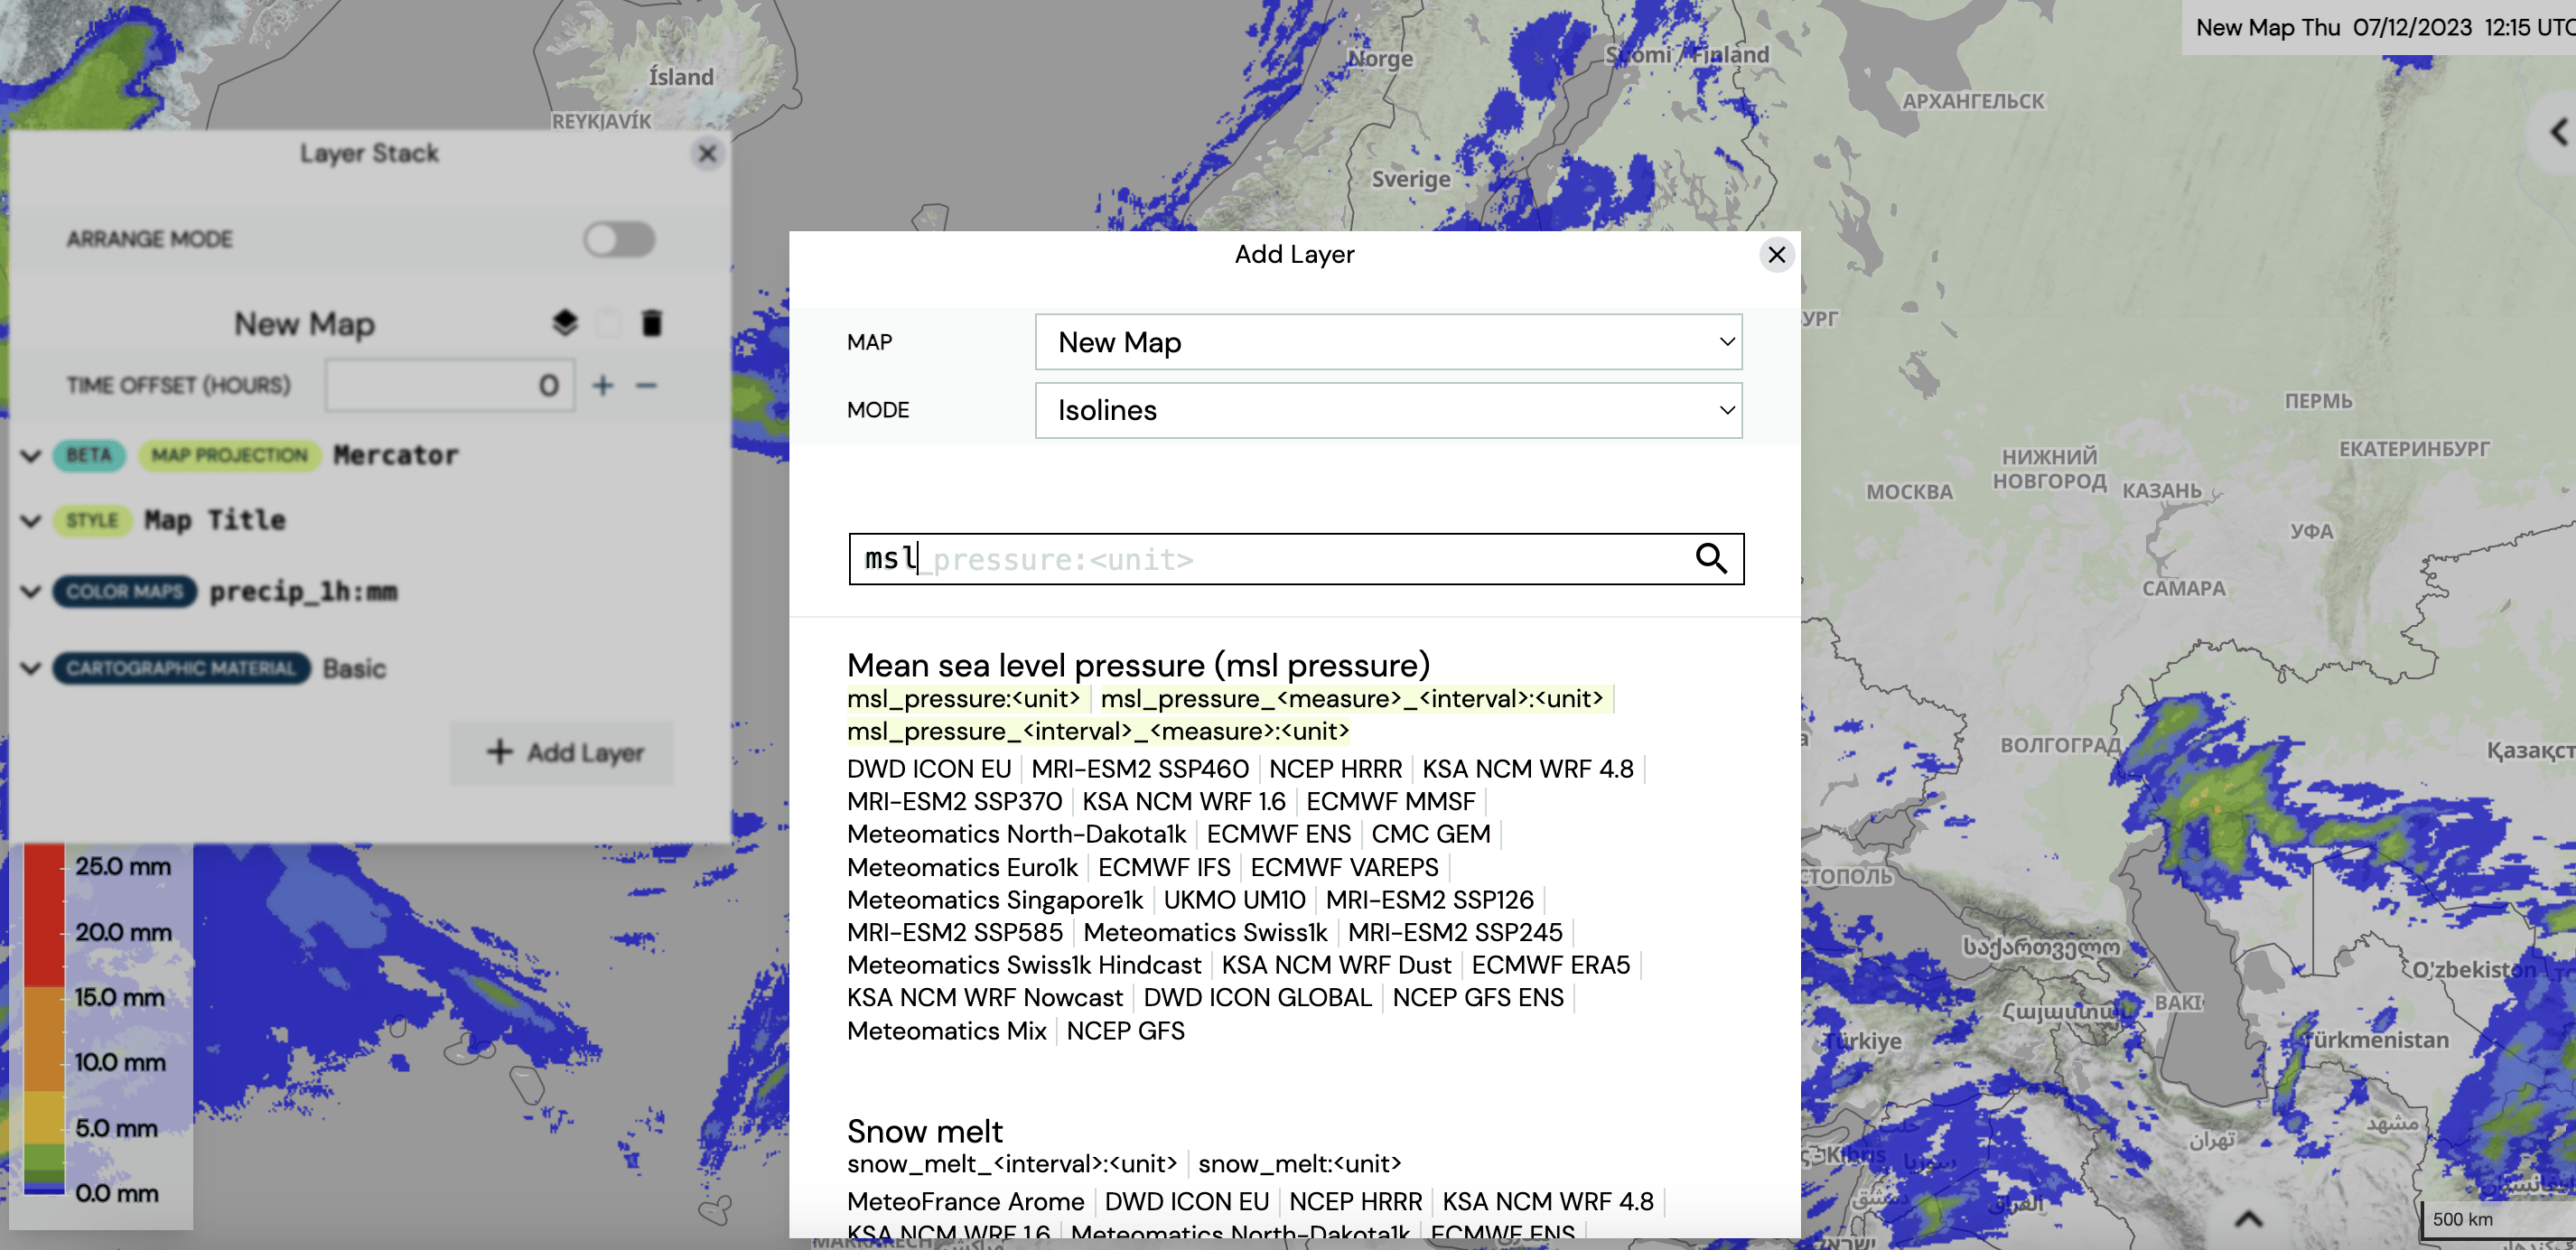

Select the parameter ”Mean sea level pressure” at the very top by clicking on it and specify the parameter properties (format and unit).

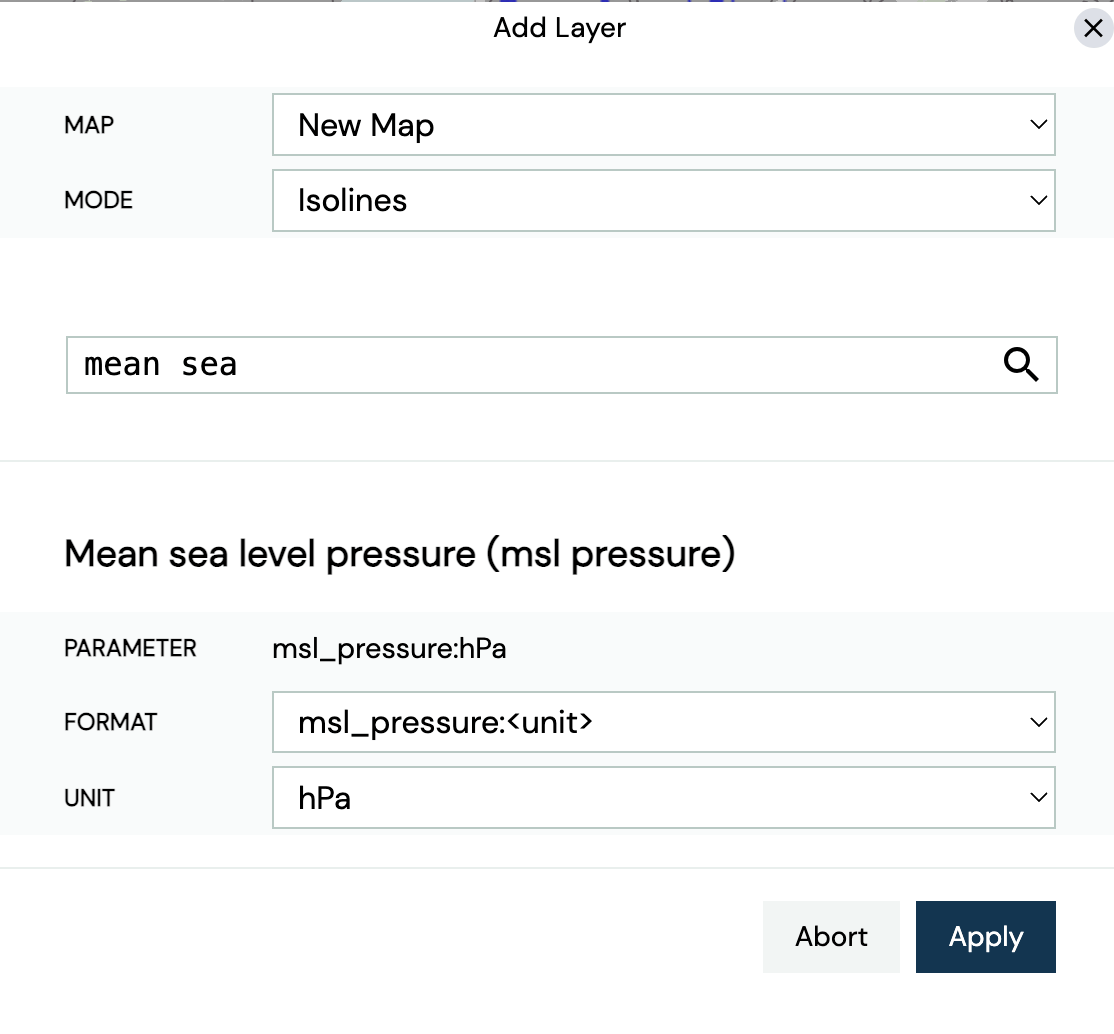

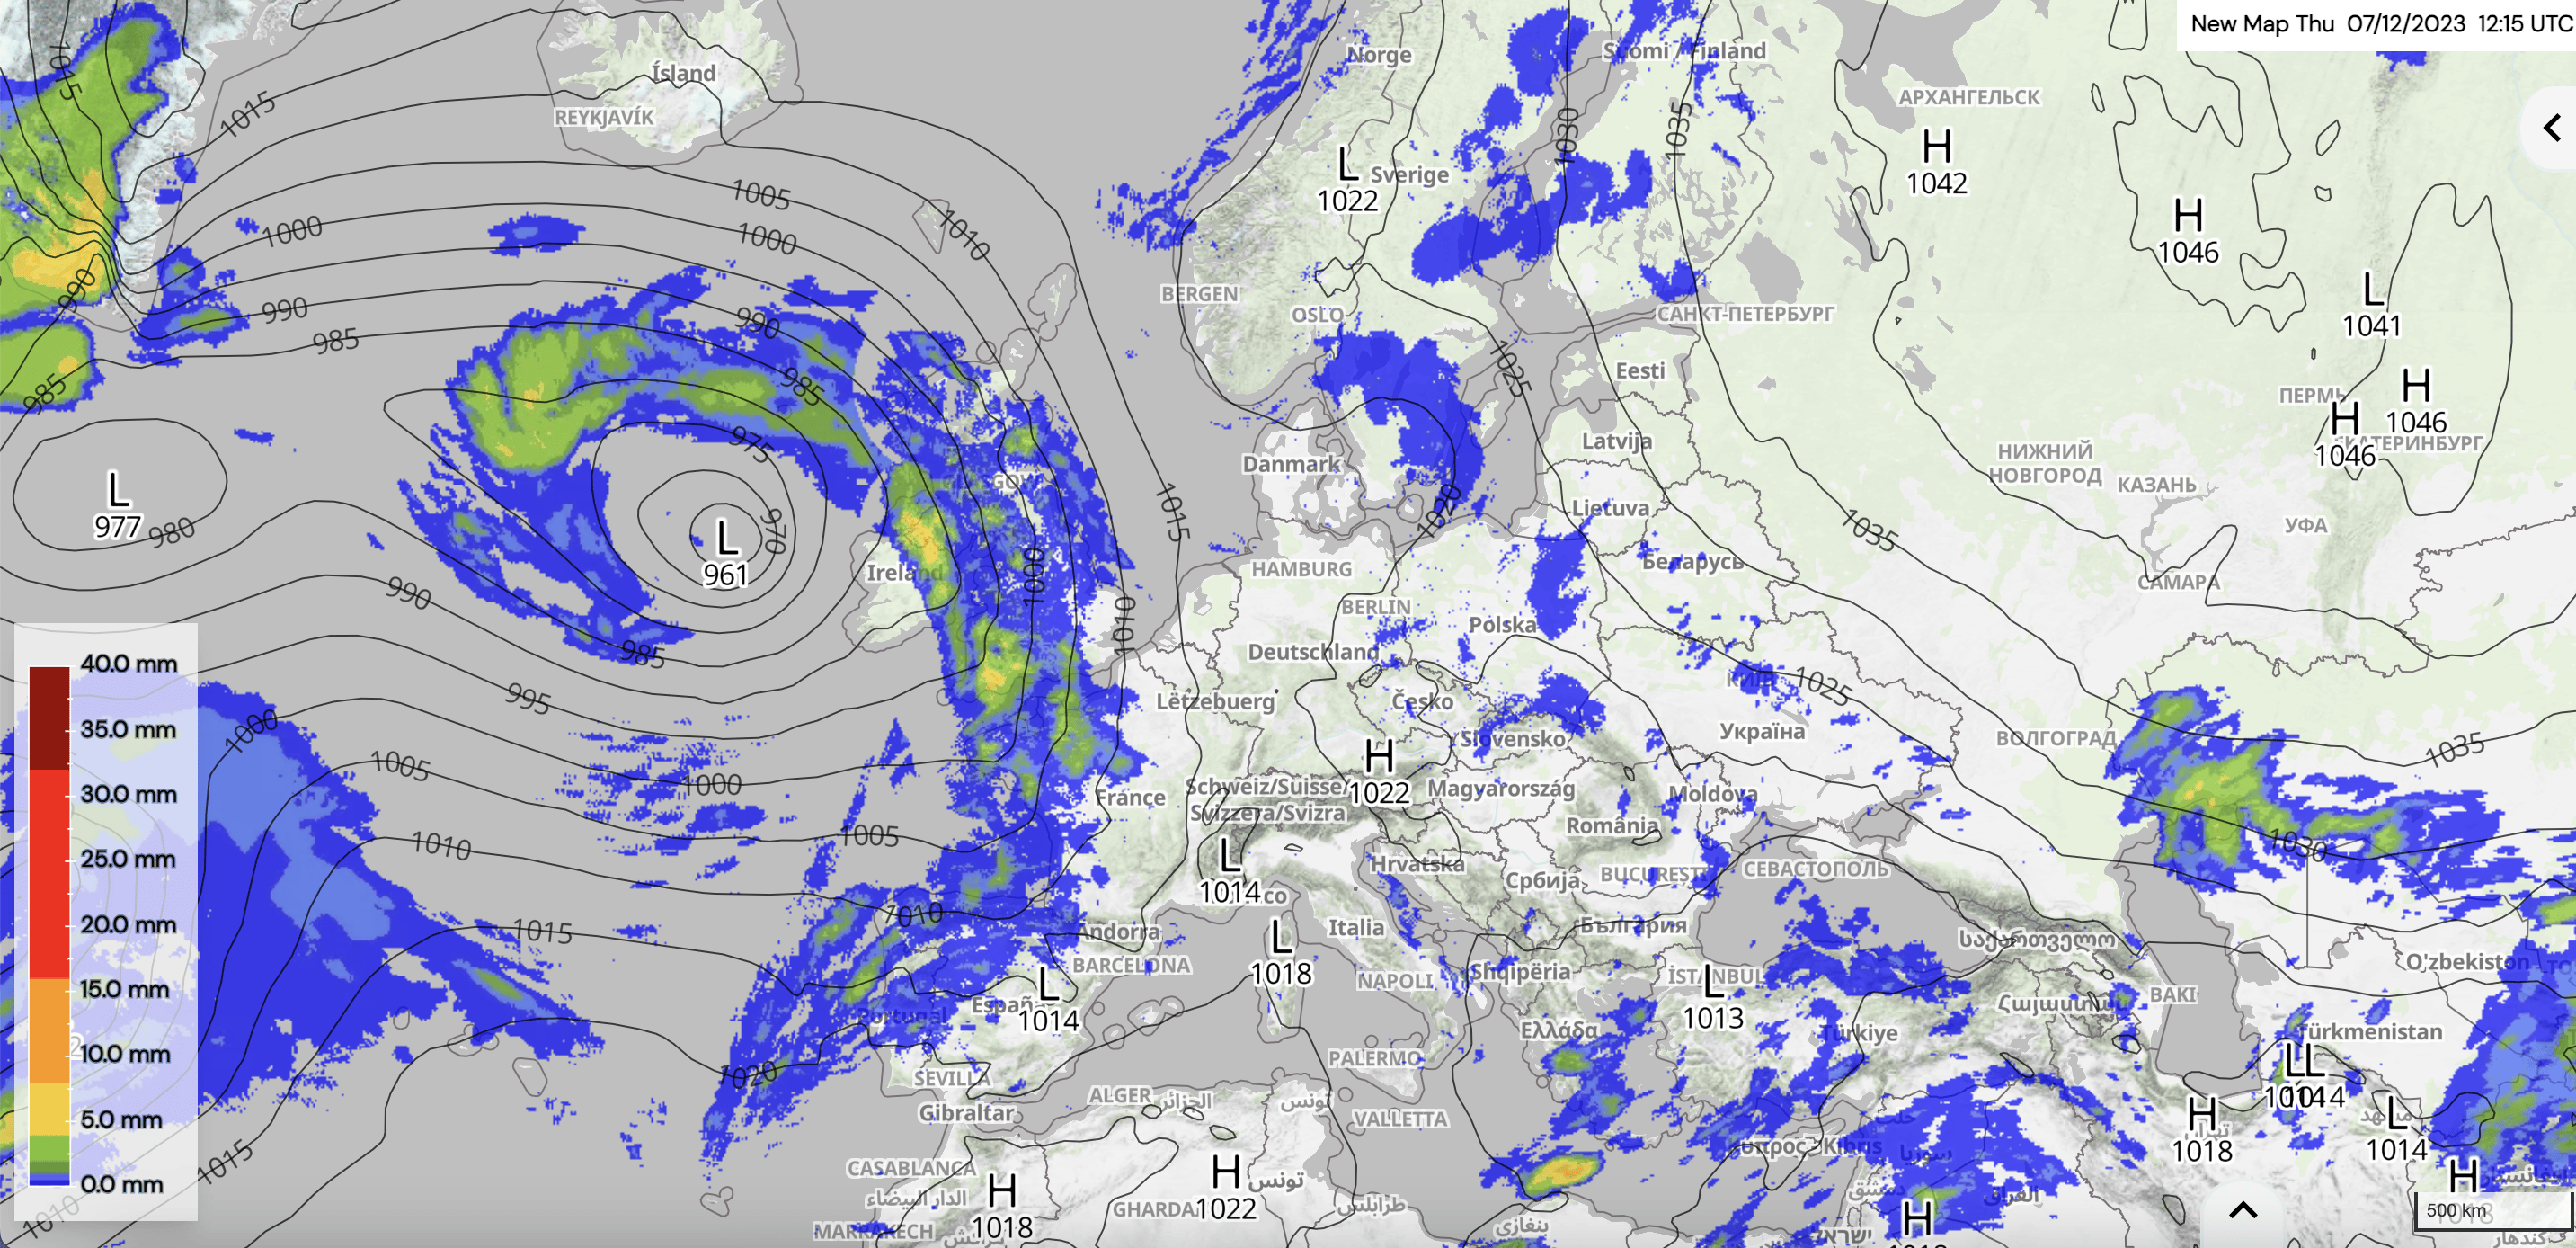
In this example, we choose for the pressure the format ”msl_pressure:<unit>” and the unit ”hPa”. Thus, the mean sea level pressure in hPa is displayed as isolines after clicking the ”Apply” button. Your map looks now similar to the following:


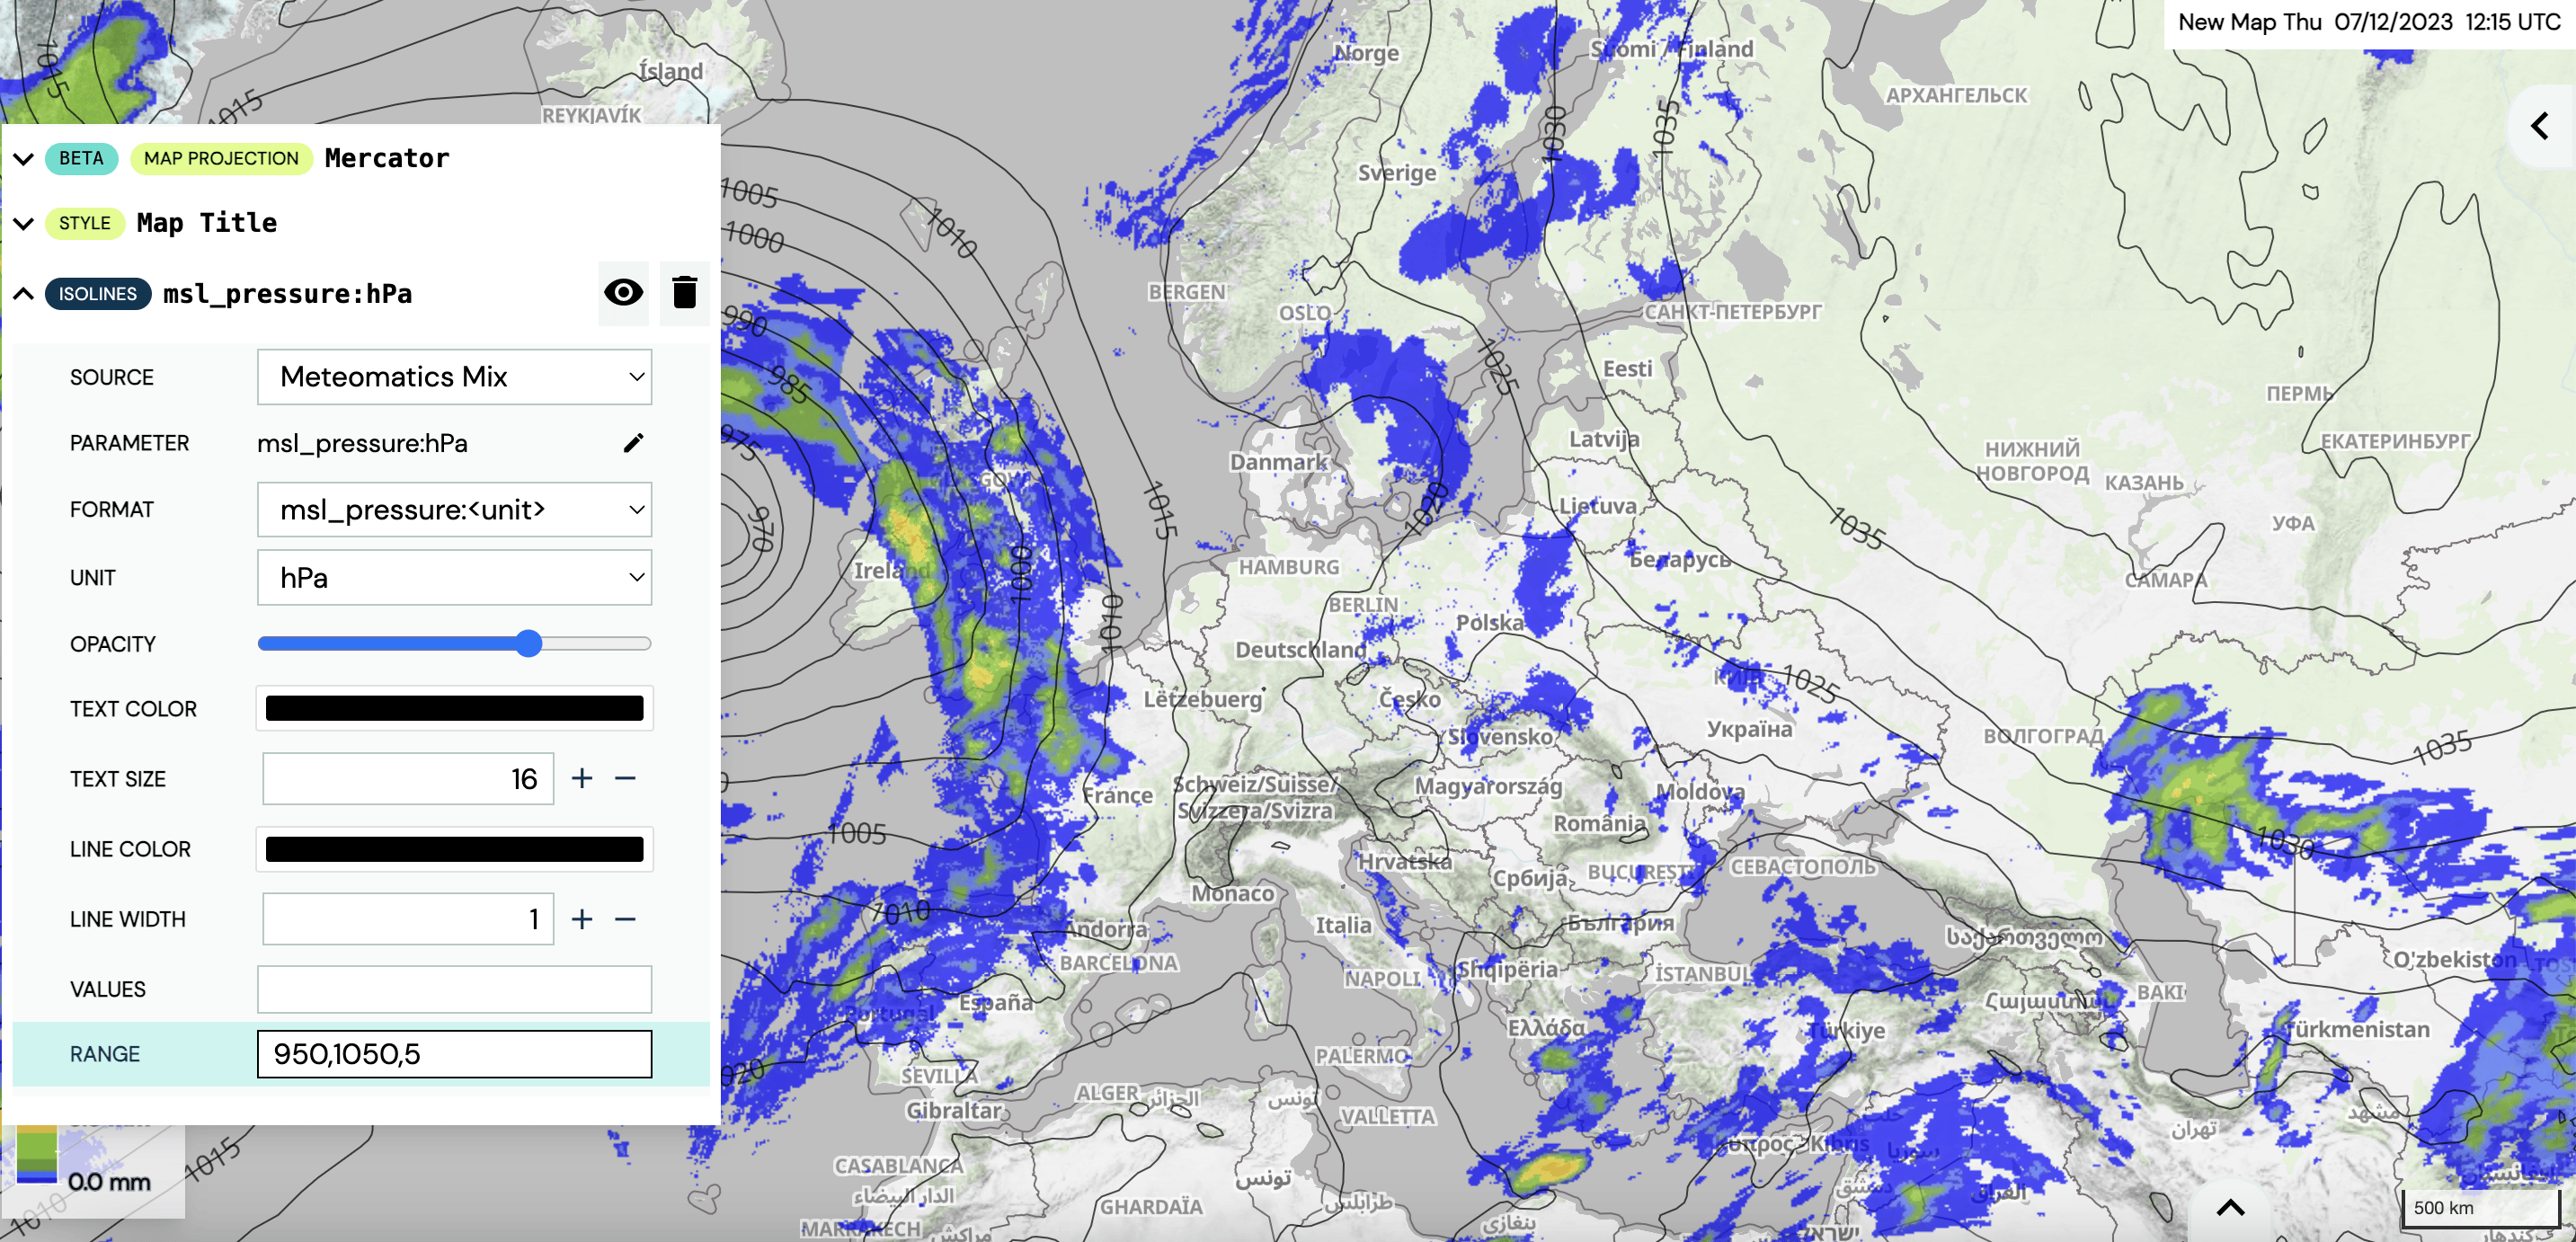
To change the preferences for the mean sea level parameter, click on the Layer Stack on ”ISOLINES msl_pressure:hPa”. We would like to change the displayed range and spacing of the isolines. Thus, type the minimum, maximum and the step in the ”RANGE” box. We choose a minimum of 950 hPa, a maximum of 1050 hPa and a step of 5 hPa (see section Isolines).


To add the symbols ”L” and ”H” in the center of the pressure systems, click on the ”Add Layer” button on the bottom right of the Layer Stack. Select ”Pressure System” as ”MODE” and specify the format and unit.

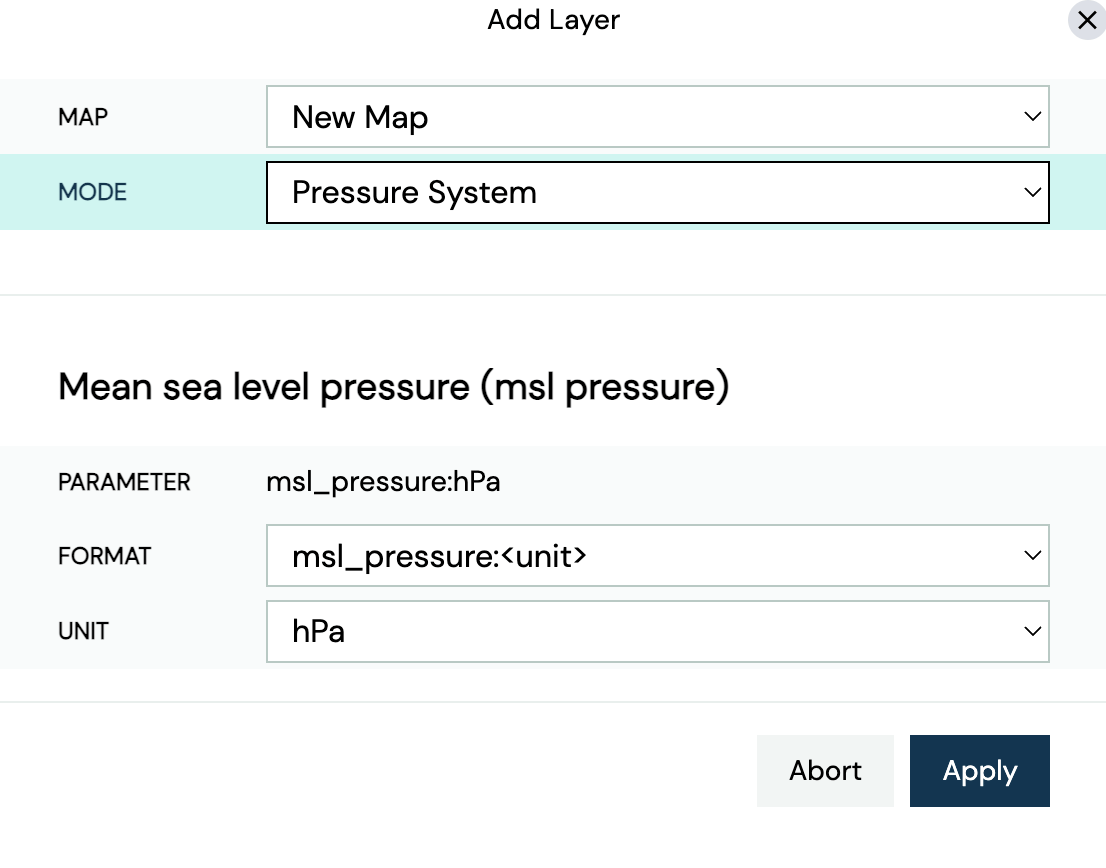
In this example, we chose ”msl_pressure:<unit>” and the unit ”hPa”. Click on ”Apply” to add the symbols to the map (see also section Pressure System).


If it is wished, the user can now change the preferences of the pressure system by clicking on ”PRESSURE SYSTEM msl_pressure:hPa” on the Layer Stack (see section Pressure System). In this example, we stick to the default values.
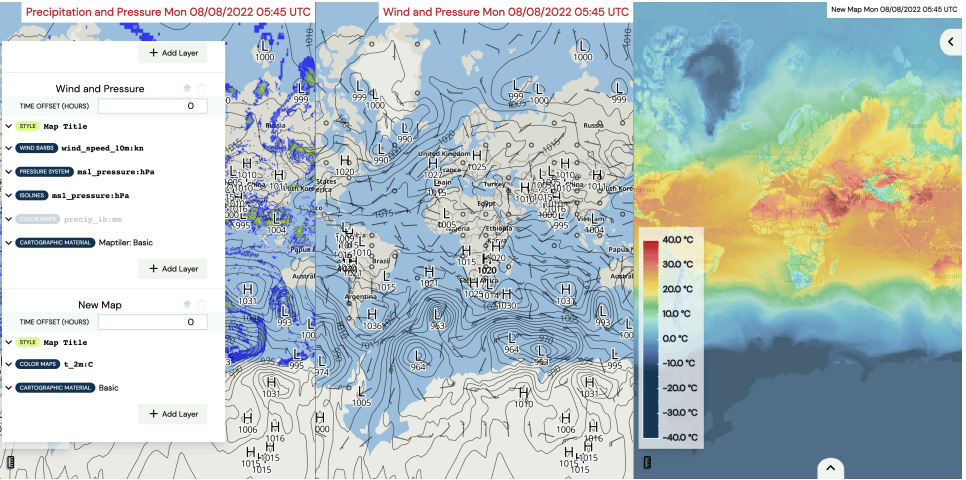
To change the underlying cartographic map, click on the Layer Stack on ”CARTOGRAPHIC MATERIAL Basic” and select a ”BASEMAP” (see section Cartographic Material). In this example, we choose the ”Maptiler: Basic” as ”BASEMAP”. Your map looks now similar to the following:


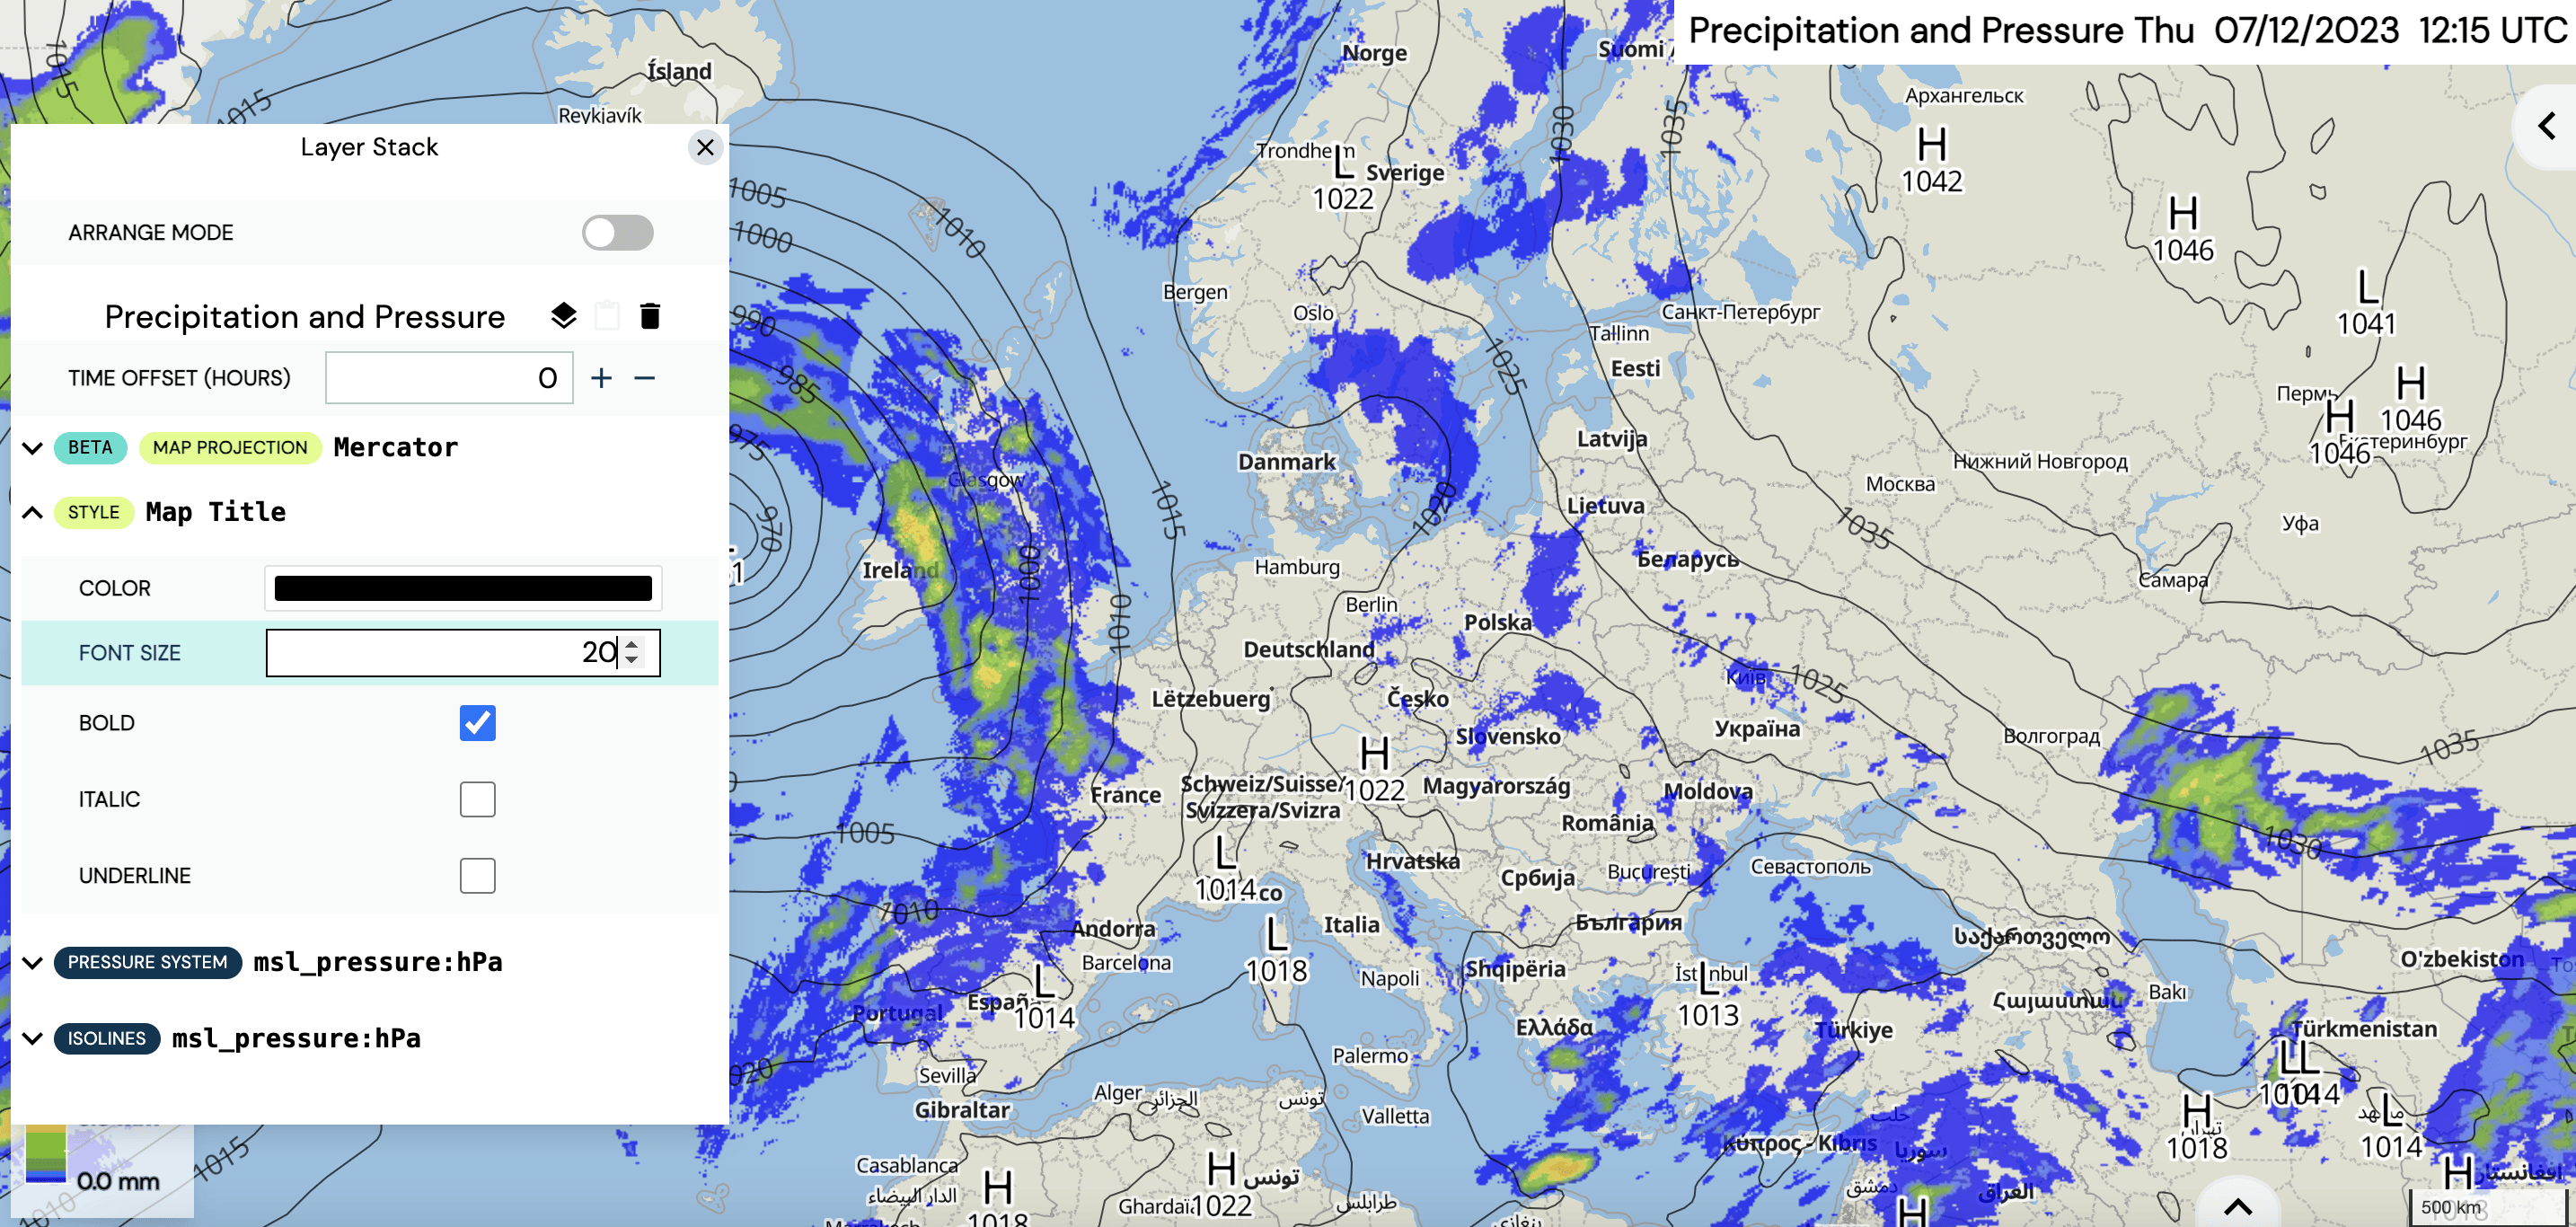
Now, we would like to rename the created map. Click on ”New Map” at the top of the Layer Stack and insert a title for your map e.g. ”Precipitation and Pressure”. The design of the map title can be adapted by clicking on ”STYLE Map Title” on the Layer Stack (see section Map title design). You can change the color of the title e.g. to red, change the font size e.g. to 20 and check the box for a bold title. The resulting map looks similar to:


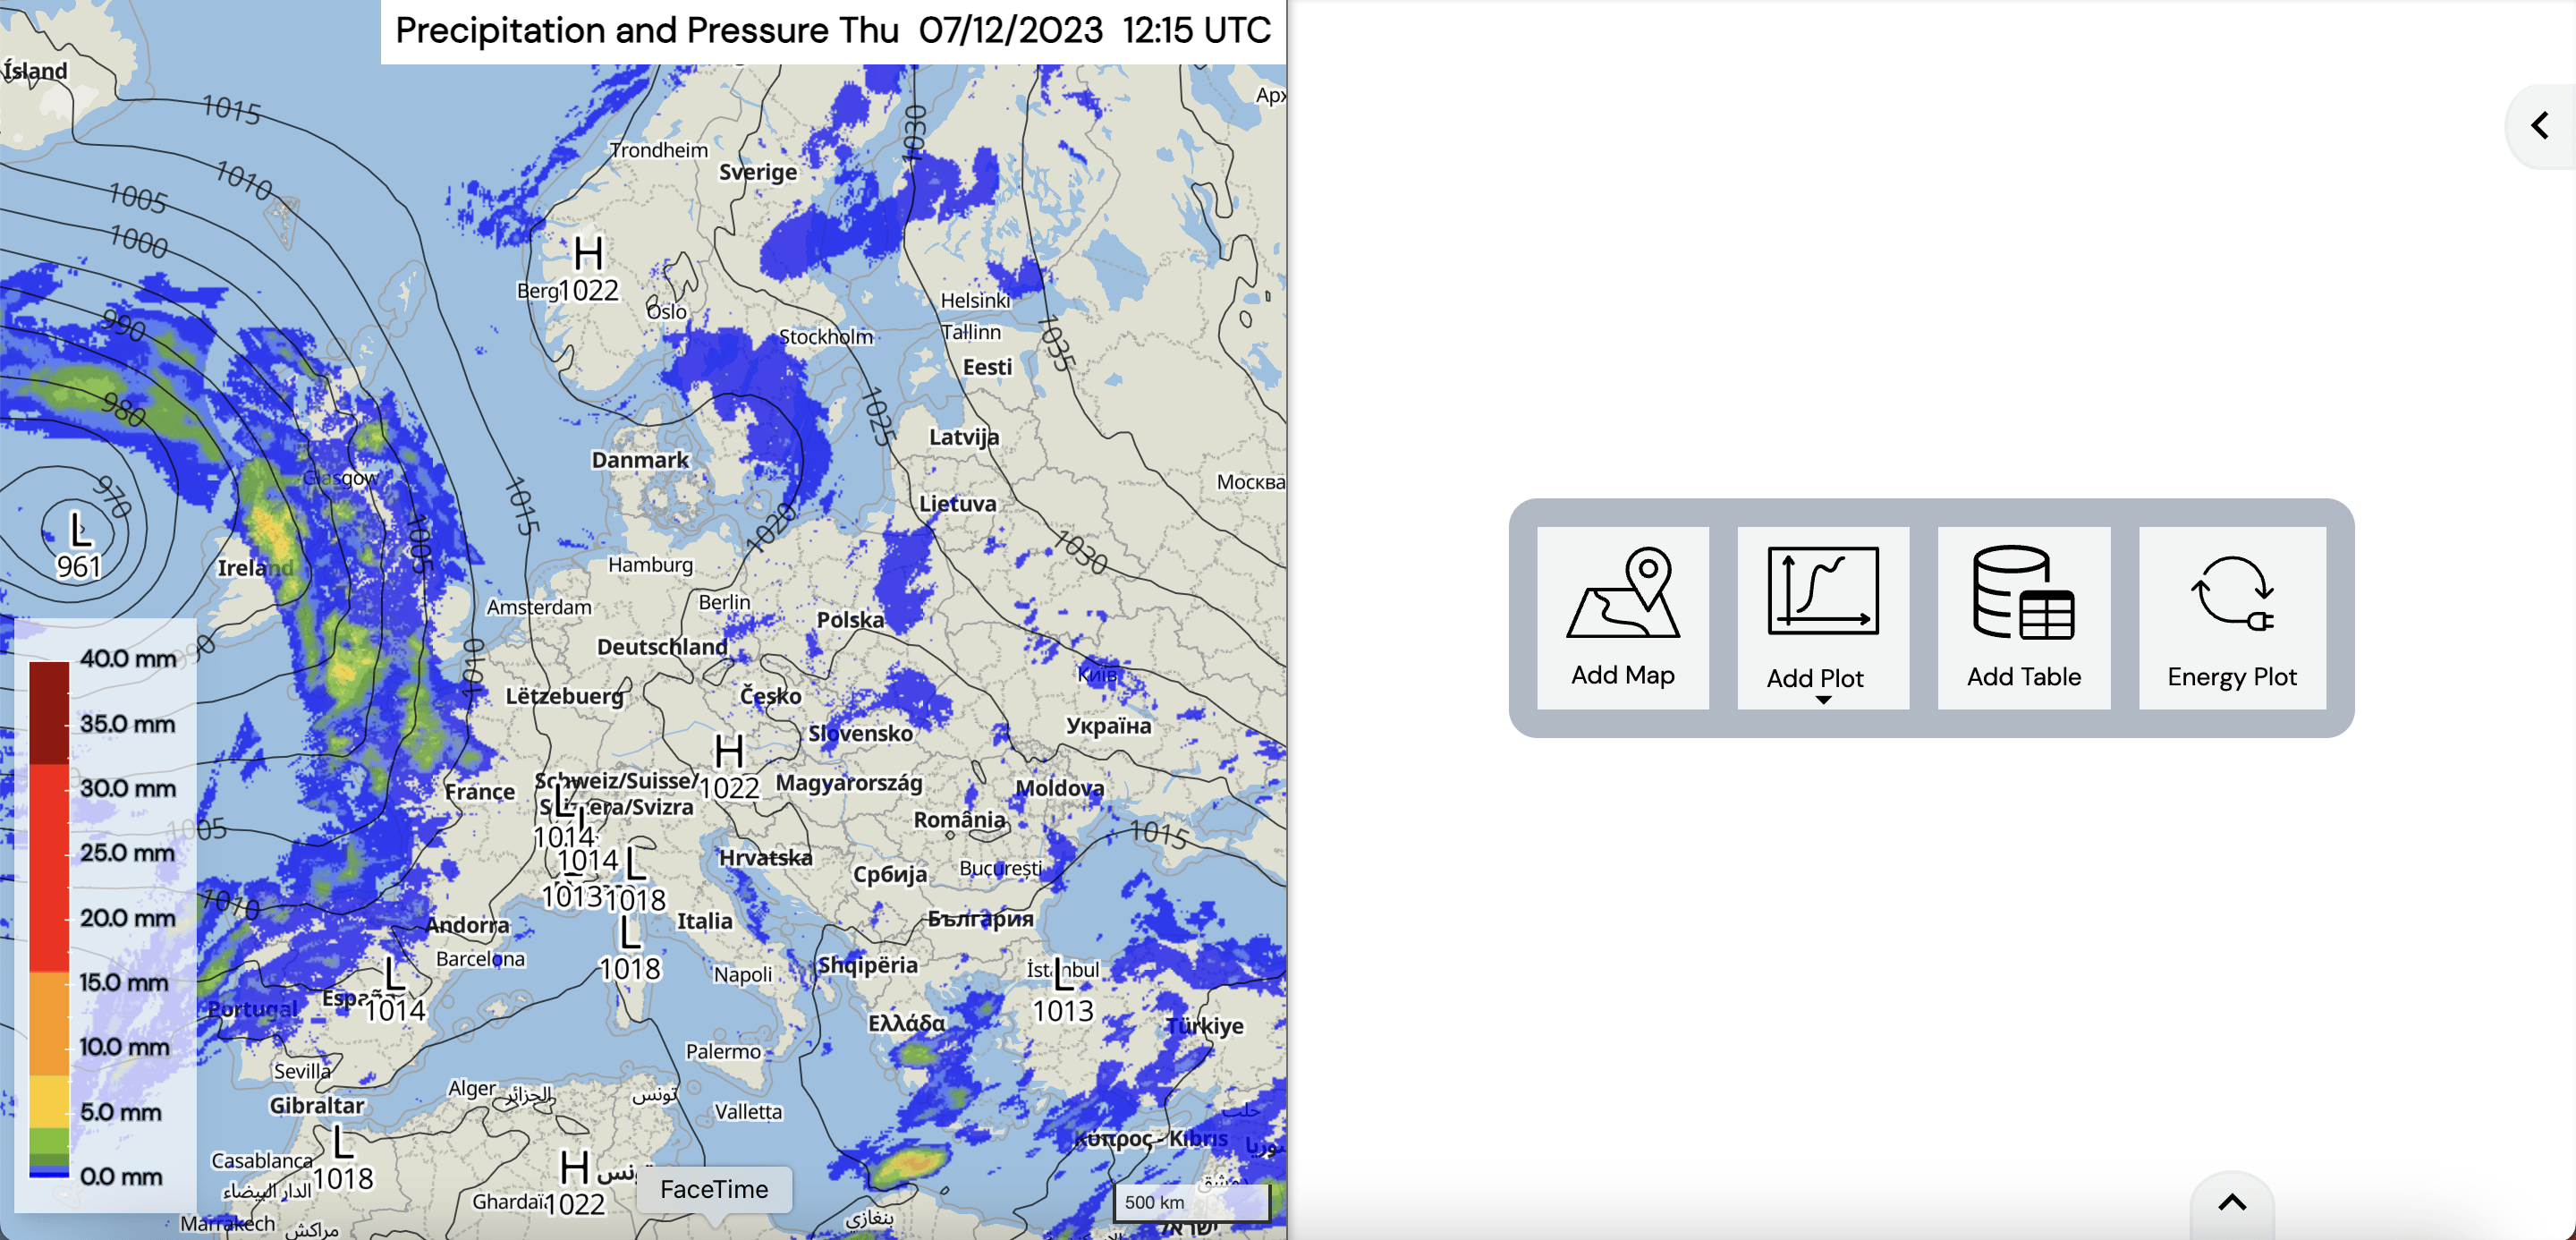
Next, we want to insert a second map. Therefore, click on to change the general tab settings. Click the second option at the top to get two maps next to each other (see also section Tab Layout). Set the ”MAP SYNC” to ”On” and click the ”Add Map” icon.


To add parameters on the second map, click on to open the Layer Stack. On the top of the Layer Stack the displayed parameters of the left map and on the bottom the displayed parameters of the right map are shown. To check which map you are currently adjusting, a turquoise frame appears around the map or plot that belongs to the respective map on the Layer Stack.
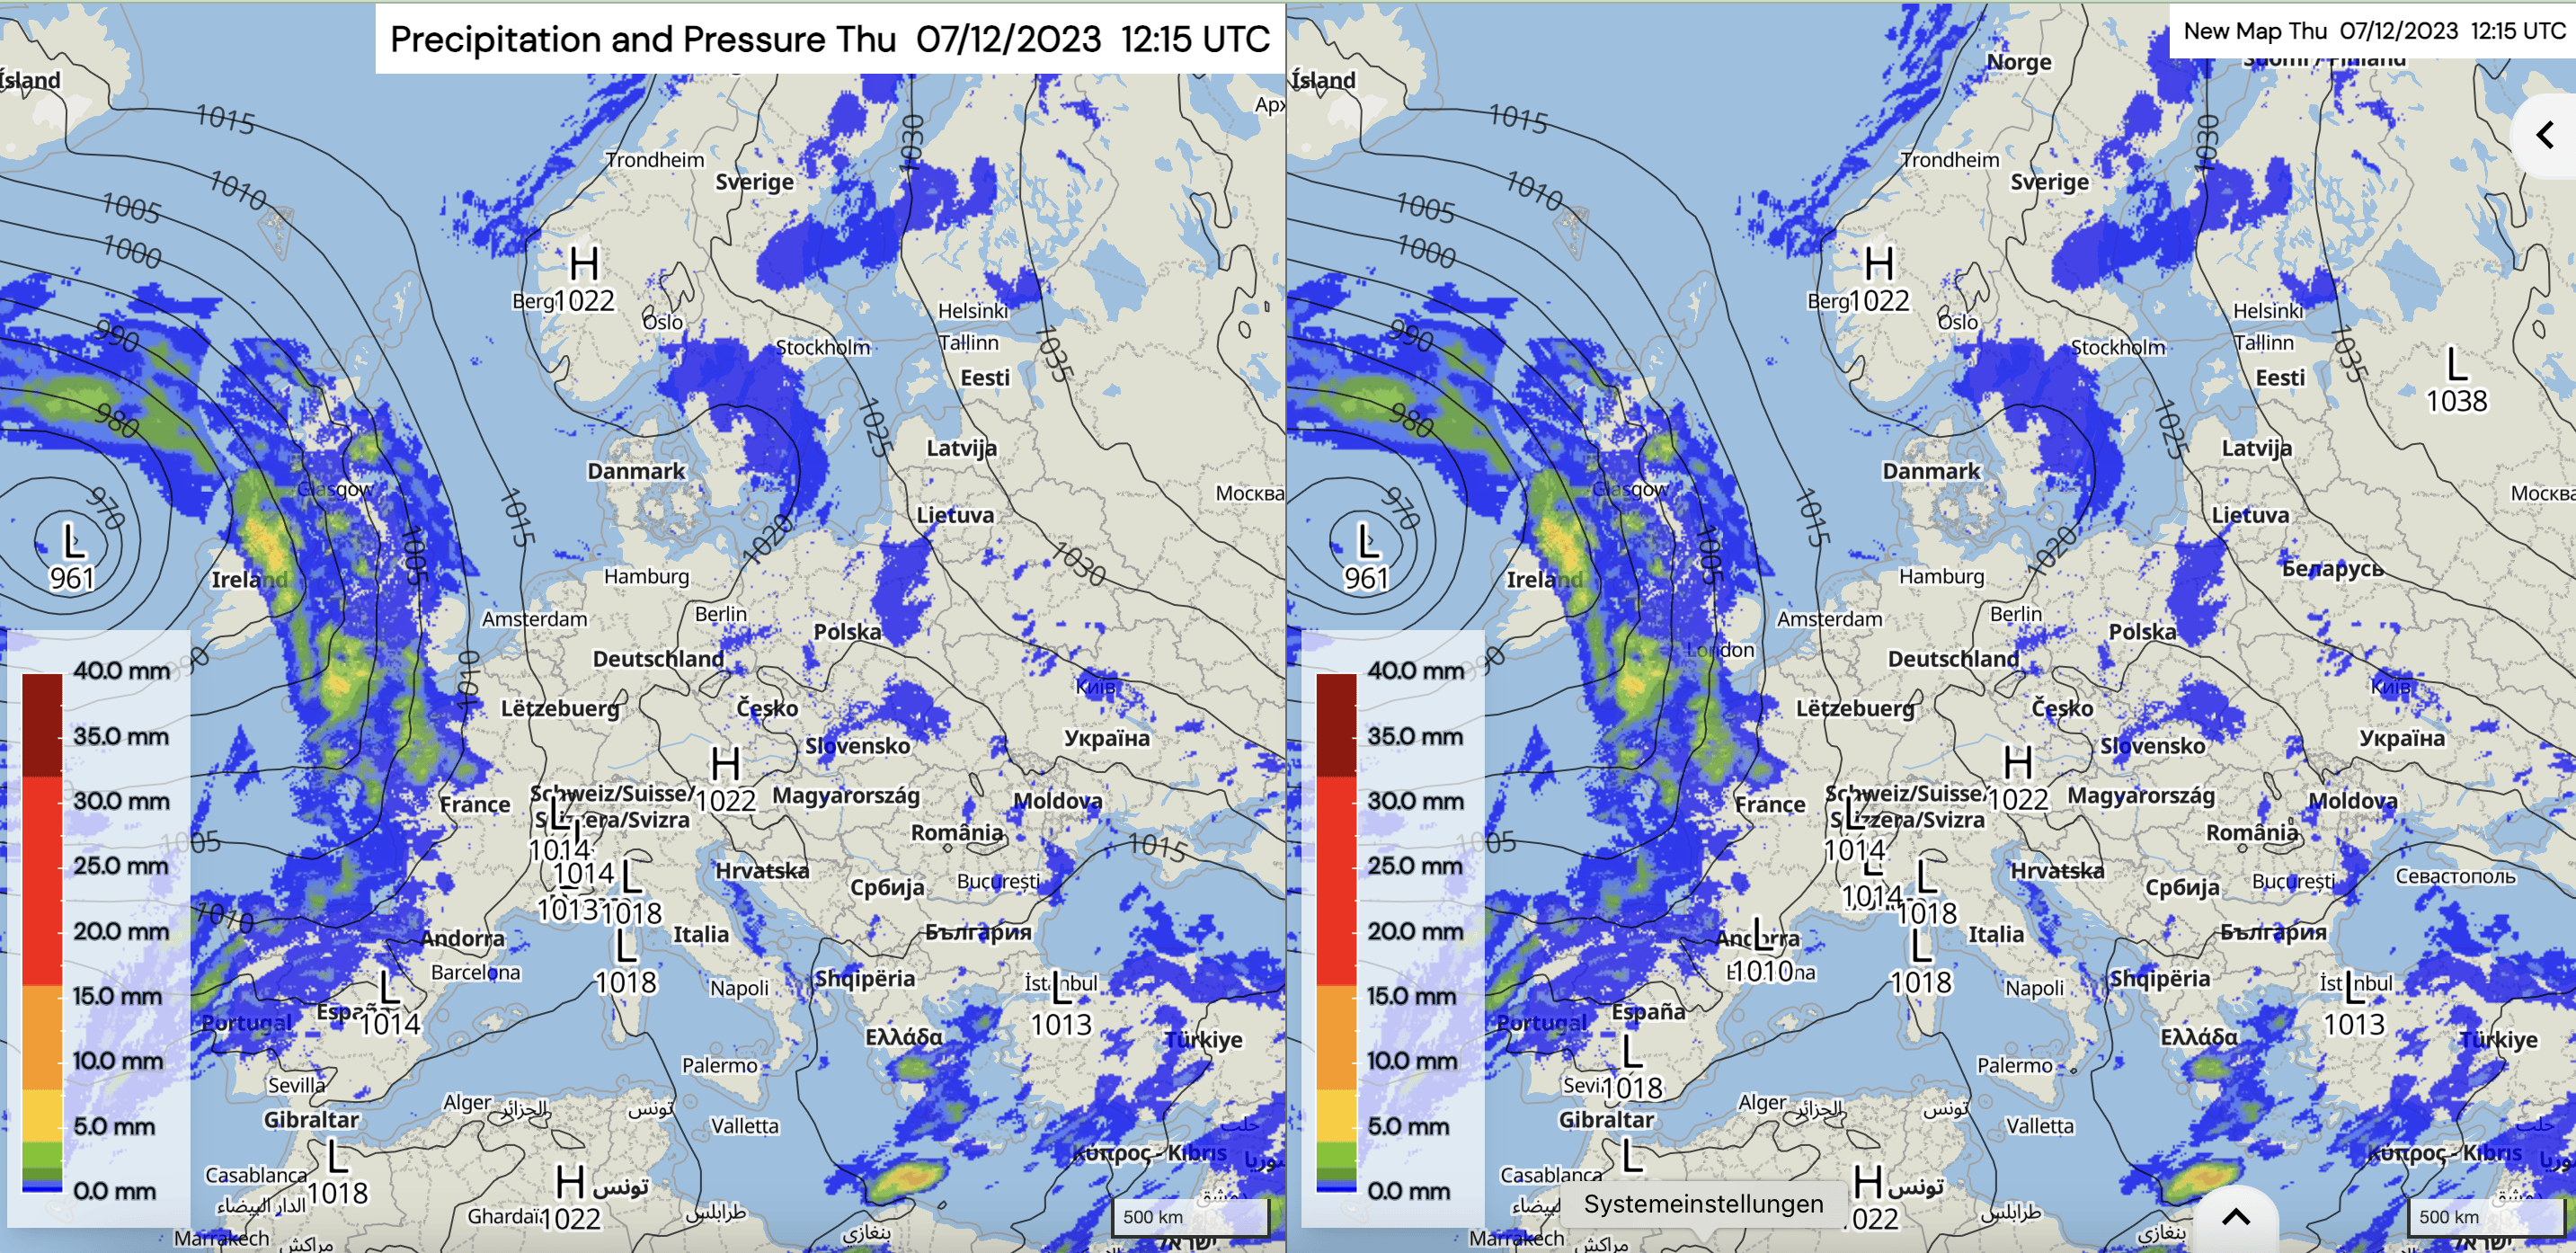
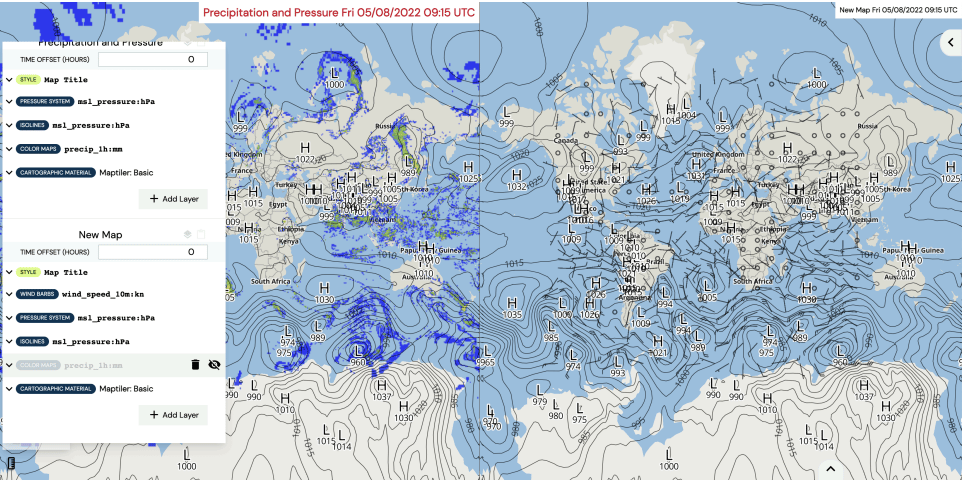
A faster way to add the parameters on the second map is to copy the parameters from the first map and paste them on the second map (see section Copy/Paste/Delete layers). Click on on top of the Layer Stack next to the title ”Precipitation and Pressure” to copy the parameters. Insert the parameters on the second map by clicking next to the ”New Map” title on the Layer Stack. Your screen looks now similar to the following:


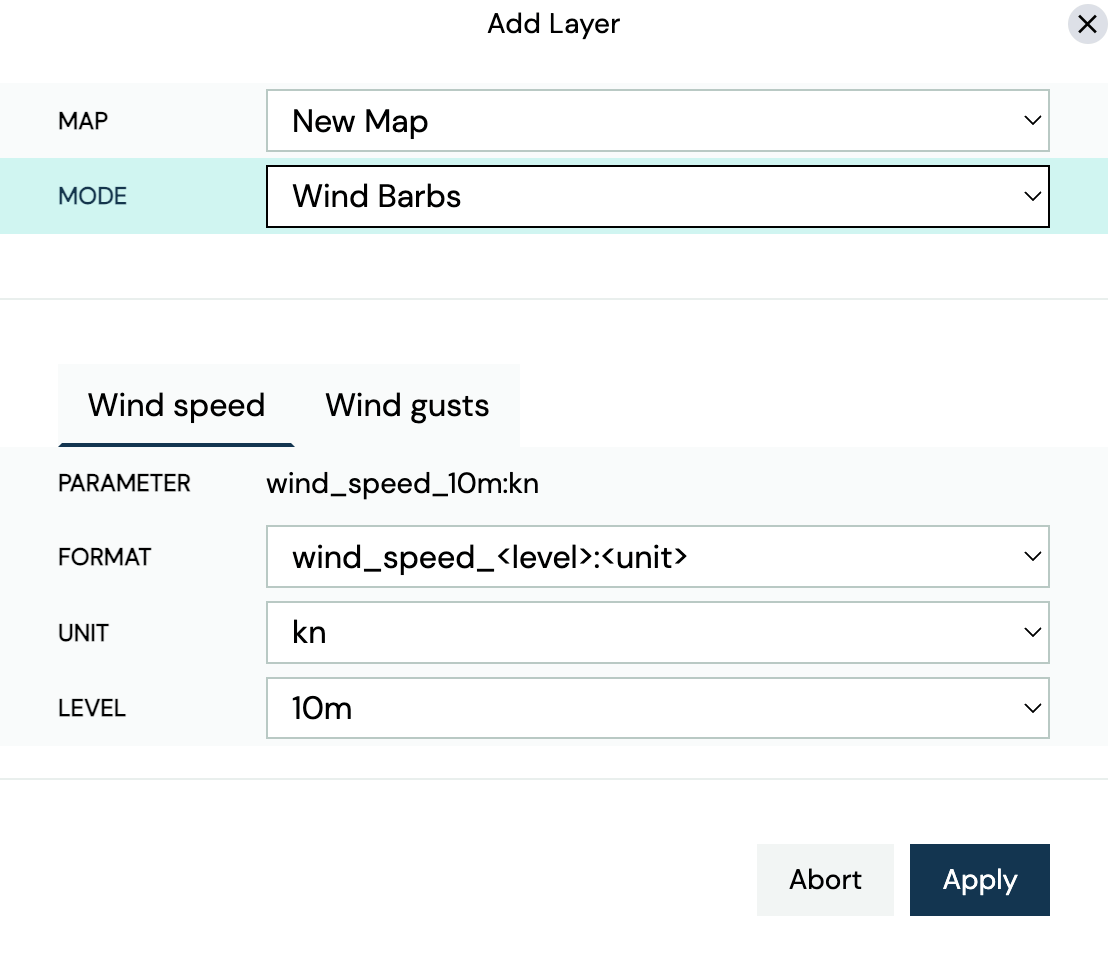
We would like to replace the precipitation by wind barbs. Therefore, click on ”Add Layer” (see section Wind and Wave Barbs). Select ”Wind Barbs” as ”MODE” and specify the format, unit and level. In this example, we choose ”wind_speed_<level>:<unit>” as format, ”kn” as unit and ”10m” as level.


After clicking the ”Apply” button, the wind barbs 10 meters above ground are displayed on the second map. The precipitation can either be deleted from the Layer Stack or made invisible. To delete the parameter click on the trash icon next to ”COLOR MAPS precip_1h:mm” on the Layer Stack. To make the precipitation parameter invisible click the eye icon next to ”COLOR MAPS precip_1h:mm” on the Layer Stack. In this example, we keep the precipitation parameter but do not display it on the second map. Your screen looks now similar to the following:


Again, you can replace the title of the second map by clicking on ”New Map” on the Layer Stack and typing e.g. ”Wind and Pressure” in the box. And you can adapt the design of the title by clicking ”STYLE Map Title” on the Layer Stack (see section Map title design).

Let’s add a last map to complete our weather overview with a temperature chart. Click on the tab setting icon to change the general tab settings. Click the second option at the bottom to get three maps next to each other (see also section Tab Layout). Set the ”MAP SYNC” to ”On” and click the ”Add Map” icon.
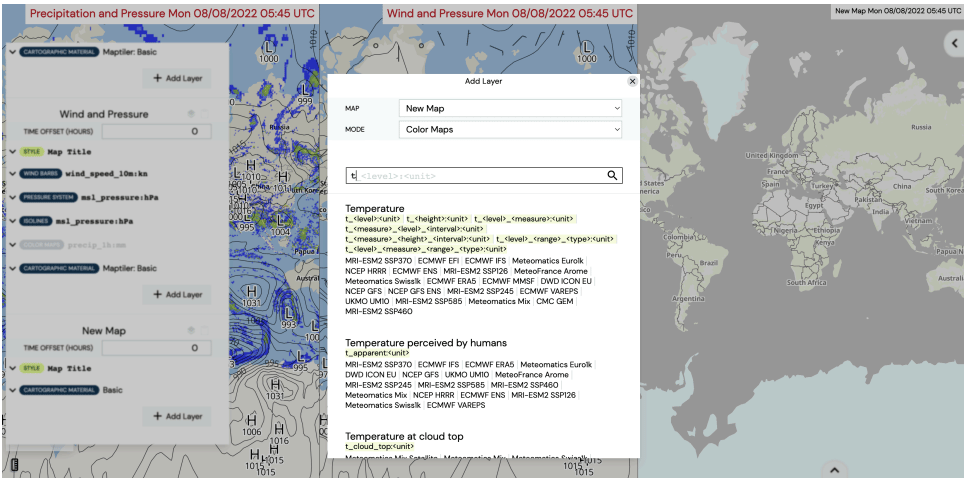
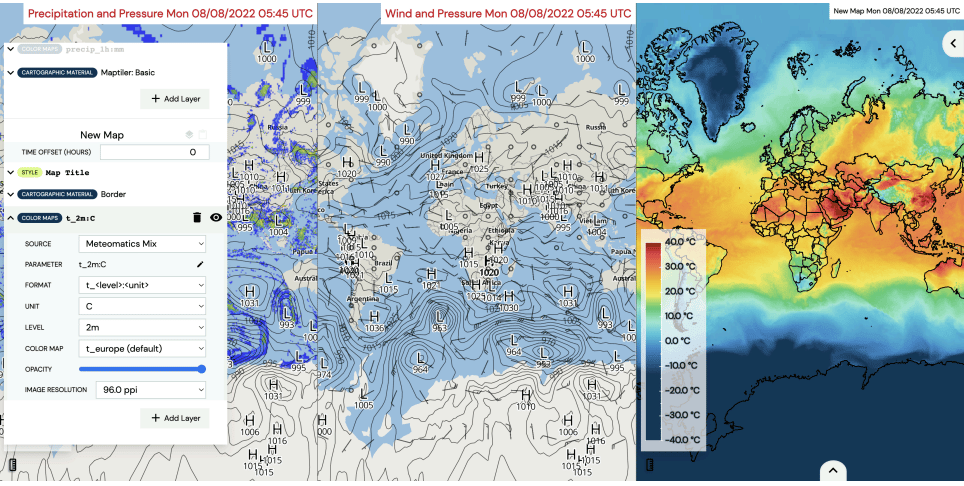
Again, to add parameters on the third map click on the Layer Stack icon to open the Layer Stack. On the top of the Layer Stack the displayed parameters of the left map, in the middle the displayed parameters of the middle map and on the bottom the displayed parameters of the right map are shown. You can check that by hovering the mouse on the parameters on the Layer Stack. The respective map is framed with a turquoise frame. Scroll down to the bottom on the Layer Stack to the ”New Map” to add the temperature on the third map. Click on ”Add Layer”. Select ”Color Maps” as ”MODE” and type ”t” in the ”Search for weather parameters”. Click on ”Temperature” at the very top of the suggested parameters.


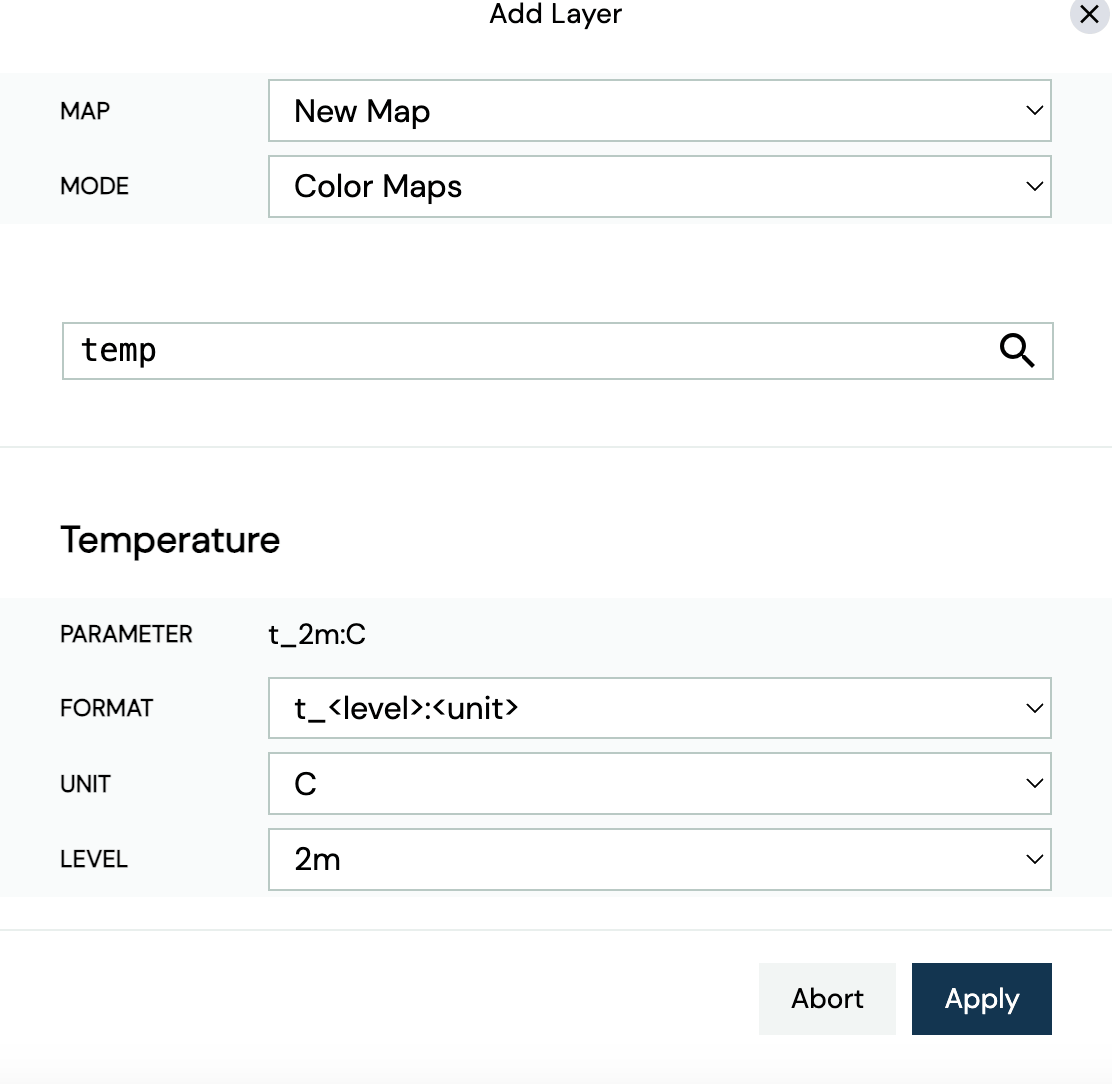
Now, you can specify the parameter properties (format, unit and level). In this example, we choose ”t_<level>:<unit>” as format, ”C” as unit and ”2m” as level to get the temperature 2 meters above the ground in °Celsius after clicking the ”Apply” button.


Your map looks now similar to the following:


If it is wished, the user can now change the preferences of the temperature by clicking on ”COLOR MAPS t_2m:C” on the Layer Stack (see section Colour Maps). In this example, we change the ”OPACITY” to 100% and for the rest we keep the default values.
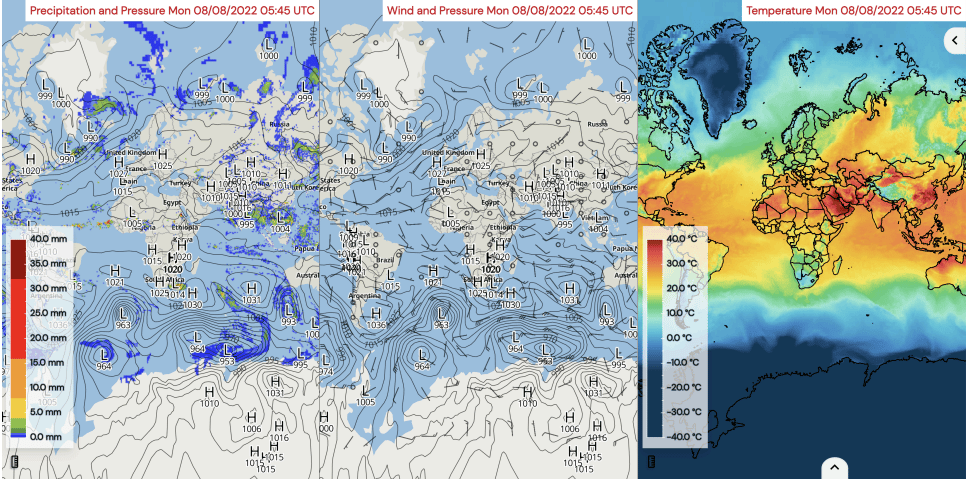
To change the underlying cartographic map, click on the Layer Stack on ”CARTOGRAPHIC MATERIAL Basic” and select a ”BASEMAP” (see section Cartographic Material). In this example, we choose the ”Border” as ”BASEMAP”. Also, you can put the cartographic map above the temperature parameter to make the bor- ders a bit more visible. Click on ”CARTOGRAPHIC MATERIAL Border” and pull it above the ”COLOR MAPS t_2m:C” on the Layer Stack Your map looks now similar to the following:


Change the title of the third map by clicking on ”New Map” on the Layer Stack and typing e.g. ”Temperature” in the box. Click the ”STYLE Map Title” on the Layer Stack to adapt the design of the title (see section Map title design). In this example, we choose the same setting as for the two other map titles.

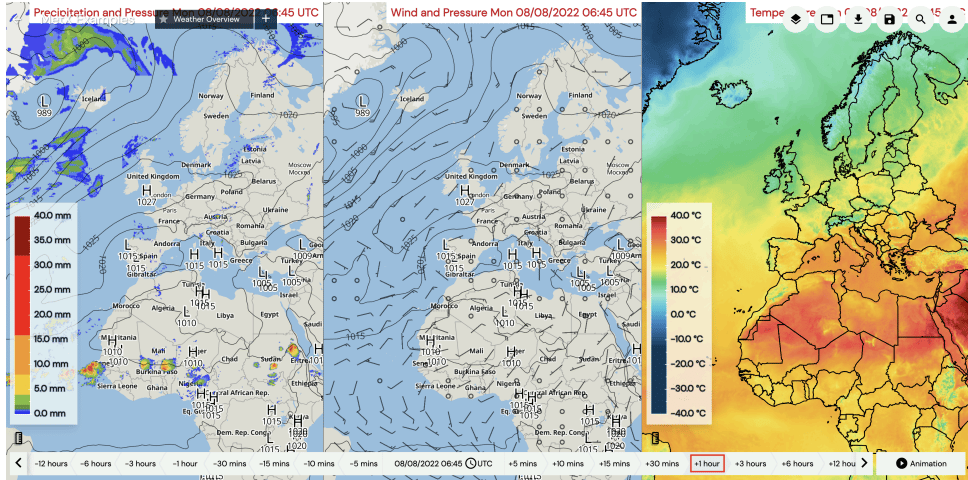
Your final three maps look now similar to the following:


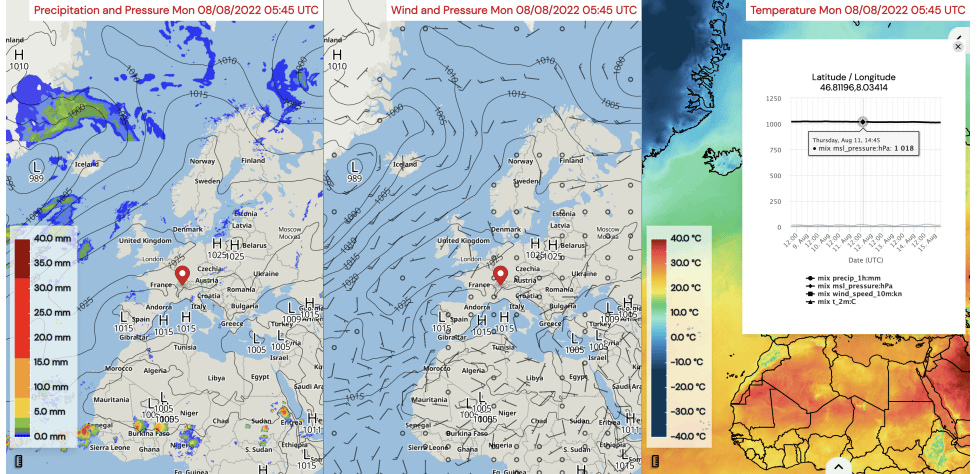
To have a closer look at a certain region, you can zoom in e.g. to Europe. Press and hold the left mouse button to change the map extend - scrolling in and out controls the level of zooming into a map. Due to the enabled ”MAP SYNC” all three maps show the same extend after zooming or moving the map.

Click on a specific location in the map to see the evolution of all displayed parameters in your map at this specific location.


To see the evolution of all displayed parameters in the whole map extent, use the time navigation at the bottom of the map. Click on e.g. ”+1 hour” to navigate 1 hour forward in time (see section First Navigation).


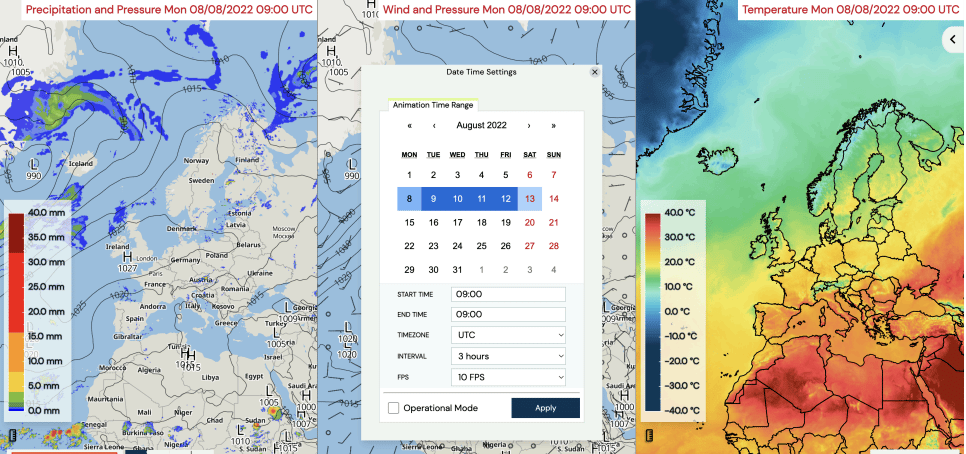
Finally, let’s make an animation to see the whole weather evolution during the next five days (see section Creating Animations). Click on ”Animation” on the time navigation on the right hand side at the bottom of the map. Then, click on the current date and time on the left hand side on the time navigation at the bottom to open the ”Date Time Settings”. Select the desired time range, the start and end time, the timezone, the interval and the frames per second (FPS). In this example, we choose the time range of 5 days, 09:00 UTC as start and end time, the timezone UTC, an interval of 3 hours and 10 FPS.


After clicking the ”Apply” button, press the loop icon to start the animation. The animation can be run in a loop ifis enabled. Save your map and animation by clicking on . To export your map as an image, click on export select ”Image/Video” and click on ”Download Image”. Alternatively, you can download the whole dashboard in a json format by clicking on ”Profile” and ”Download Profile”.