Isolines, Isobands, Label Pressure Systems and Weather Fronts
Isolines
The Meteomatics API allows to get data in order to visualize isolines for different parameters. The data about isolines is provided in the format GeoJSON, which can be easily integrated in any web-application.
http://api.meteomatics.com/get_isolines?<fields>| Field | Description | Example |
|---|---|---|
parameter | Parameter from the available parameters in the API. Note that only one parameter can be fetched per isoline query. | parameter=t_2m:C |
bbox | A bounding box specified by maximal and minimal latitude and longitude formatted according to bbox=<min_lon,min_lat,max_lon,max_lat> (please note the order). | bbox=5.8,45.7,10.7,47.9 |
| Optional fields | ||
datetime | A single point in time (UTC) as specified in the section Date/Time Description. datetime always refers to validdatetime. The default setting is now. | datetime=2018-04-12T12:45Z |
isoline_range | Define an interval for which isolines shall be generated. The structure is as follows: start,end,spacing. | isoline_range=-40,40,5 |
isoline_values | Define a single value or a list of values for which isolines shall be generated. If isoline_values=5 is set for temperature, then only the 5 °C-isotherm is generated. | isoline_values=0,0.5,1,1.5,2,2.5,3 |
resolution | Set the resolution of the input data, which the calculated isolines are based on (either in degrees or pixels): <resolution_lat>,<resolution_lon> or <number_lons>x<number_lats> | resolution=0.05,0.05 or resolution=400,300 |
source | Select the desired model/source. | source=mix |
radius_median_filter | Smoothing of isolines. Enter number between 0-10. Default is 1. | radius_median_filter=1 |
radius_gaussian_filter | Smoothing of isolines. Enter number between 0-10. Default is 3. | radius_gaussian_filter=3 |
isoline_min_points | Minimum number of points per isolines. Must be at least 2. | isoline_min_points=2 |
Note: In case all values within the selected bbox are larger or equal than the specified isoline_values no isoline will be returned.
Examples
-
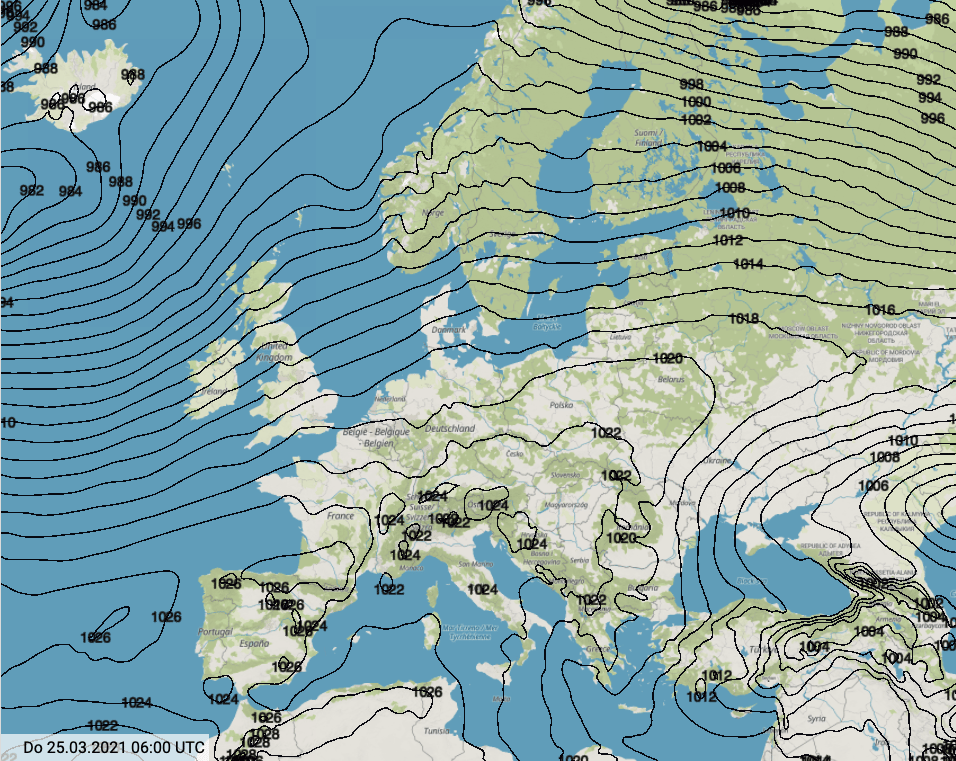
Get the isobars of mean sea level pressure in hPa for Europe:
http://api.meteomatics.com/get_isolines?datetime=2026-04-08T00:00:00Z¶meter=msl_pressure:hPa&source=mix&bbox=-12,30,35,67.96&radius_median_filter=1&radius_gaussian_filter=3&isoline_range=900,1100,2 -
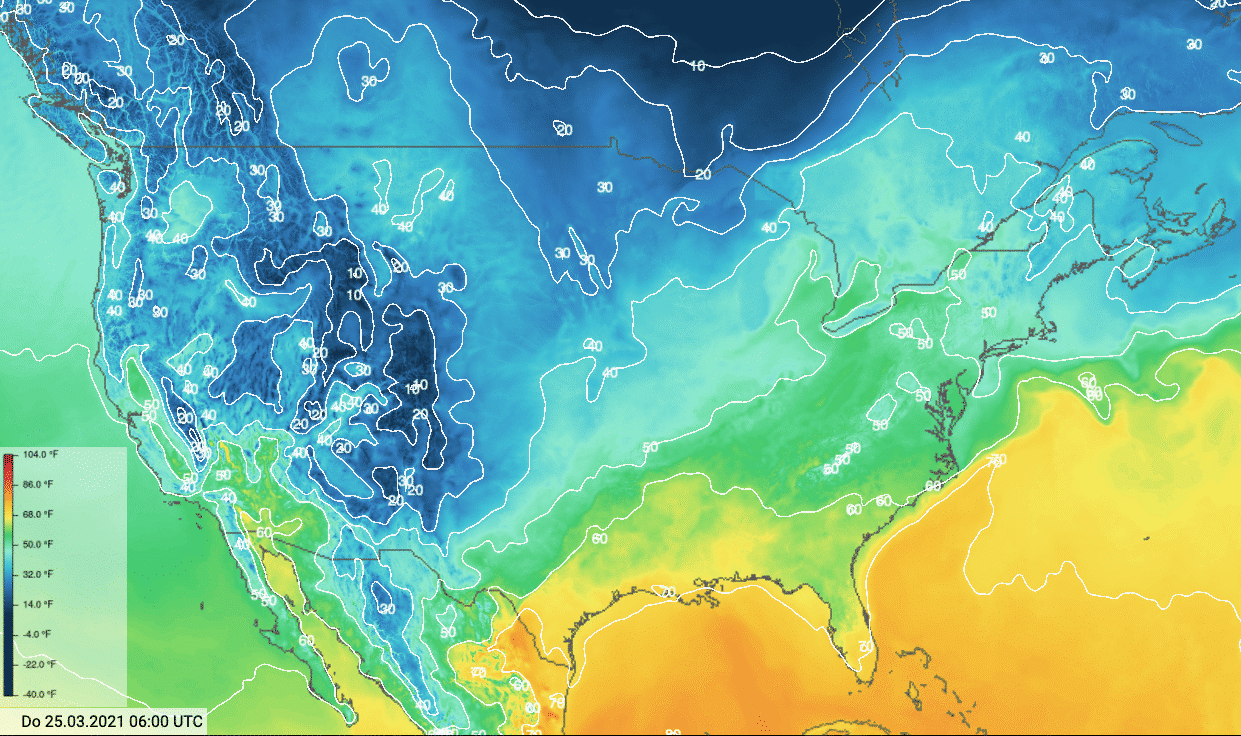
Get the isotherms of the 2 m air temperature in °F for the USA:
http://api.meteomatics.com/get_isolines?datetime=2026-04-08T00:00:00Z¶meter=t_2m:F&source=mix&bbox=-129.776158,21.849899,-58.467176,53.585547&radius_median_filter=1&radius_gaussian_filter=3&isoline_range=-40,40,5


Isobands
The Meteomatics API allows to get data in order to visualize isobands for different parameters. The data about isobands is provided in the format GeoJSON, which can be easily integrated in any web-application.
http://api.meteomatics.com/get_isobands?<fields>| Field | Description | Example |
|---|---|---|
parameter | Parameter from the available parameters in the API. Note that only one parameter can be fetched per isoband query. | parameter=t_2m:C |
bbox | A bounding box specified by maximal and minimal latitude and longitude formatted according to bbox=<min_lon,min_lat,max_lon,max_lat> (please note the order). | bbox=5.8,45.7,10.7,47.9 |
| Optional fields | ||
datetime | A single point in time (UTC) as specified in the section Date/Time Description. datetime always refers to validdatetime. The default setting is now. | datetime=2018-04-12T12:45Z |
resolution | Set the resolution of the input data, which the calculated isobands are based on (either in degrees or pixels): <resolution_lat>,<resolution_lon> or <number_lons>x<number_lats> | resolution=0.05,0.05 or resolution=400,300 |
source | Select the desired model/source. | source=mix |
radius_median_filter | Smoothing of isobands. Enter number between 0-10. Default is 1. | radius_median_filter=1 |
radius_gaussian_filter | Smoothing of isobands. Enter number between 0-10. Default is 3. | radius_gaussian_filter=3 |
isoband_min_points | Minimum number of points per isobands. Must be at least 2. | isoband_min_points=2 |
isoline_values | Define a single value or a list of values for which isobands shall be generated. If isoline_values=5 is set for temperature, then only the 5 °C-isotherm is generated. | isoline_values=0,0.5,1,1.5,2,2.5,3 |
isoline_range | Define an interval for which isobands shall be generated. The structure is as follows: start,end,spacing. | isoline_range=-40,40,5 |
isoband_intervals | Define ranges, where each isoband covers values between a set minimum and maximum.
Format:min0,max0_min1,max1_min2,max2,… | isoband_intervals=0,500_500,1000_1000,... |
Note: In case all values within the selected bbox are larger or equal than the specified isoline_values a polygon representing the bounding box will be returned. Hence, even if the get_isolines response for identical parameters does NOT return any isolines, get_isobands might return a polygon.
Examples
-
Get the isobands of the temperature in °F for the US:
https://api.meteomatics.com/get_isobands?datetime=2026-04-08T00:00:00Z¶meter=t_2m:F&source=mix&bbox=-129.776158,21.849899,-58.467176,53.585547&radius_median_filter=1&radius_gaussian_filter=3&isoline_range=30,100,10 -
Get the isobands of the mean sea level pressure in hPa for Europe:
https://api.meteomatics.com/get_isobands?datetime=2026-04-08T00:00:00Z¶meter=msl_pressure:hPa&source=mix&bbox=-12,30,35,67.96&radius_median_filter=1&radius_gaussian_filter=3&isoline_range=1000,1200,5
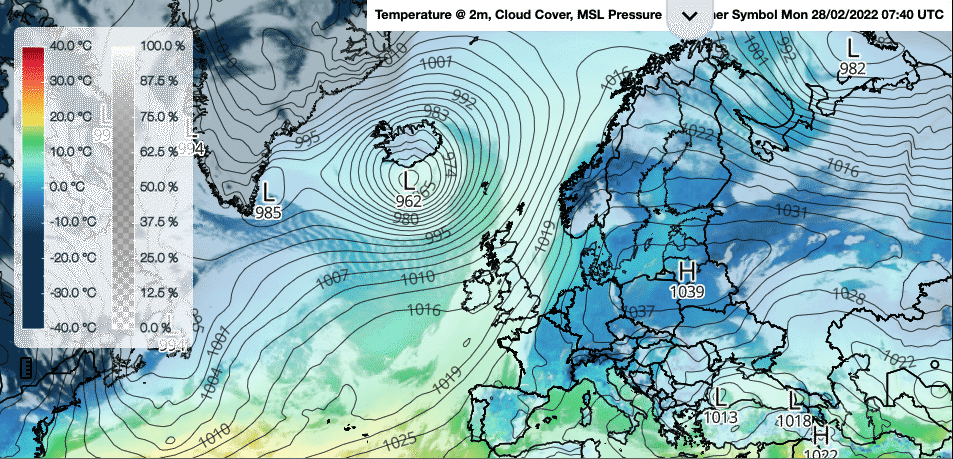
Label High and Low pressure systems
The Meteomatics API also allows to label regions of high and low pressure with the corresponding letters H and L. The data format is a GeoJSON file, which provides minima and maxima of mean sea level pressure in a given boundary box. This allows for an easy integration in any web-application.
http://api.meteomatics.com/get_highs_lows?<fields>| Field | Description | Example |
|---|---|---|
parameter | Parameter which the labeling of highs and lows is based on. | parameter=msl_pressure:hPa, parameter=geopotential_height_700hPa:m |
bbox | A bounding box specified by maximal and minimal latitude and longitude formatted according to bbox=<min_lon,min_lat,max_lon,max_lat> (please note the order). | bbox=5.8,45.7,10.7,47.9 |
| Optional fields | ||
datetime | A single point in time (UTC) as specified in the section Date/Time Description. datetime always refers to validdatetime. The default setting is now. | datetime=2018-04-12T12:45Z |
isoline_range | Define an interval for which isolines shall be generated. The structure is as follows: start,end,spacing. The default setting for the parameter msl_pressure:hPa is 960, 1040, 4 (in hPa). If other units like Pa or psi are used, the interval has to be defined in the respective unit. | isoline_range=1000,1020,3 |
isoline_values | Define a single value or a list of values for which isolines shall be generated. If isoline_values=5 is set for temperature, then only the 5 °C-isotherm is generated. | isoline_values=0,0.5,1,1.5,2,2.5,3 |
resolution | Set the resolution of the input data, which the calculated isolines are based on (either in degrees or pixels): <resolution_lat>,<resolution_lon> or <number_lons>x<number_lats> | resolution=0.05,0.05 or resolution=400,300 |
source | Select the desired model/source. | source=mix |
radius_median_filter | Smoothing of isolines. Enter number between 0-10. Default is 4. | radius_median_filter=1 |
radius_gaussian_filter | Smoothing of isolines. Enter number between 0-10. Default is 3. | radius_gaussian_filter=3 |
Examples
-
Display highs and lows:
http://api.meteomatics.com/get_highs_lows?datetime=2026-04-08T00:00:00Z¶meter=msl_pressure:hPa&source=mix&bbox=-12,30,35,67.96&radius_median_filter=1&radius_gaussian_filter=3&isoline_range=960,1040,4

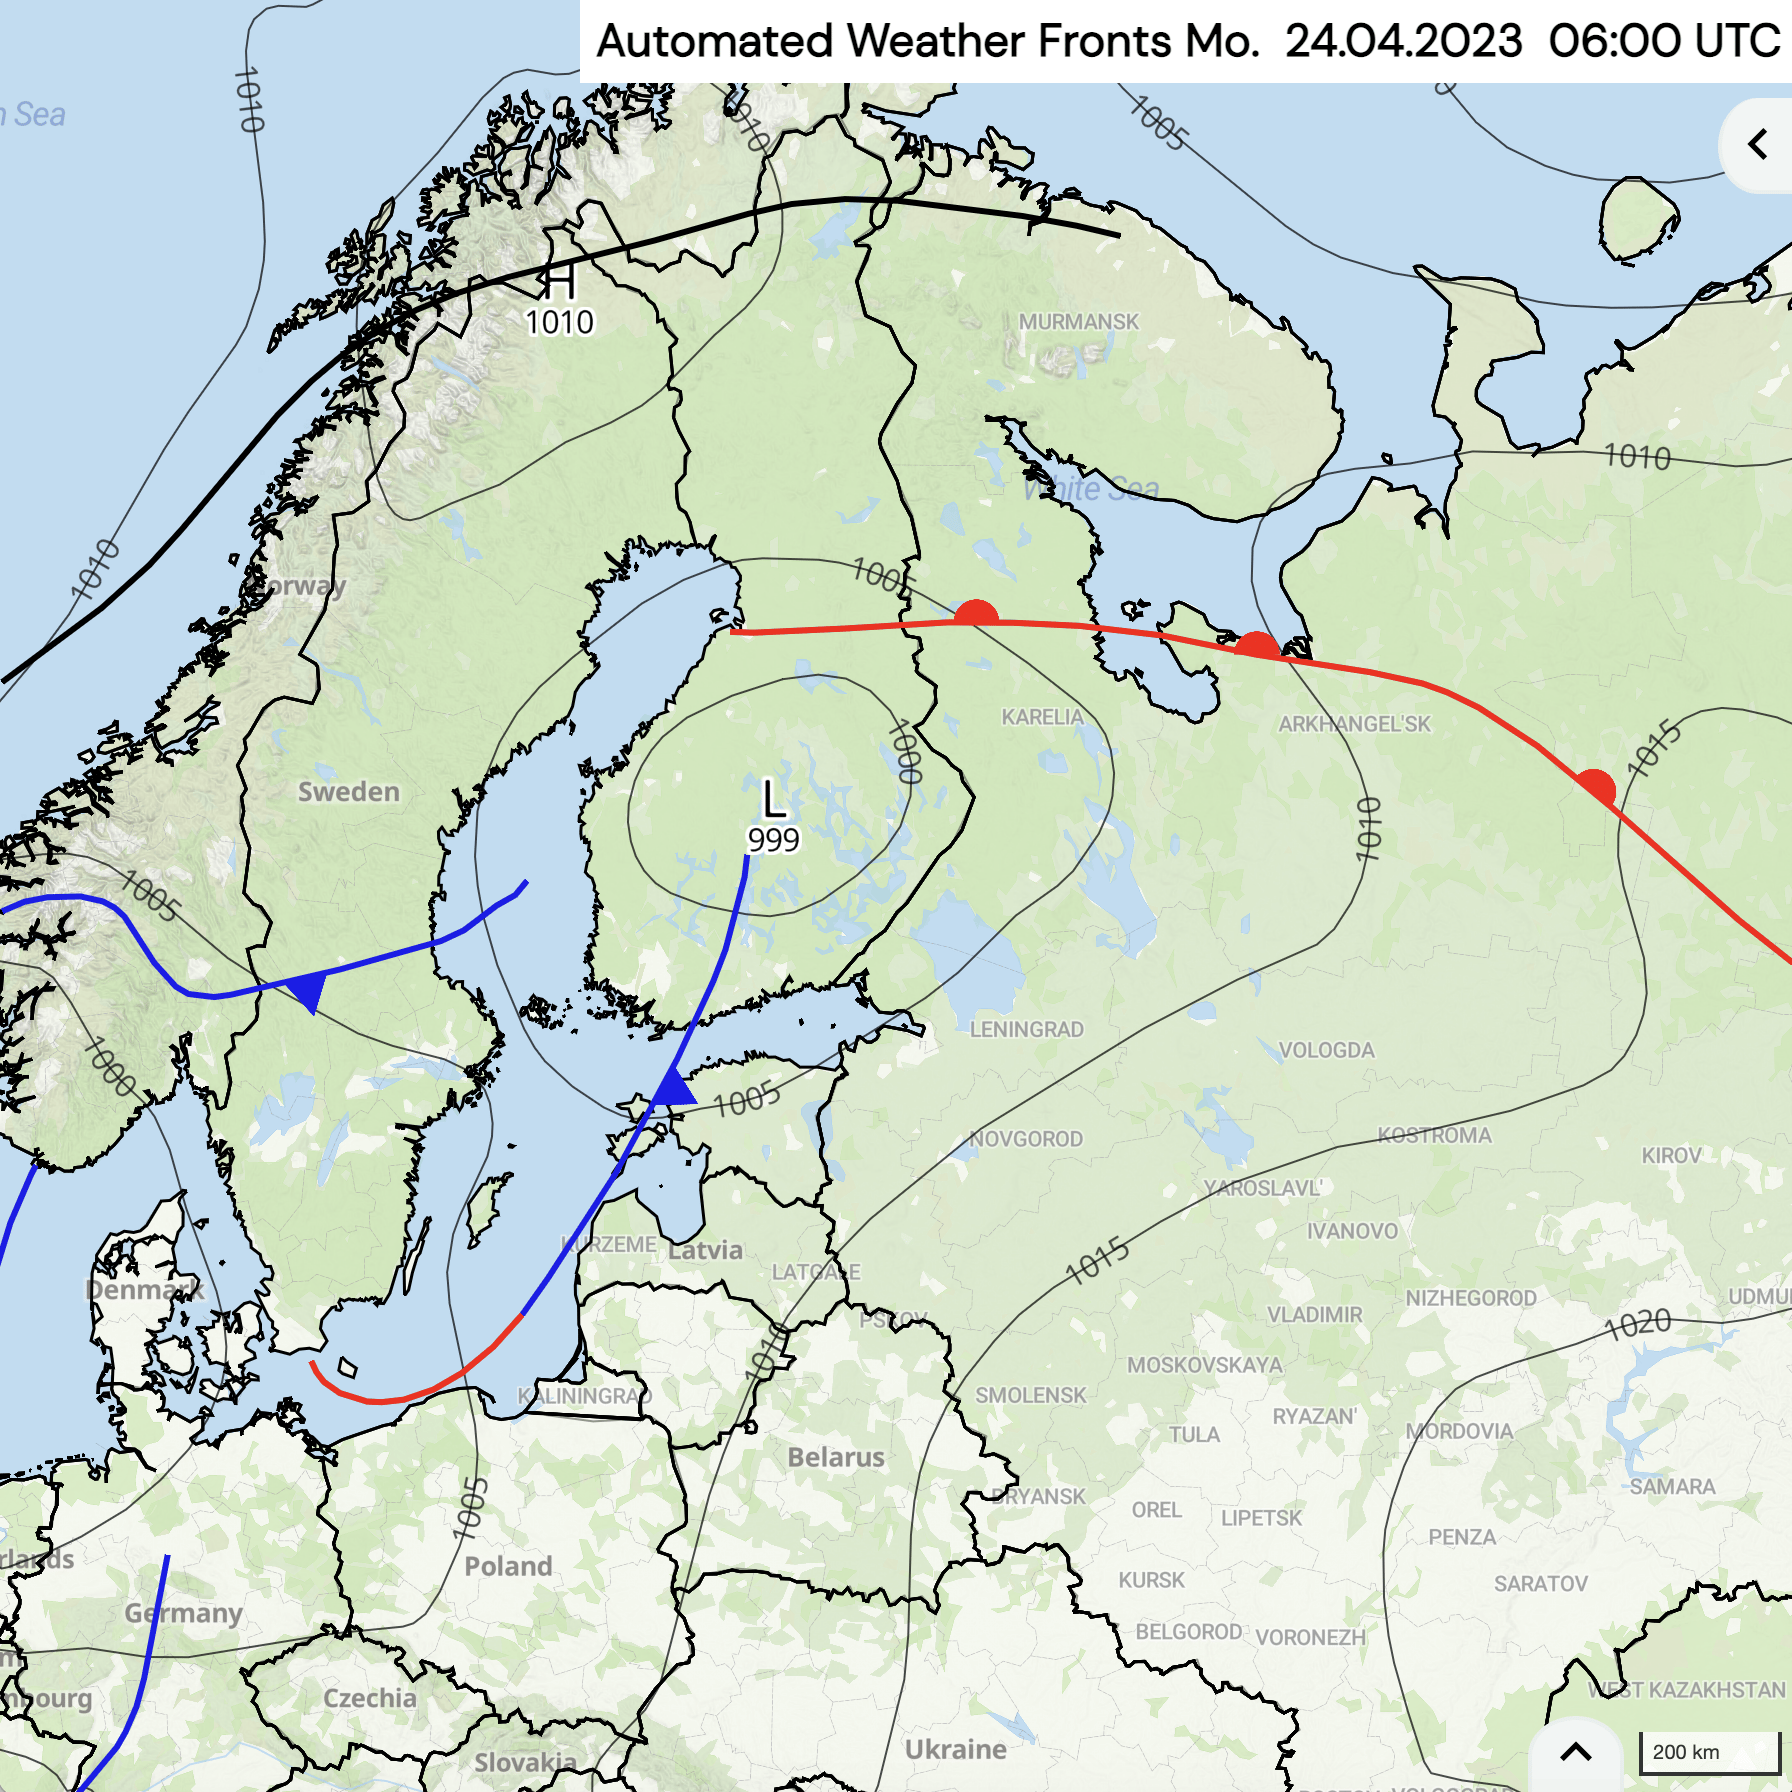
Automated Weather Fronts
The Meteomatics API allows to get automatically identified weather fronts. It distingushes between cold fronts, warm fronts, stationary fronts and upper-level fronts. Also, the direction in which the fronts are moving is provided. The data to display automated weather fronts is provided in the format GeoJSON, which can be easily integrated in any web-application.
http://api.meteomatics.com/get_weather_fronts?<fields>| Field | Description | Example |
|---|---|---|
datetime | A single point in time (UTC) as specified in the section Date/Time Description. datetime always refers to validdatetime. | datetime=2023-04-27T12:45Z |
bbox | A bounding box specified by maximal and minimal latitude and longitude formatted according to bbox=<min_lon,min_lat,max_lon,max_lat> (please note the order). | bbox=5.8,45.7,10.7,47.9 |
| Optional fields | ||
source | Select the desired model/source. The default setting is ecmwf-ifs. | source=ecmwf-ifs, source=ncep-gfs, source=ukmo-um10 |
Example
-
Display Weather Fronts:
http://api.meteomatics.com/get_weather_fronts?datetime=2026-04-08T00:00:00Z&source=ecmwf-ifs&bbox=60,30,70,67
The following MetX Chart shows the cold fronts in blue, the warm fronts in red and upper-level fronts in black: