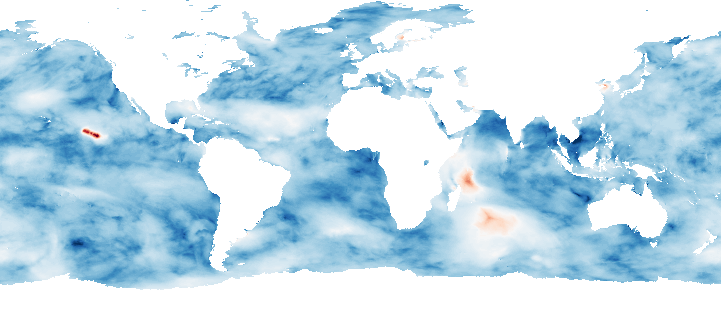
Extreme Forecast Index (EFI) & Shift of Tails (SOT)
Potentially extreme weather can be identified with the powerful tools EFI and SOT. These indices provide ensemble-based measures of how likely and how extreme a weather event would be than usual, given as likelihood measure (not probability for a certain event).
efi: Extreme Forecast Index
sot: Shift Of Tails.
Both types of parameters are based on the Cumulative Distribution Function of the different models that make up the ensemble and refer to a certain time range over which they measure the tendency for extreme events. EFI values over 0.8 denote high likelihood for unusual conditions. SOT values signify their extremeness. Only for temperature, the shift of distribution tails is given for both the upper (default) and the lower tail (marked additionally).
Selection of time interval
These indices are queried together with a time range which they are valid for, i.e. t_2m_<range>_efi:idx. Date/time stamps are right aligned.
Examples for time ranges:
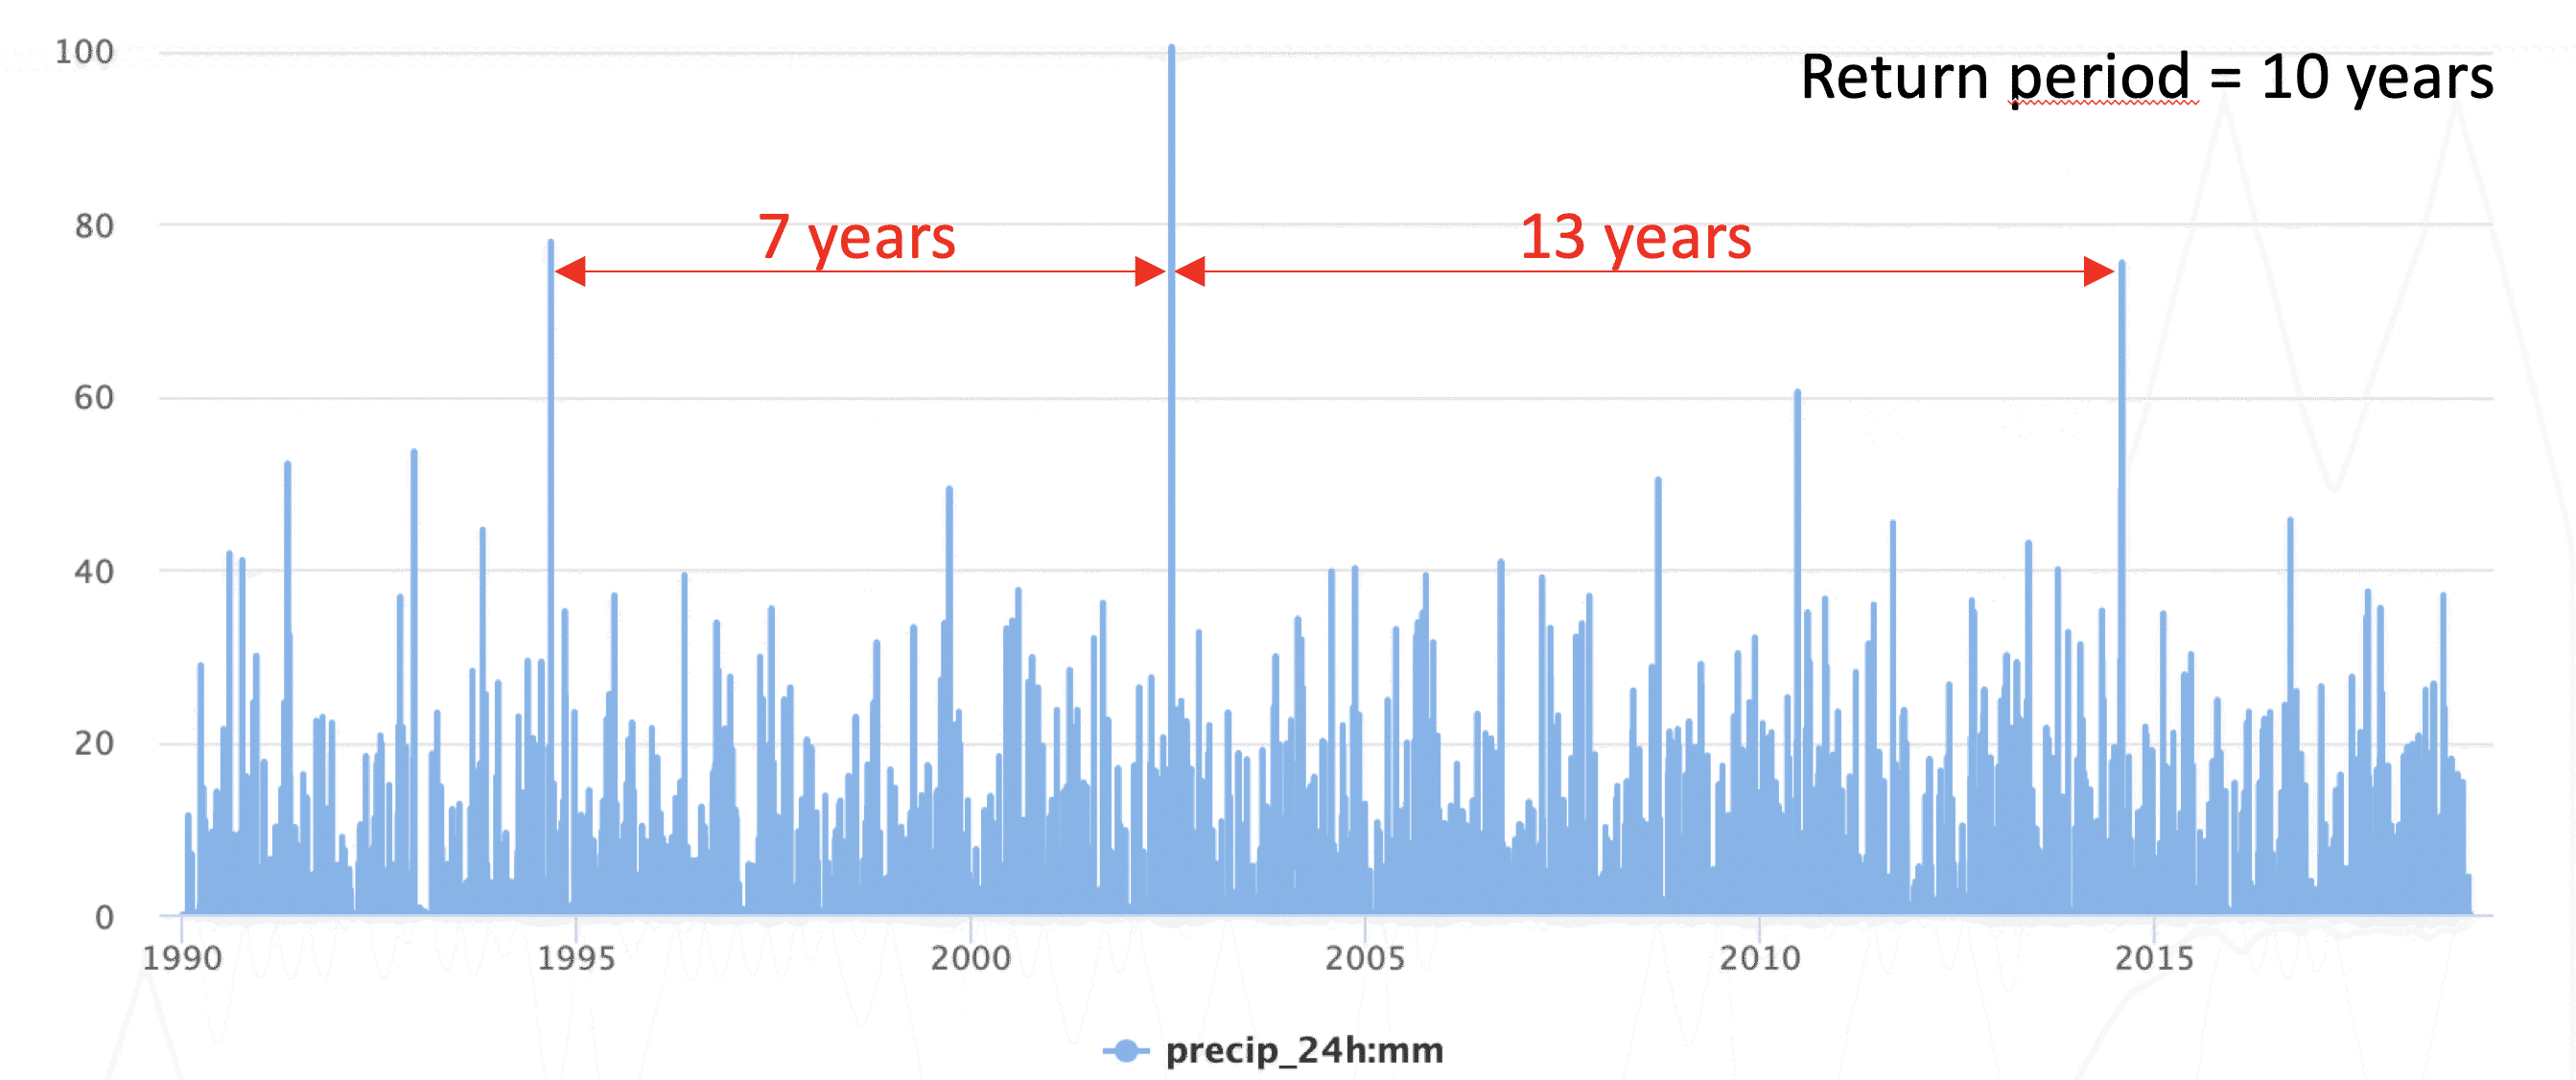
The return period is an estimated average time between the occurrences of a defined event of a given severity for a selected area (e.g. extreme flooding event). The unit of the return period is years.
return_period:yrs
Example:<br/ >Defined event: Extremely high values of 24 hour accumulated precipitaton (1990 – 2020)
Return period: 10 years (mean of times between events)
Specifications
Parameter & time period
Identifier
Description
Example
rp_source_parameter
Parameter to be analyzed
precip_24h:mm
rp_source_start_date
Start time of investigated data
1979-01-01Z
rp_source_end_date
End time of investigated data
2018-12-31Z
Thresholds
Daily values that are above or below a certain threshold can be ignored. The orientation of the threshold has to be defined as well. The setting of a threshold is optional.
rp_threshold
Value for a threshold
None, any numerical value (e.g. 50), quantiles (e.g. quantile0.25)
rp_threshold_orientation
Defines the values that are kept
below (values above the threshold are set to invalid), above (values below the threshold are set to invalid)
Risk Window
Relevant time window of the year that can be defined for the analysis. For example, if floodings are investigated, a plausible risk window would be May 1st until October 1st.
rp_risk_window_aggregation
Function used to accumulate/reduce daily valid values to single value per risk window
min, mean, max, median, sum
rp_risk_window_start_day
Start day of risk window
1
rp_risk_window_start_month
Start month of risk window
5
rp_risk_window_end_day
End day of risk window
1
rp_risk_window_end_month
End month of risk window
10
Extremes
It has to be defined which orientation of extremes should be considered as severe conditions. The orientation can be either up, which takes large values into account, or down, which uses low values.
rp_extremes_orientation
large (e.g. extreme rain) or low (e.g. frost) values indicate the rarest, most severe conditions
rp_source_parameter=precip_24h:mm: parameter of interest is the 24 hour accumulated precipitation.
rp_risk_window_aggregation=max: aggregated single values for the risk window are calculated. Here, always the maximum values within the risk window is taken.
rp_extremes_orientation=up: the extremes orientation is set to up in order to consider high values as severe conditions.
The output contains one value per year. For example, the value of 1.538 years in 1986 means that the maximum precipitation, which occurred in 1986 is expected to return every 1.538 years on average.
Dry conditions like in 2018 are expected to occur every 20 years on average.
Privacy Settings
Your satisfaction is our goal, which is why we use cookies. With these cookies, we enable our website to run reliably and securely, keep an eye on performance, and better engage with you.
Cookies are necessary for everything to function technically, and they allow you to access external content. Additionally, we collect data, including information about visited pages, completed purchases, or clicked buttons, to enhance our services for you.
Learn more about the services we use in the "Cookie Settings" section. By clicking "Agree and Continue", you consent to the use of these services. You can revoke or modify your consent at any time with effect for the future.