Polygon Queries
The polygon query facilitates the selection of arbitrary areas all around the globe. You can query any weather parameter for the selected polygon and obtain mean, median, minimum or maximum values.
The query can be either performed for a single point in time or for a time range (see time description).
In order to define the polygon, you need to provide the desired vertices (latitude, longitude). You can decide how many vertices are used. The points can be given in clockwise or anticlockwise direction. The last point is automatically joined to the first point to make a closed polygon. Currently available output formats are csv, json and xml.
The basic structure of the query is:
api.meteomatics.com/validdatetime/parameters/lat1,lon1_lat2,lon2_..._latN,lonN:aggregate/format?optionals
Available aggregate options are:
| Identifier | Description |
|---|---|
min | Find the minimum value |
max | Find the maximum value |
mean | Compute the mean |
median | Compute the median |
mode | Compute the mode (most frequent value) |
quantile | Compute a quantile (any value between 0 and 1, e.g. quantile0.3) |
integral | Compute the total accumulated value over the polygon |
Available related optionals are:
| Identifier | Available values | Description |
|---|---|---|
polygon_sampling | adaptive_grid | Adaptive sampling of the grid choosing the resolution based on the polygon size. (Default) |
model_grid | Sample only values from the native model grid. Note that this needs a model to be specified (e.g. &source=ncep-gfs)Note: this option could cause time outs. If you encounter any problems, please contact [email protected] |
Examples:
The following examples demonstrate different applications of the polygon query:
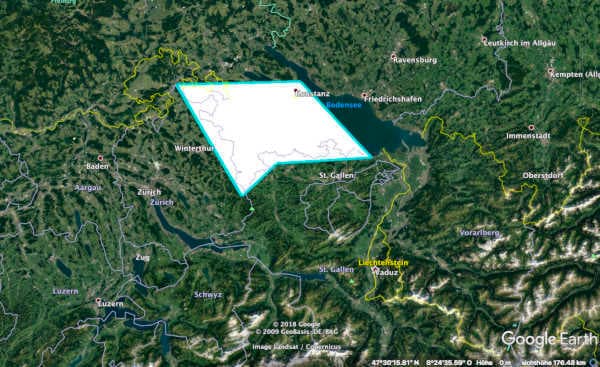
In the first example a polygon is selected that encompasses the canton of Thurgau. The chosen parameters are temperature, surface pressure and wind speed. This query computes the mean hourly values for the entire polygon from today at 12 UTC until tomorrow 12 UTC. The output format is csv:
https://api.meteomatics.com/2026-07-30T12ZP1D:PT1H/t_2m:C,sfc_pressure:hPa,wind_speed_10m:ms/47.376,8.94493_47.4838,9.0136_47.4903,9.4559_47.6626,9.15642_47.6839,8.67025:mean/csv

validdate;t_2m:C;sfc_pressure:hPa;wind_speed_10m:ms
2019-05-15T12:00:00Z;9.7;959.7;8.3
2019-05-15T13:00:00Z;9.9;959.4;8.5
2019-05-15T14:00:00Z;9.8;959.1;8.6
2019-05-15T15:00:00Z;9.4;959.0;8.3
2019-05-15T16:00:00Z;8.6;959.1;7.9
2019-05-15T17:00:00Z;7.7;959.4;7.3
2019-05-15T18:00:00Z;6.7;959.0;6.5
2019-05-15T19:00:00Z;5.6;959.2;5.5
2019-05-15T20:00:00Z;5.0;959.1;5.1
2019-05-15T21:00:00Z;4.5;959.0;5.1
2019-05-15T22:00:00Z;4.2;958.5;4.7
2019-05-15T23:00:00Z;4.0;957.9;4.7
2019-05-16T00:00:00Z;4.0;957.4;4.5
2019-05-16T01:00:00Z;4.2;956.8;4.8
2019-05-16T02:00:00Z;4.1;956.2;4.8
2019-05-16T03:00:00Z;4.1;955.6;4.8
2019-05-16T04:00:00Z;4.0;955.8;4.7
2019-05-16T05:00:00Z;4.0;955.7;4.5
2019-05-16T06:00:00Z;4.4;955.5;4.5
2019-05-16T07:00:00Z;5.3;955.0;4.4
2019-05-16T08:00:00Z;6.2;954.5;4.4
2019-05-16T09:00:00Z;7.2;954.0;4.1
2019-05-16T10:00:00Z;8.3;953.7;3.6
2019-05-16T11:00:00Z;9.2;953.3;3.3
2019-05-16T12:00:00Z;10.1;952.8;2.7
The second example demonstrates the selection of two polygons for the same parameters as in the first example. An aggregation method has to be supplied for each polygon. The commands for the single polygons are connected by a + sign. The polygon of the first example is selected two times, but each with a different aggregation method:
https://api.meteomatics.com/2026-07-30T12ZP1D:PT1H/t_2m:C,sfc_pressure:hPa,wind_speed_10m:ms/47.376,8.94493_47.4838,9.0136_47.4903,9.4559_47.6626,9.15642_47.6839,8.67025:mean+47.376,8.94493_47.4838,9.0136_47.4903,9.4559_47.6626,9.15642_47.6839,8.67025:max/csv
station_id;validdate;t_2m:C;sfc_pressure:hPa;wind_speed_10m:ms
polygon1;2020-05-07T12:00:00Z;17.0;961.8;3.2
polygon1;2020-05-07T13:00:00Z;17.9;961.4;2.8
polygon1;2020-05-07T14:00:00Z;18.4;961.0;2.3
polygon1;2020-05-07T15:00:00Z;18.6;960.7;1.9
polygon1;2020-05-07T16:00:00Z;18.5;960.5;1.7
In the third example two polygons, in this case rectangles, are selected that are located in the Netherlands/Germany and Switzerland. Note that you can unite two polygons with U. The chosen parameter is the elevation of the terrain and the aggregation method is min. So, the result of this query is the minimum elevation within the combined polygons. The output format is xml.
https://api.meteomatics.com/2026-07-30T12Z/elevation:m/52.2,6.6_52.2,7.6_53.2,7.6_53.2,6.6U45.9,7.56_45.9,7.92_46.15,7.92_46.15,7.65:min/xml
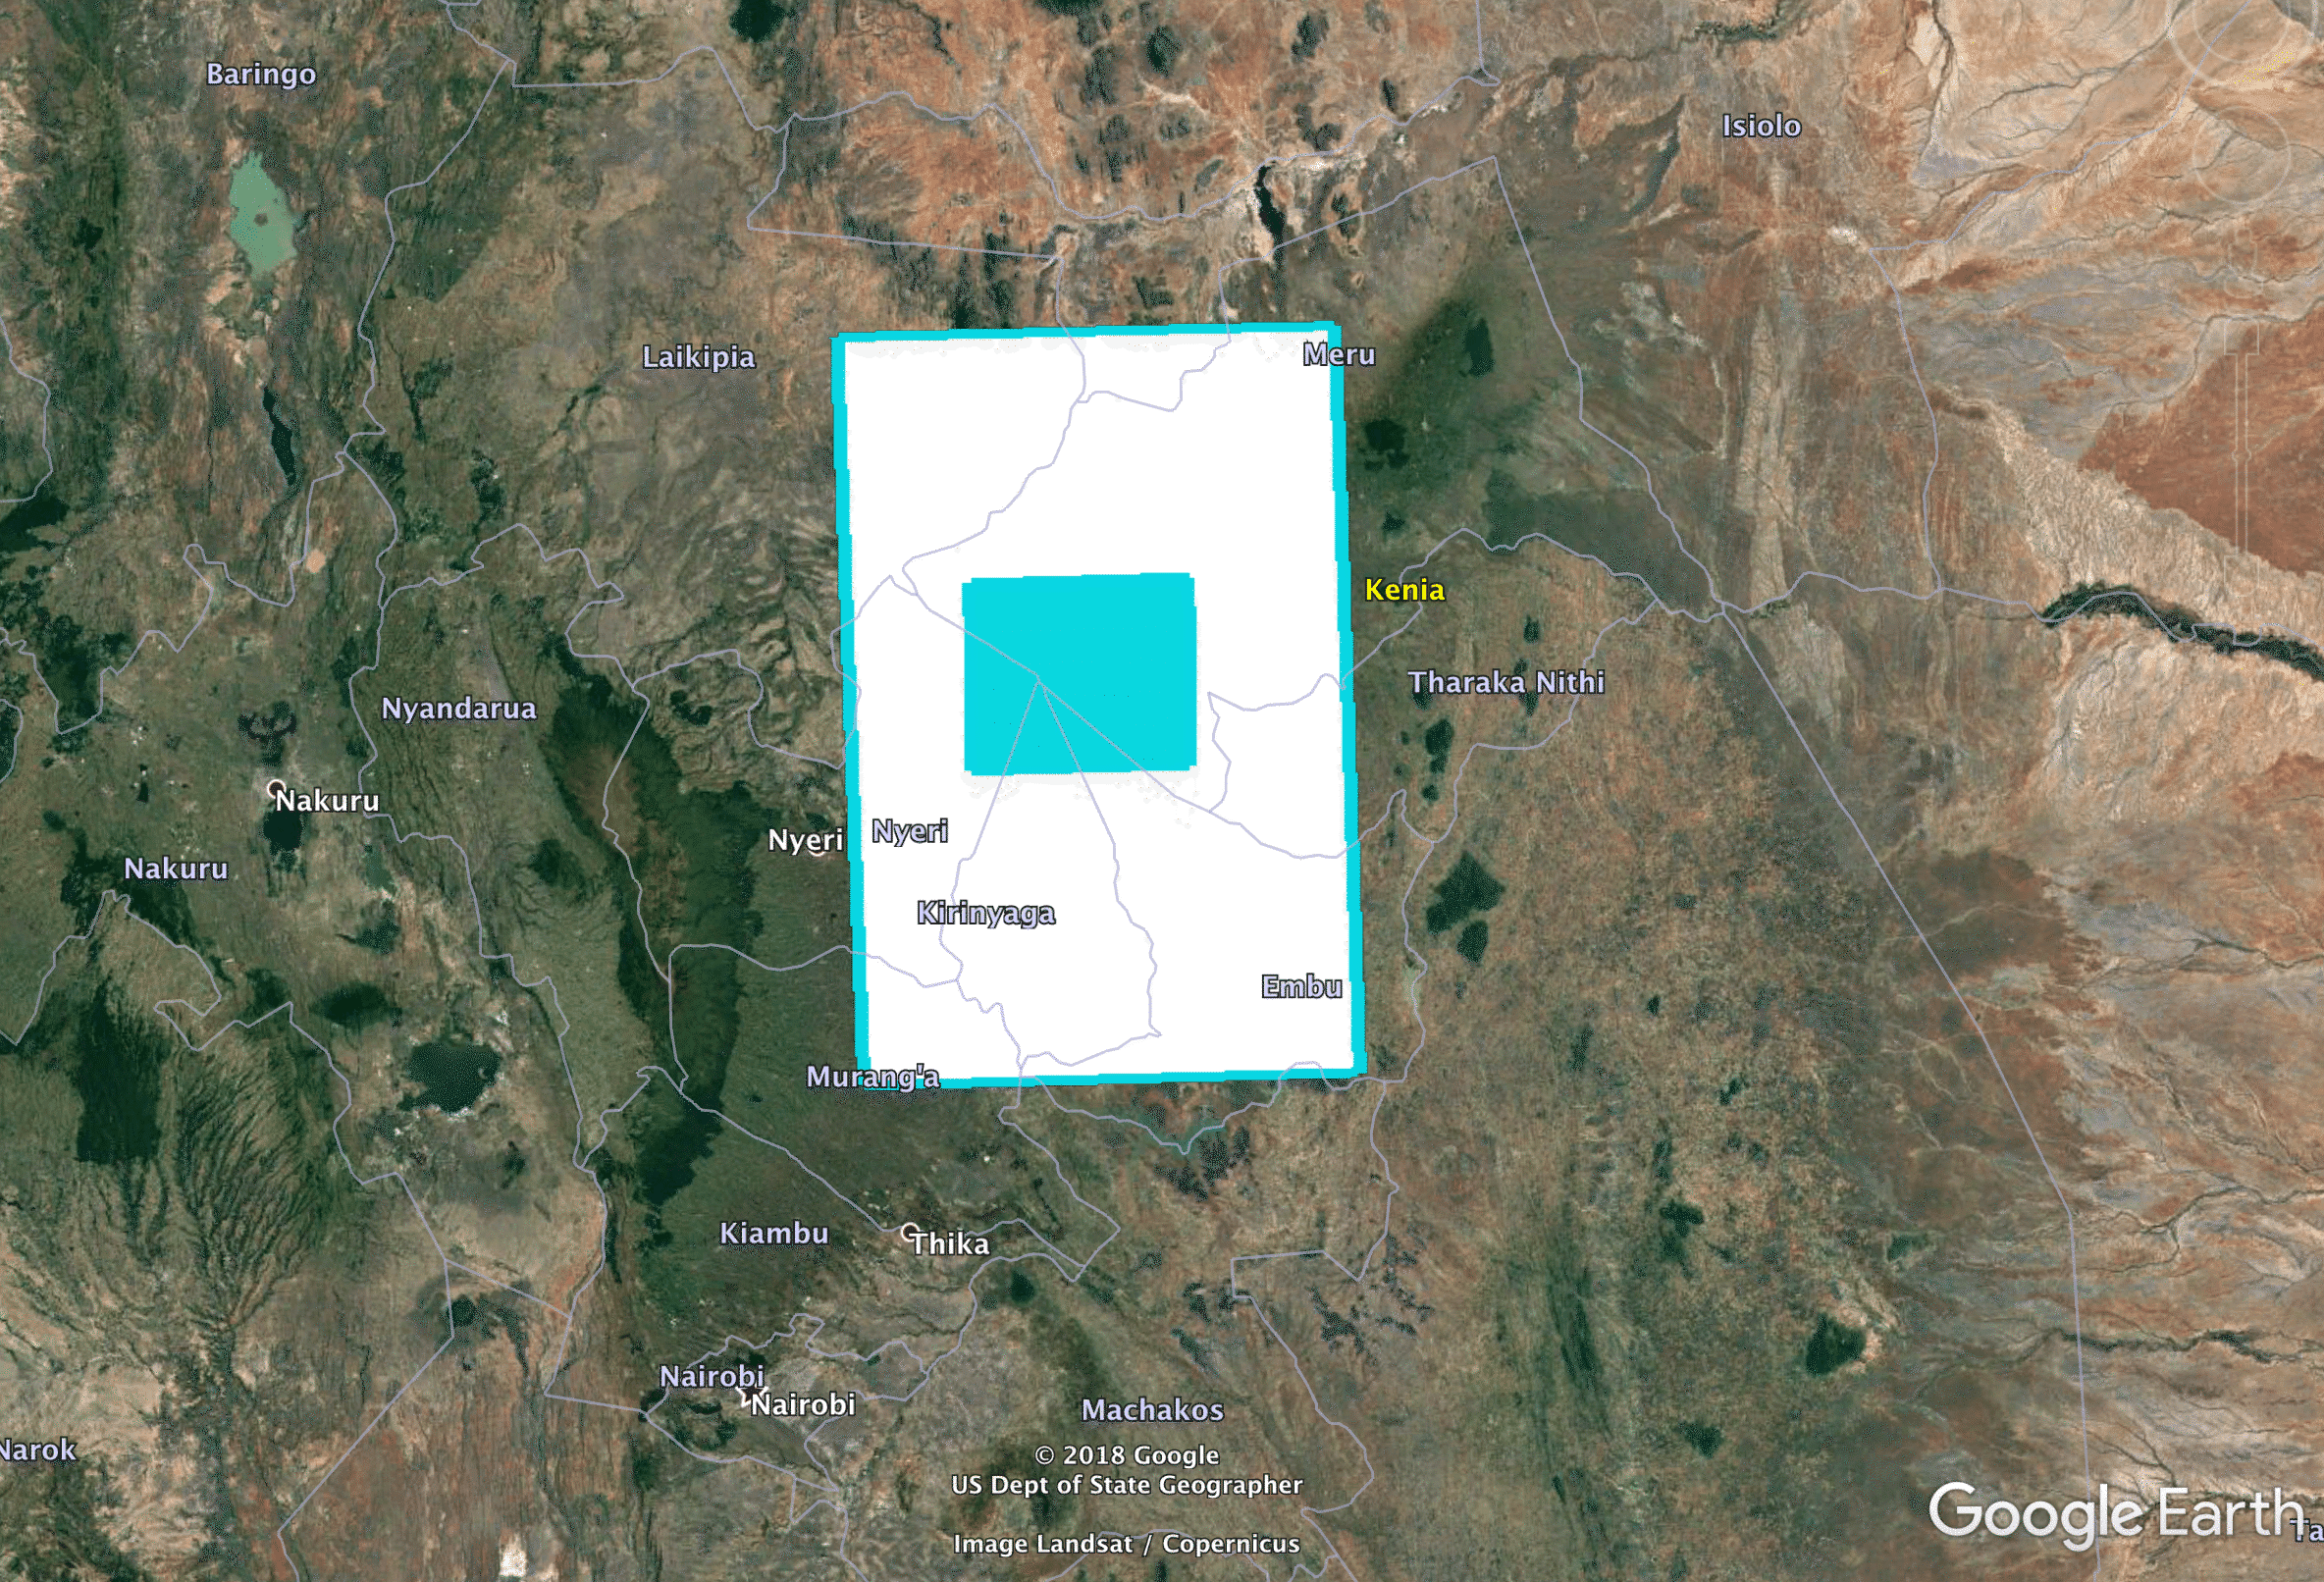
<?xml version="1.0" encoding="UTF-8"?>
<meteomatics-api-response version="3.0">
 <user>meteomatics</user>
 <dateGenerated>2019-05-15T12:33:30Z</dateGenerated>
 <status>OK</status>
 <data>
 <parameter name="elevation:m">
 <location station_id="polygon1">
 <value date="2019-05-15T12:00:00Z">-5.0</value>
 </location>
 </parameter>
 </data>
</meteomatics-api-response>
The fourth example shows how to cut out one polygon from another. The vertices of the larger polygon are defined first and then those of the cutout polygon (turquoise colored rectangle). The two commands are separated by
D, denoting difference. So, the second polygon is excluded from the first polygon. In this example, Mount Kenya is excluded from the selection. Also, additional polygons could be cut out from the surrounding polygon. The result of this query is the maximum elevation of the area around Mount Kenya. The file format is csv.
https://api.meteomatics.com/2026-07-30T12Z/elevation:m/0.3873,36.9388_-0.791,36.9388_-0.791,37.837_0.3873,37.837D0.0385,37.208_-0.3214,37.208_-0.3214,37.56_0.0385,37.56:max/csv

validdate;elevation:m
2019-05-15T12:00:00Z;3031.0
We revisit the first example to showcase the polygon_sampling usage:
https://api.meteomatics.com/2026-07-30T12ZP1D:PT1H/t_2m:C,sfc_pressure:hPa,wind_speed_10m:ms/47.376,8.94493_47.4838,9.0136_47.4903,9.4559_47.6626,9.15642_47.6839,8.67025:mean/csv?polygon_sampling=model_grid&source=ncep-gfs
validdate;t_2m:C;sfc_pressure:hPa;wind_speed_10m:ms
2020-11-02T12:00:00Z;20.3;959.4;2.0
2020-11-02T13:00:00Z;19.4;959.5;1.8
2020-11-02T14:00:00Z;18.6;959.6;1.5
2020-11-02T15:00:00Z;17.7;959.6;1.3
2020-11-02T16:00:00Z;16.5;960.0;1.5
2020-11-02T17:00:00Z;15.2;960.4;1.8
2020-11-02T18:00:00Z;13.9;960.8;2.0
2020-11-02T19:00:00Z;14.1;961.2;2.1
2020-11-02T20:00:00Z;14.4;961.6;2.2
2020-11-02T21:00:00Z;14.7;962.0;2.3
2020-11-02T22:00:00Z;14.5;962.2;2.5
2020-11-02T23:00:00Z;14.4;962.5;2.7
2020-11-03T00:00:00Z;14.3;962.7;2.9
2020-11-03T01:00:00Z;14.0;962.6;2.6
2020-11-03T02:00:00Z;13.8;962.5;2.2
2020-11-03T03:00:00Z;13.5;962.4;1.9
2020-11-03T04:00:00Z;13.4;962.6;1.7
2020-11-03T05:00:00Z;13.3;962.7;1.5
2020-11-03T06:00:00Z;13.1;962.8;1.3
2020-11-03T07:00:00Z;12.0;963.2;1.7
2020-11-03T08:00:00Z;10.9;963.6;2.1
2020-11-03T09:00:00Z;9.9;964.0;2.5
2020-11-03T10:00:00Z;9.8;963.8;2.1
2020-11-03T11:00:00Z;9.7;963.6;1.8
2020-11-03T12:00:00Z;9.6;963.5;1.4