Atmospheric Stability API Parameters
Convective Available Potential Energy (CAPE) | Convective Inhibition (CIN) | Lifted Index | Convective Categories | Thunderstorm Probability| Thunderstorm Height | Lightning Flash Densitiy
Convective Available Potential Energy (CAPE)
The convective available potential energy (given in joules per kilogram air) is the amount of energy a parcel of air would have if lifted a certain distance vertically through the atmosphere. Any value greater than 0 J/kg indicates instability and an increasing probability of thunderstorms and hail.
cape:JkgIt is also possible to get the mean, maximum or minimum of the convective available potential energy of an indicated time interval.
cape_<measure>_<interval>:JkgAvailable measures: mean, min, max
Available intervals: 1h, 2h, 3h, 6h, 12h, 24h, 48h, 72h
Examples
-
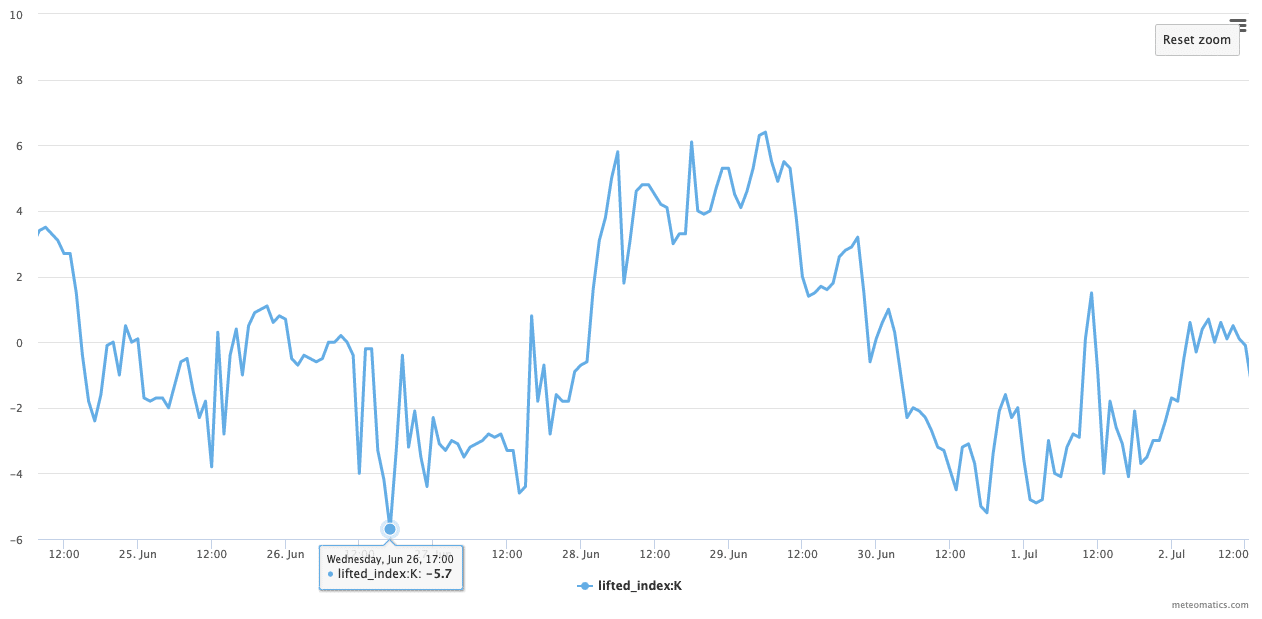
Below is a chart containing the CAPE values for two days of July 2024 in St. Gallen.
Here you can find the current situation:
https://api.meteomatics.com/2026-07-30T00:00:00ZP4D:PT1H/cape:Jkg/47.412164,9.340652/html


Convective Inhibition (CIN)
The convective inhibition (given in joules per kilogram air) is the amount of energy required to lift the parcel to the level of free convection (LFC). While high values (150 J/kg and above) of CIN suppress thunderstorm development, lower CIN values suggest favorable thunderstorm development conditions (i.e. when CIN is 30 J/kg or less).
cin:JkgExamples
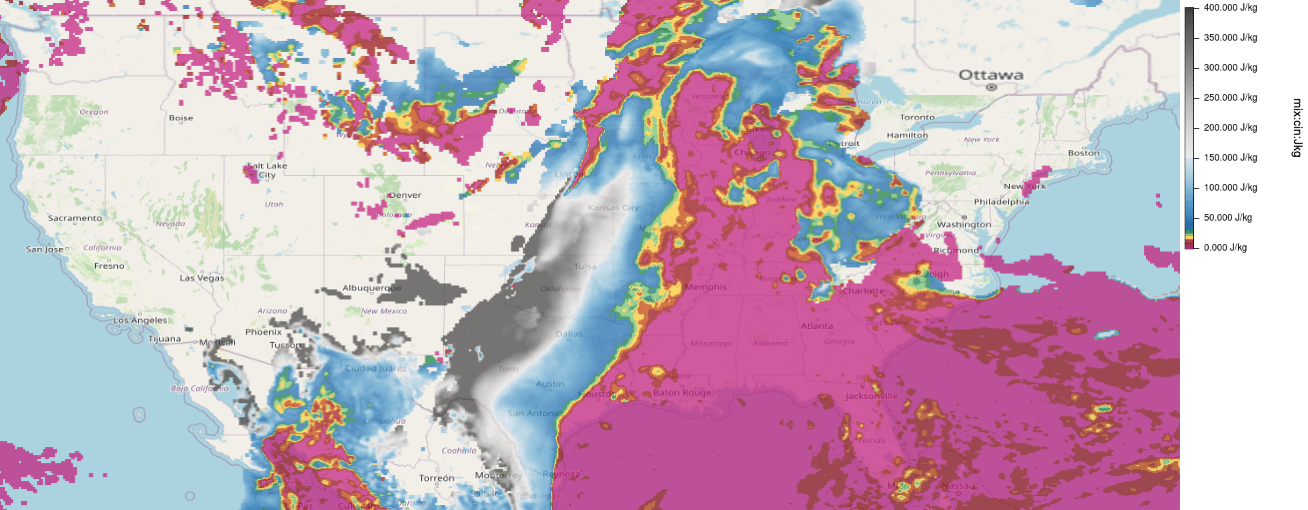
- Below is an image containing the CIN values over the US on September 20, 2021 at 15 UTC, while thunderstorms were passing over Wisconsin and off the Florida coast.
-
Here you can find a two day forecast of CIN:
https://api.meteomatics.com/2026-07-30T00:00:00ZP2D:PT1H/cin:Jkg/47.412164,9.340652/html

Lifted Index
The lifted index (given in Kelvin) is the difference between the temperature of the environment and that of an air parcel lifted adiabatically to a given pressure height in the troposphere, usually 500 hPa. The atmosphere at the given height is stable for positive values of the lifted index and unstable for negative values. When the value falls below -2, thunderstorms are anticipated. and for lower values, especially those below -6, severe weather is expected.
lifted_index:KThe mean, maximum or minimum of the lifted index over an indicated time interval are also given.
lifted_index_<measure>_<interval>:KAvailable measures: mean, min, max
Available intervals: 1h, 2h, 3h, 6h, 12h, 24h, 48h, 72h
Examples
-
Below is a chart containing the lifted index of 7 days of July, 2024. Current situation:
https://api.meteomatics.com/2026-07-30T00:00:00ZP7D:PT1H/lifted_index:K/47.412164,9.340652/html -
Here you can find a 10 day forecast of the minimum lifted index over 6h with the corresponding json file:
https://api.meteomatics.com/2026-07-30T00:00:00ZP10D:PT6H/lifted_index_min_6h:K/47.412164,9.340652/json

Convective Categories
Convective categories denote the convective potential of clouds. A high category (category 3 and above) indicates the potential for strong convection and the development of thunderstorm clouds.
convective_categories_<interval>:idxAvailable intervals: 1h, 2h, 3h, 6h, 12h, 24h
| Categories | Description | Meaning |
| 0 | No convection | No or only very shallow convective clouds. |
| 1 | Shallow convection | Shallow convective clouds with no potential for precipitation. |
| 2 | Weak convection | Small-scale convective clouds with potential for isolated showers. |
| 3 | Moderate convection | Potential for significant showers and possible thunderstorm development. |
| 4 | Heavy convection | Potential to form heavy thunderstorms. |
| 5 | Severe convection | Potential to form severe thunderstorms. |
Example:
-
Convective categories on 14th of September 2024:
Current situation:
https://api.meteomatics.com/2026-07-30T00:00:00Z/convective_categories_1h:idx/60,-12_35,30:0.05,0.05/html_map


Thunderstorm Probabilities
Gives the probability of a thunderstorm to occur.
prob_tstorm_<interval>:pAvailable intervals: 1h, 2h, 3h, 6h, 12h, 24h
Examples
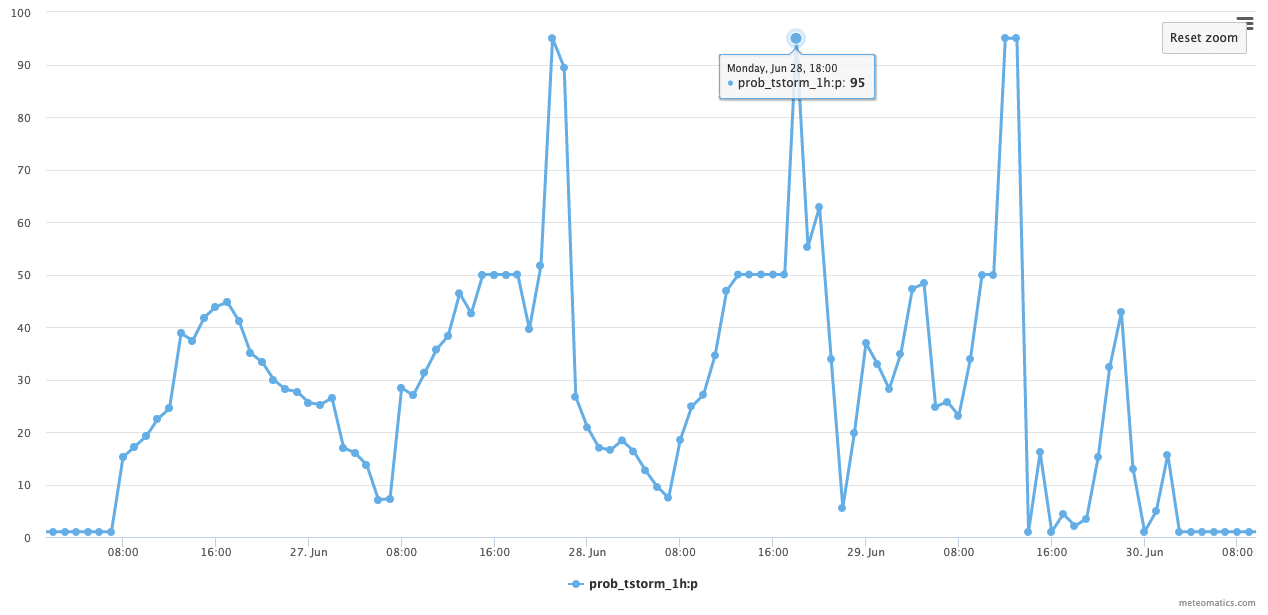
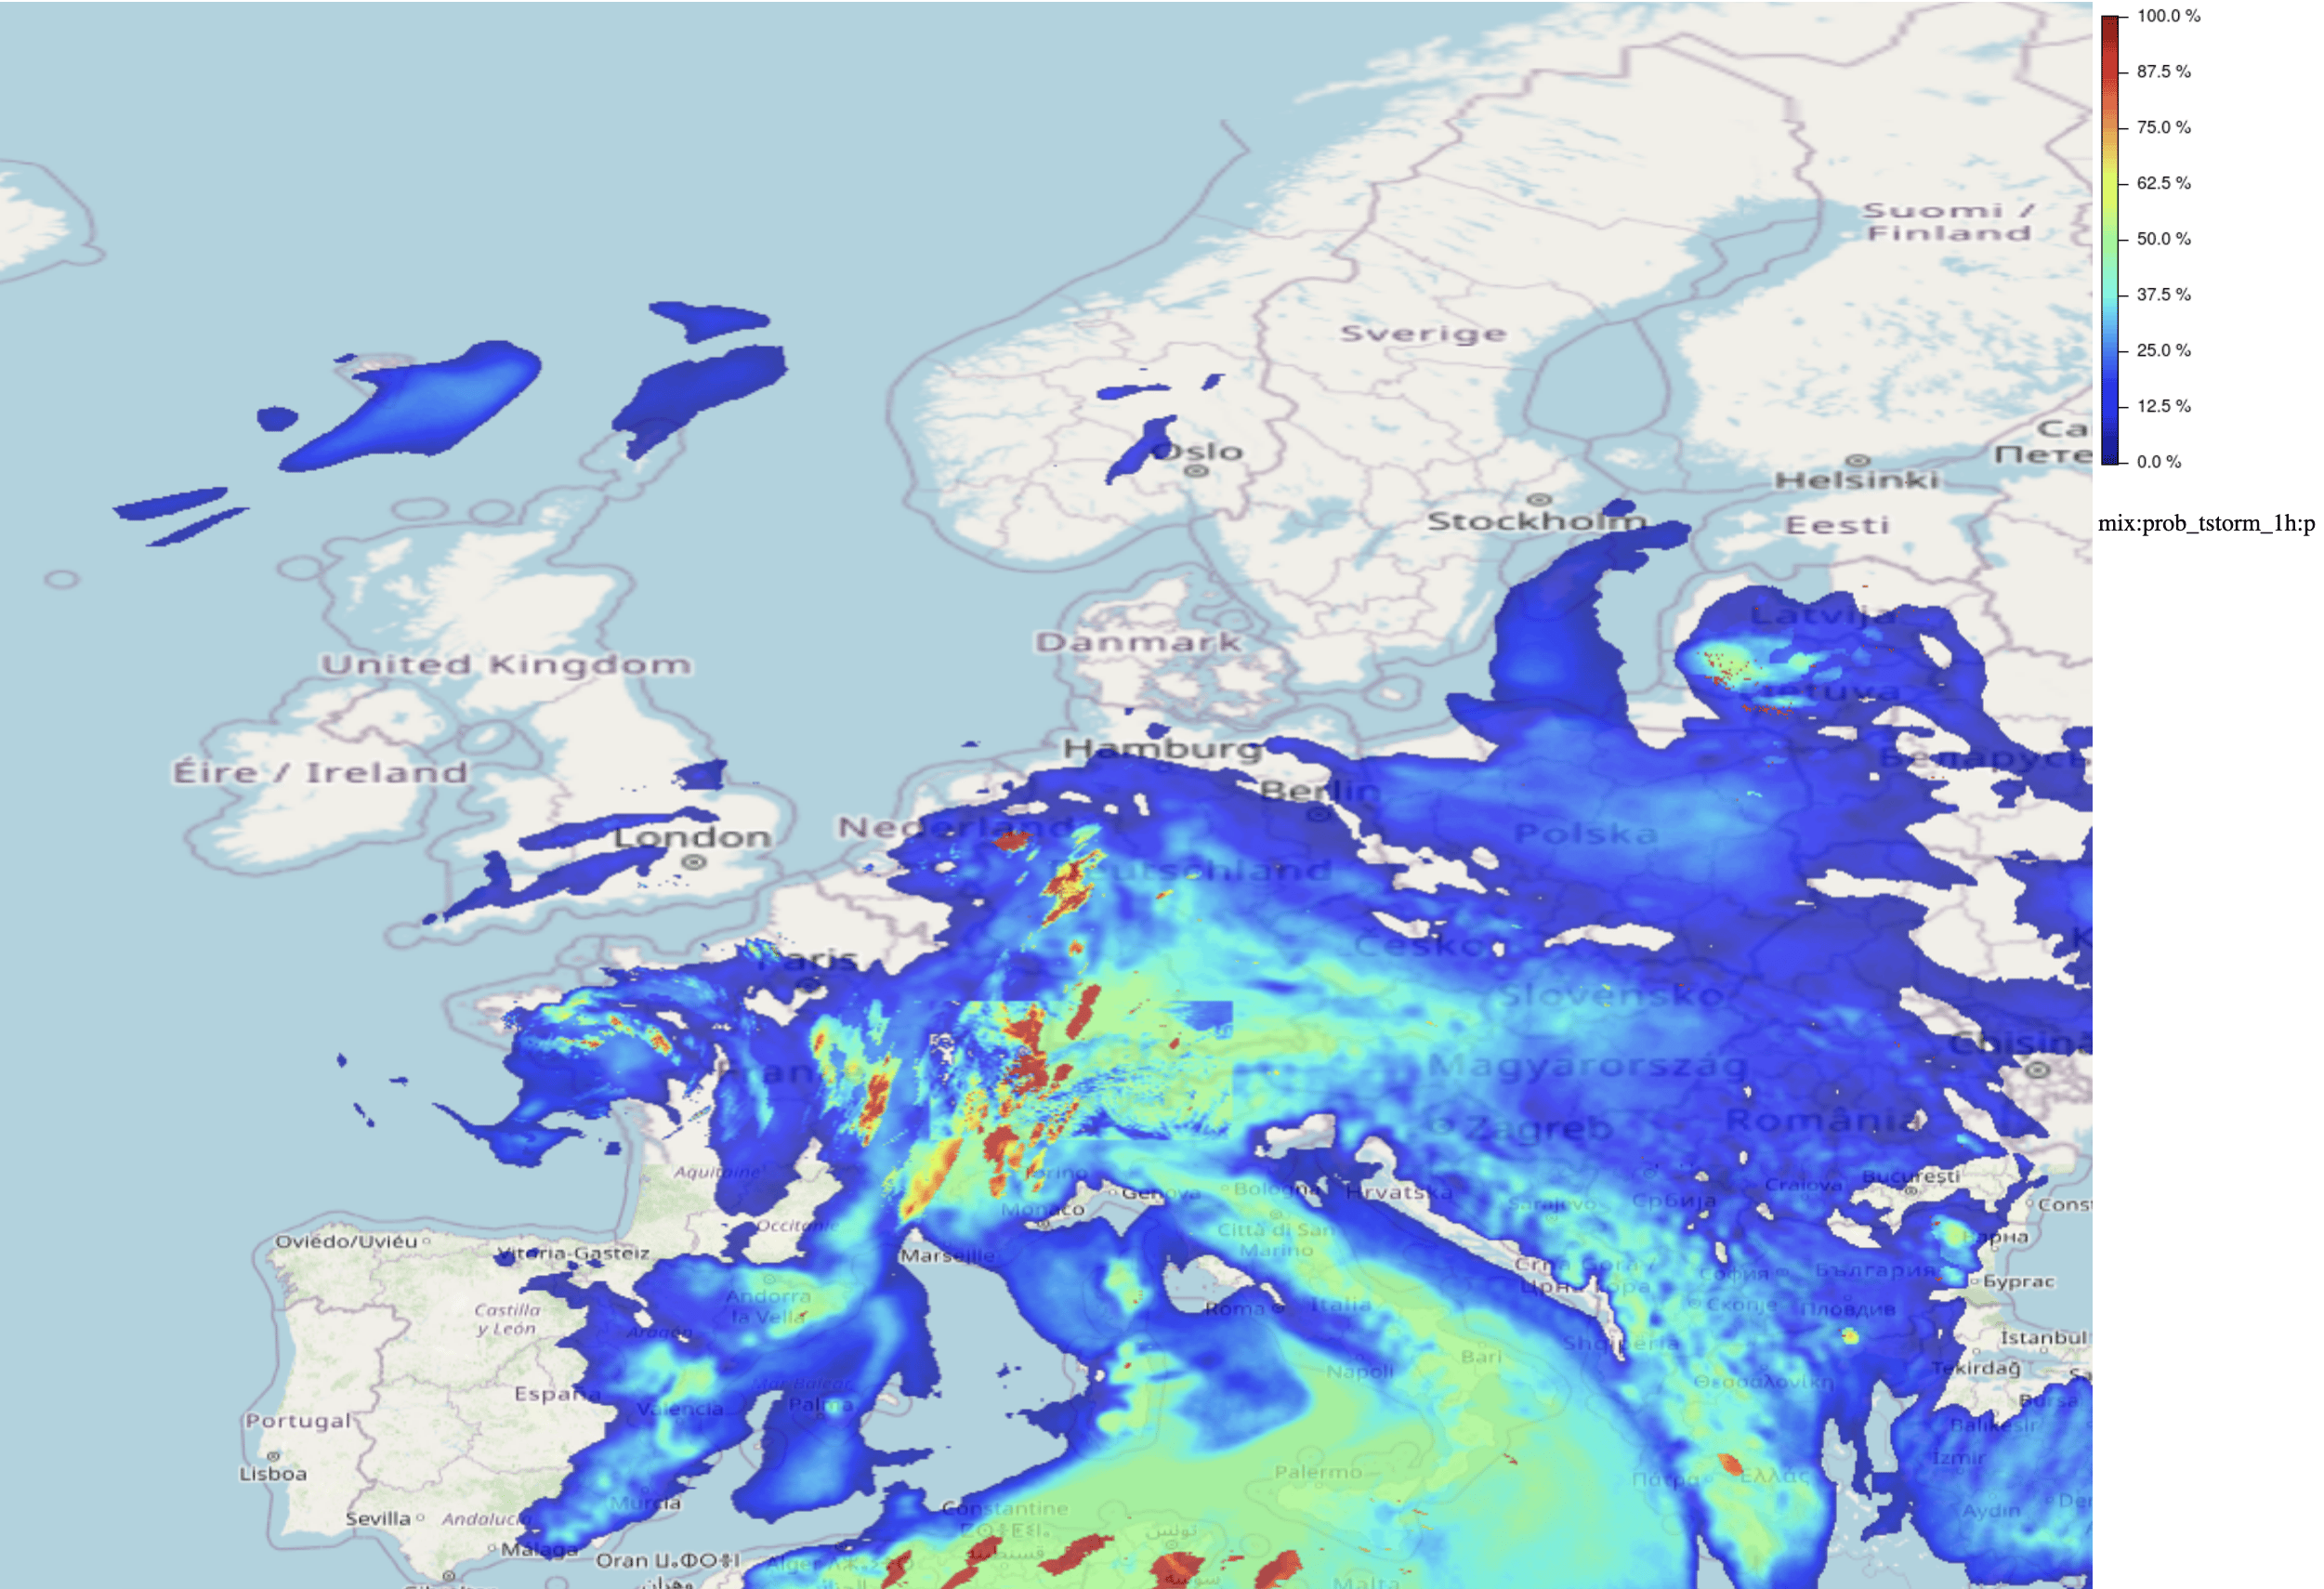
- Show a thunderstorm probability forecast for the next two days:
-
Below is an image of the thunderstorm probabilities on June 28th at 15 UTC over Europe:
https://api.meteomatics.com/now/prob_tstorm_1h:p/70,-15_35,30:0.1,0.1/html -
https://api.meteomatics.com/now/prob_tstorm_12h:p/70,-15_35,30:15,15/json
{"version":"3.0","user":"api-test","dateGenerated":"2018-02-21T14:51:41Z","status":"OK","data":
[{"parameter":"prob_tstorm_12h:p","coordinates":
[{"lat":35,"lon":-15,"dates":[{"date":"2017-08-01T00:00:00Z","value":12.9}]},
{"lat":35,"lon":0,"dates":[{"date":"2017-08-01T00:00:00Z","value":44.2}]},
{"lat":35,"lon":15,"dates":[{"date":"2017-08-01T00:00:00Z","value":23.4}]},
{"lat":35,"lon":30,"dates":[{"date":"2017-08-01T00:00:00Z","value":86.4}]},
{"lat":50,"lon":-15,"dates":[{"date":"2017-08-01T00:00:00Z","value":16.1}]},
{"lat":50,"lon":0,"dates":[{"date":"2017-08-01T00:00:00Z","value":14.3}]},
{"lat":50,"lon":15,"dates":[{"date":"2017-08-01T00:00:00Z","value":22.2}]},
{"lat":50,"lon":30,"dates":[{"date":"2017-08-01T00:00:00Z","value":11.4}]},
{"lat":65,"lon":-15,"dates":[{"date":"2017-08-01T00:00:00Z","value":11.8}]},
{"lat":65,"lon":0,"dates":[{"date":"2017-08-01T00:00:00Z","value":13.6}]},
{"lat":65,"lon":15,"dates":[{"date":"2017-08-01T00:00:00Z","value":21.5}]},
{"lat":65,"lon":30,"dates":[{"date":"2017-08-01T00:00:00Z","value":17}]}]}]}


Thunderstorm Height
Gives the height of a thunderstorm during the requested interval. A value is returned only if a thunderstorm occurence is likely. If m or ft are queried as a unit then the value above sea level is returned.
If the likelihood is none, a value of -666 is returned. In case no data is available, a value of -999 is reutrned.
tstorm_height_<interval>:<unit>Available intervals: 1h, 2h, 3h, 6h, 12h, 24h
Available units: m, ft, FL, hPa
Examples
- Thunderstorm height for the 12th of July 2023 in St. Gallen:
-
Here you can find a two day forecast for the thunderstorm height:
https://api.meteomatics.com/2025-07-11T00:00:00ZP2D:PT1H/tstorm_height_1h:m/47.412164,9.340652/html


Lightning Flash Density
The lightning flash density represents the number of lightning flashes (Intracloud and Cloud-to-Ground) per square kilometre, aggregated over a specified time interval. The parameter can be returned as the minimum, mean, or maximum value over the requested interval.
lightning_strikes_<measure>_<interval>:km2hAvailable measures: mean, min, max
Available intervals: 1h, 3h, 6h, 12h, 24h
The values are expressed in flashes per square kilometre per hour (km²/h).
Examples
-
Average lightning flash density during the last 6 hours:
lightning_strikes_mean_6h:km2h -
Maximum lightning flash density during the last 24 hours:
lightning_strikes_max_24h:km2h -
Minimum lightning flash density during the last hour:
lightning_strikes_min_1h:km2h -
Example API request:
https://api.meteomatics.com/nowP2D:PT1H/lightning_strikes_mean_1h:km2h/47.412164,9.340652/html