These indices indicate the time that has to pass until a certain percentage of the present COVID-19 concentration decays. Recent investigations showed that the decay of COVID-19 was enhanced by either increased humidity or temperature (Biryukov et al., 2020). Additionally, there is also a dependence on sunlight, which has an impact on the potential for aerosol transmission of COVID-19 (Schuit et al., 2020). The indices are based on the numbers of the SARS-CoV-2 Airborne Calculator published by Homeland Security.
Half-life of the virus outdoors in minutes:
covid_half_life:min
Time in minutes until 90% of the virus died:
covid_decay_90:min
Time in minutes until 99% of the virus died:
covid_decay_99:min
Examples:
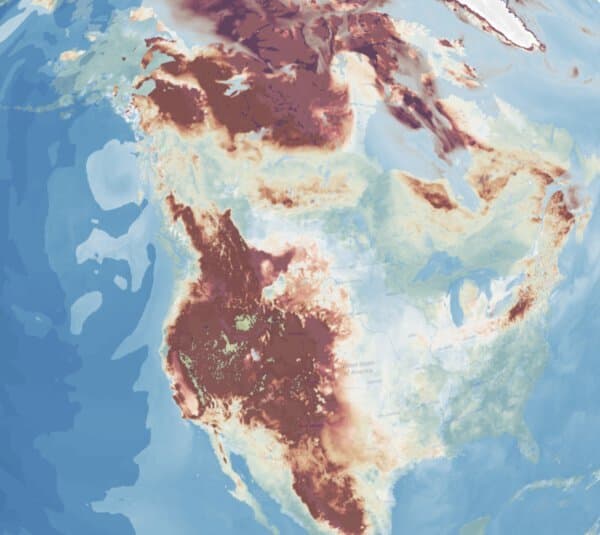
The chart below shows the 90 % decay time of COVID-19 for North America, where the influece of heat in the south-western United States on the virus' lifetime can be seen:
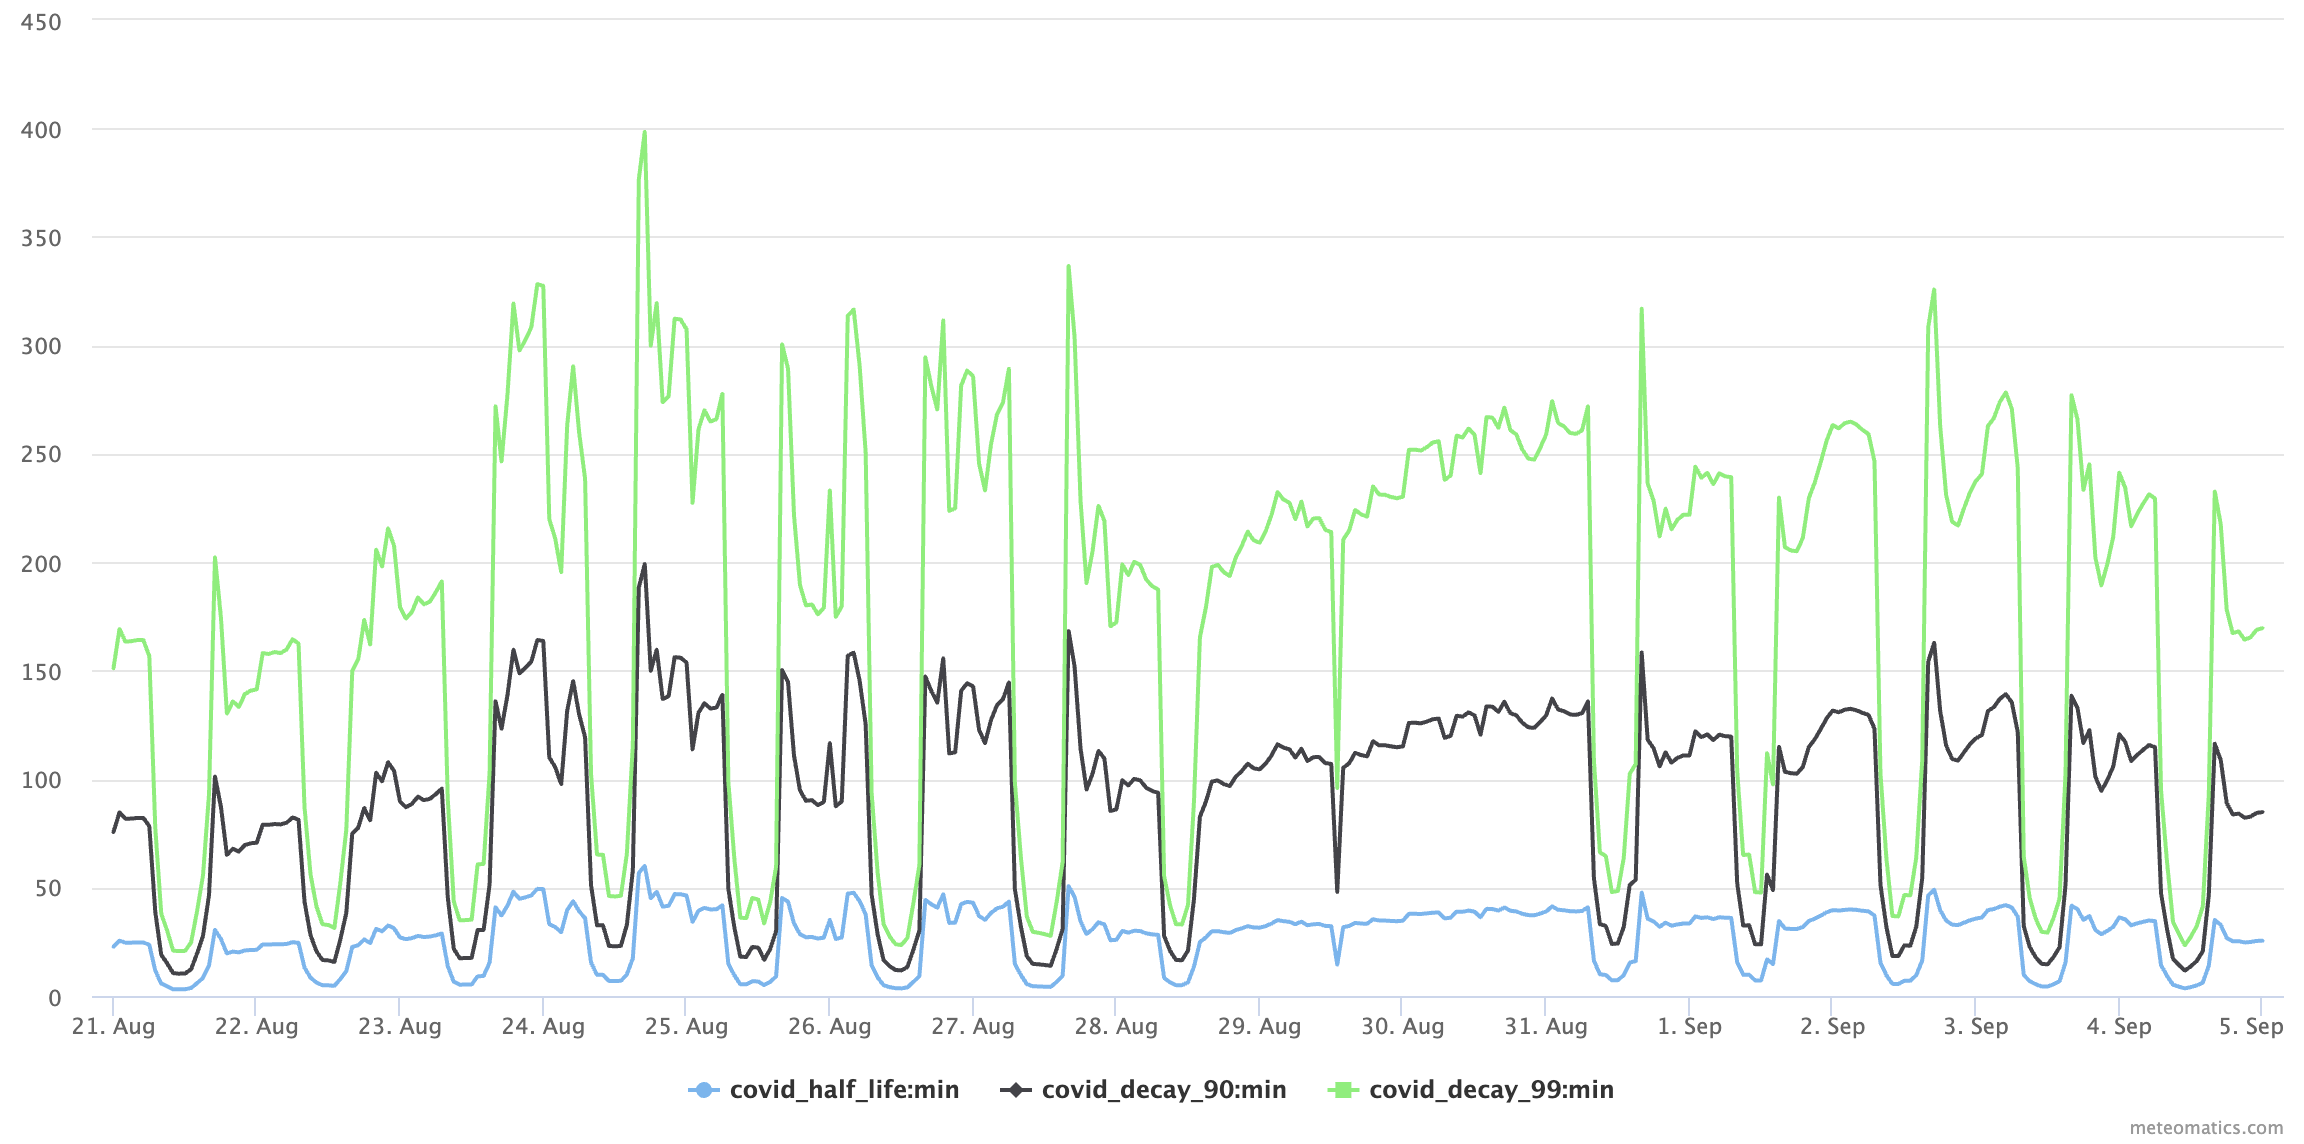
Below is a time series that shows the 90 % and 99 % decay times of COVID-19 as well as the half life time for Zurich:
Biryukov J, Boydston JA, Dunning RA, Yeager JJ, Wood S, Reese AL, Ferris A, Miller D, Weaver W, Zeitouni NE, Phillips A, Freeburger D, Hooper I, Ratnesar-Shumate S, Yolitz J, Krause M, Williams G, Dawson DG, Herzog A, Dabisch P, Wahl V, Hevey MC, Altamura LA. 2020. Increasing temperature and relative humidity accelerates inactivation of SARS-CoV2 on surfaces. mSphere 5:e00441-20. https://journals.asm.org/doi/10.1128/mSphere.00441-20
Michael Schuit, Shanna Ratnesar-Shumate, Jason Yolitz, Gregory Williams, Wade Weaver, Brian Green, David Miller, Melissa Krause, Katie Beck, Stewart Wood, Brian Holland, Jordan Bohannon, Denise Freeburger, Idris Hooper, Jennifer Biryukov, Louis A Altamura, Victoria Wahl, Michael Hevey, Paul Dabisch, Airborne SARS-CoV-2 Is Rapidly Inactivated by Simulated Sunlight, The Journal of Infectious Diseases, Volume 222, Issue 4, 15 August 2020, Pages 564–571, https://academic.oup.com/jid/article/222/4/564/5856149
Your satisfaction is our goal, which is why we use cookies. With these cookies, we enable our website to run reliably and securely, keep an eye on performance, and better engage with you.
Cookies are necessary for everything to function technically, and they allow you to access external content. Additionally, we collect data, including information about visited pages, completed purchases, or clicked buttons, to enhance our services for you.
Learn more about the services we use in the "Cookie Settings" section. By clicking "Agree and Continue", you consent to the use of these services. You can revoke or modify your consent at any time with effect for the future.