API Request
- Required Parameters: Date/Time Description | Coordinate Description | Weather Station Identifiers | Available Formats | Available Colormaps
- Optional Parameters: Overview | Source Selection | Behavior on missing or invalid Data | Ensemble Member Selection | Cluster Selection | Route Queries | Polygon Queries
- Meta Requests: Get Latest Initial Time | Get Available Time range | Get Colormap | Find Station
- User Statistics: Show User Statistics
GET requests
According to the REST1 standard, data can be queried using HTTP-GET or HTTP-POST requests fromapi.meteomatics.com.
A request can be constructed using the format:
https://api.meteomatics.com/<validdatetime>/<parameters>/<location>/<format>?<optionals>POST requests
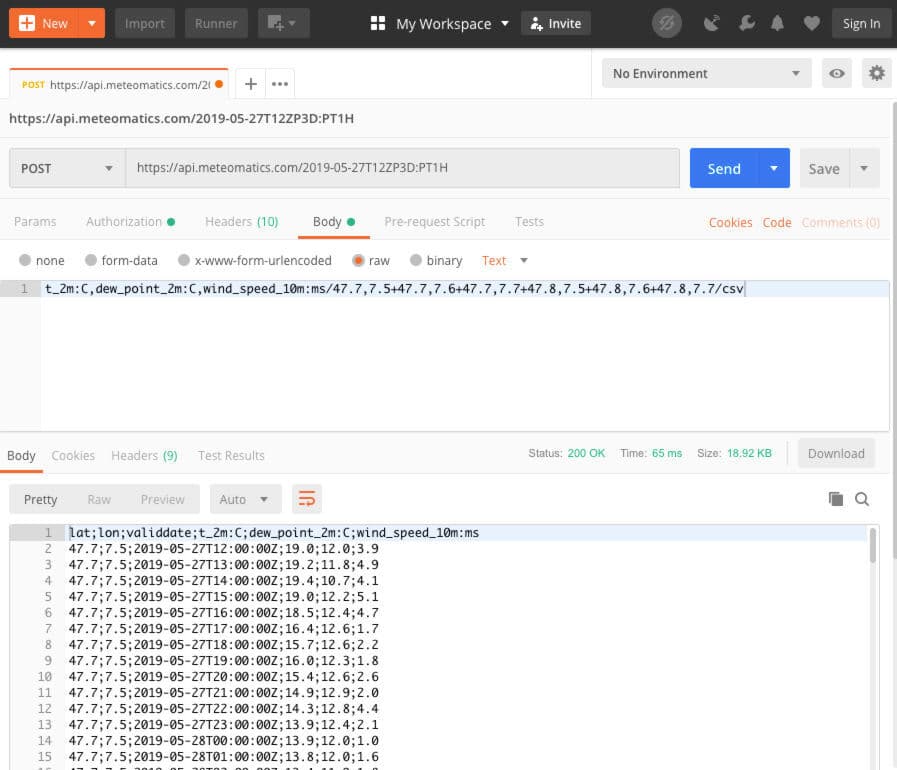
POST requests can not be performed from a browser directly but there are graphical tools that can be used to construct and test POST requests. If you are sending a POST request, which is recommended for large URL lengths (>1000 characters), follow this notation:URL: https://api.meteomatics.com/<validdatetime>/
Post-Body: <parameters>/<location>/<format>?<optionals> in plain textExample:

JSON-formatted request bodies are also supported for POST requests. For example, a POST request to
https://api.meteomatics.com can include a body like this:
{
    "validdates":"{{start_date}}P{{duration}}:P{{resolution}}",
    "parameters":["{{parameters}}"],
    "location":"{{locations}}",
    "format":"{{format}}"
}https://username:[email protected]) but not recommended since the password is sent in plain text.