Wind and Solar Power
Wind Power | Solar PowerWind Power
This parameter gives the wind power in kW and MW for more than 800 turbine models of several manufacturers with hub heights ranging from 10 m to 20 000 m.
wind_power_turbine_<turbine_id>_hub_height_<height>:<unit>Available turbines: Turbine List (please contact us if the turbine you need is missing)
Available heights: continuous from 10m to 20000m
Available units: MW, kW
Examples
- Examples for available turbines (and the respective query parameters) are:
wind_power_turbine_enercon_e101_3000_hub_height_110m:MW wind_power_turbine_aaer_a1000_1000_hub_height_110m:MW wind_power_turbine_siemens_swt_3_0_101_3000_hub_height_110m:MW wind_power_turbine_vestas_v100_1800_hub_height_110m:MW - Comparison of different turbines:
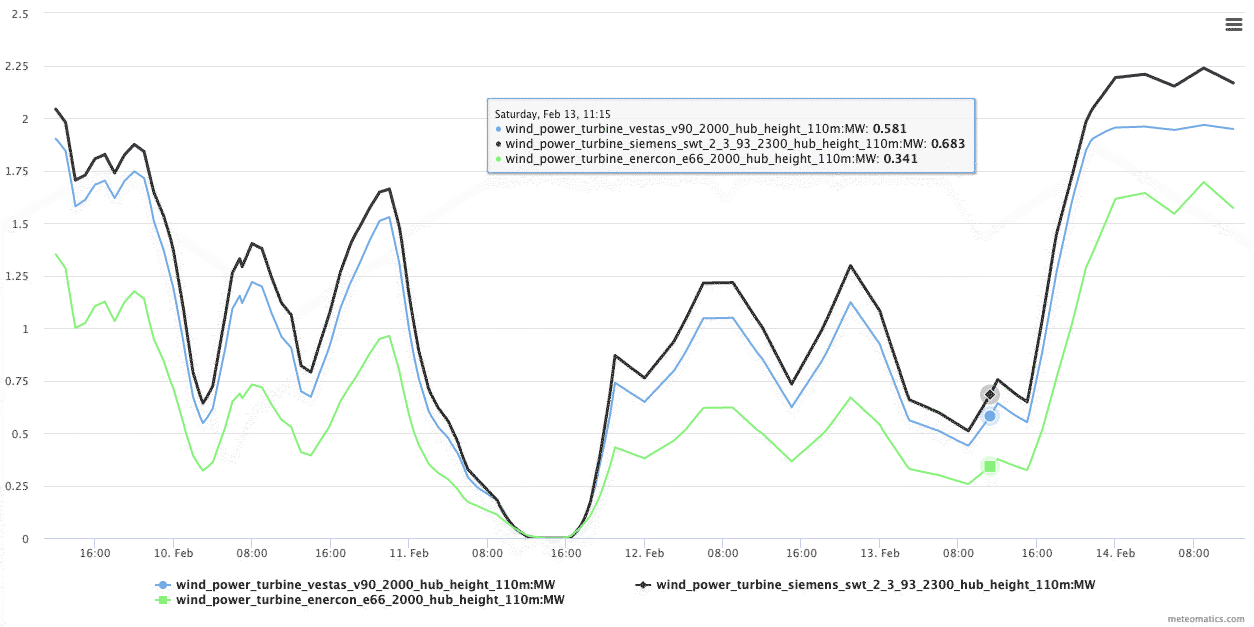
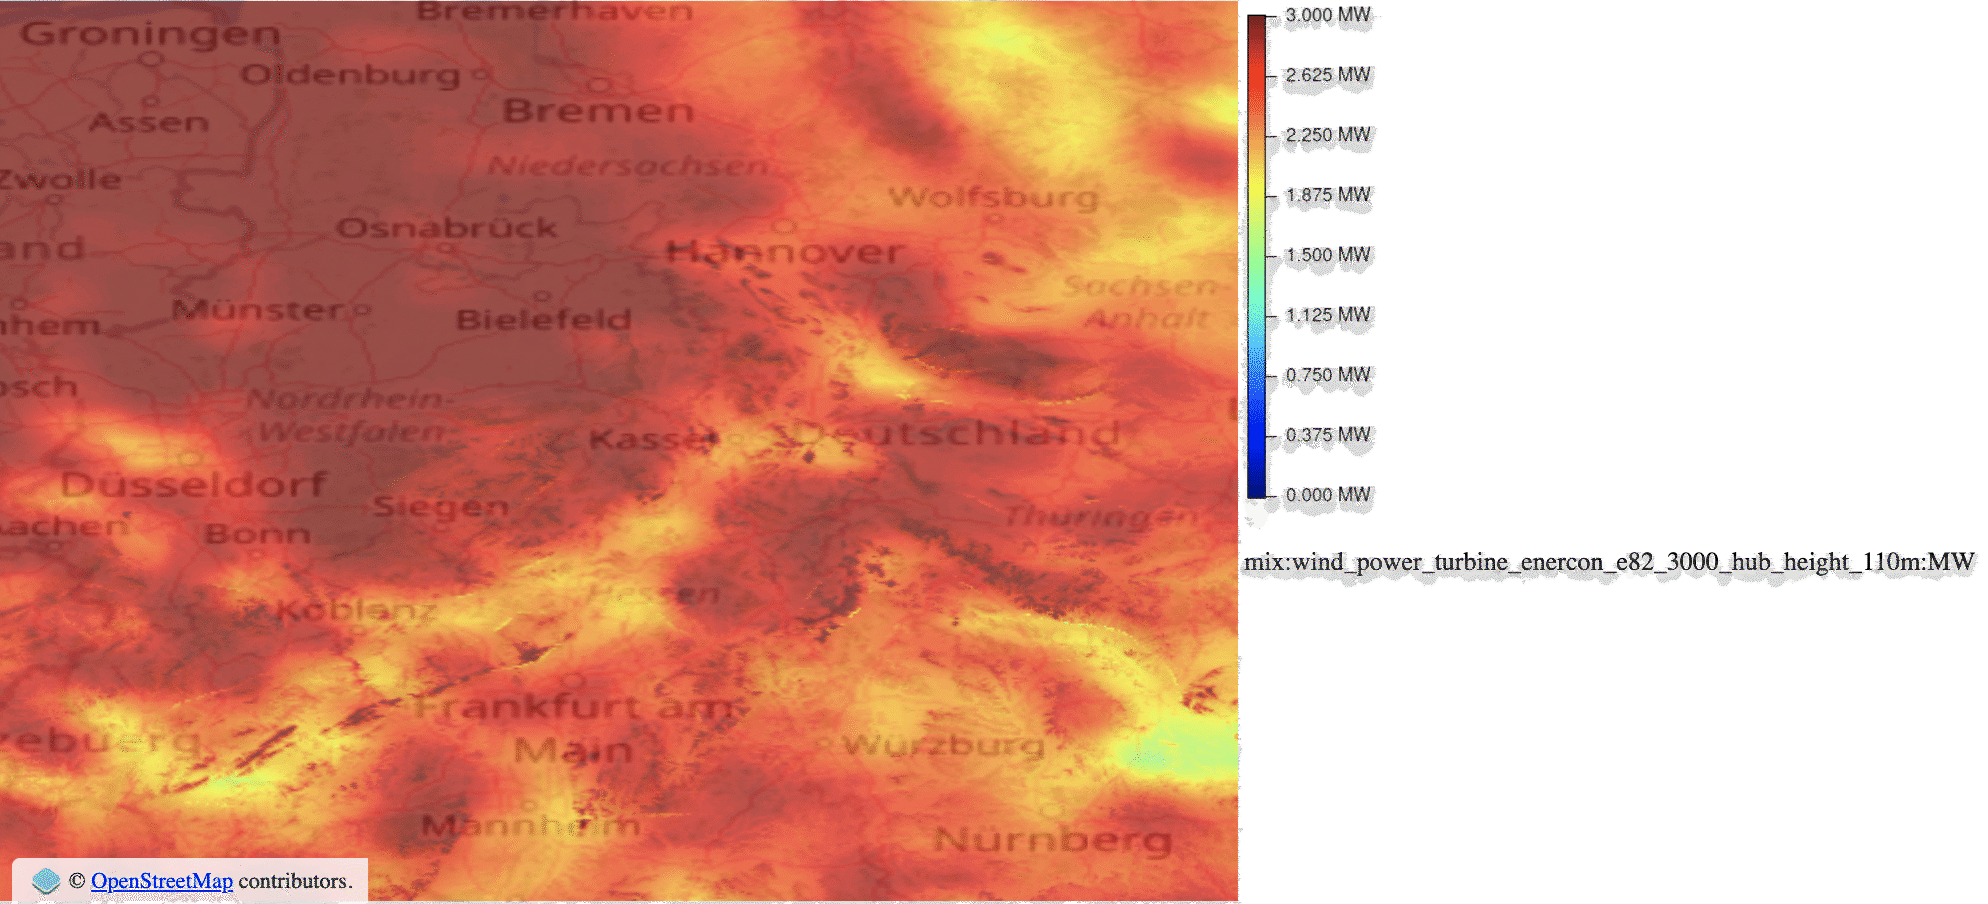
https://api.meteomatics.com/2026-07-30T12:00:00Z--2026-08-04T12:00:00Z:PT15M/wind_power_turbine_vestas_v90_2000_hub_height_110m:MW,wind_power_turbine_siemens_swt_2_3_93_2300_hub_height_110m:MW,wind_power_turbine_enercon_e66_2000_hub_height_110m:MW/53.645859,5.449016/html - Create an HTML map showing the wind power of the turbine enercon_e82_3000 at hub height 110 meters.
https://api.meteomatics.com/2026-07-30Z/wind_power_turbine_enercon_e82_3000_hub_height_110m:MW/53.5,5.8_49,12:0.01,0.01/html_map - The corresponding JSON file:
{
 "version": "3.0",
 "user": "api-test",
 "dateGenerated": "2021-03-22T07:44:19Z",
 "status": "OK",
 "data": [
 {
 "parameter": "wind_power_turbine_vestas_v90_2000_hub_height_110m:MW",
 "coordinates": [
 {
 "lat": 53.64586,
 "lon": 5.449016,
 "dates": [
 {
 "date": "2021-03-22T12:00:00Z",
 "value": 0.177
 },
 {
 "date": "2021-03-22T12:15:00Z",
 "value": 0.225
 },

 "date": "2021-03-22T19:45:00Z",
 "value": 0.462
 },

 ...

 {
 "date": "2021-03-27T11:45:00Z",
 "value": 2
 },
 {
 "date": "2021-03-27T12:00:00Z",
 "value": 2
 }
 ]
 }
 ]
 }
 ]
}


Solar Power
Solar power in kW and MW for different tracking types, panel orientations (tilts), and efficiencies. Additionally, topographic shading is taken into account by using a digital terrain model.
solar_power<specifications>:<unit>Available units: kW, MW
Available specifications:
Capacity
The installed capacity in MW, defaults to 1 MW. Specified as:
installed_capacity_<capacity>Panel tilt
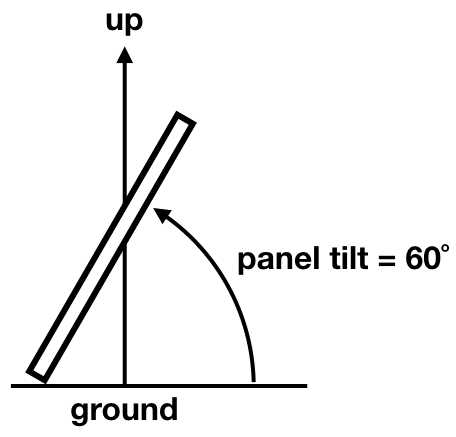
The panel tilt is given in degrees, a panel tilt of 0˚ means that the panel is facing straight up, a panel tilt of 90˚ means the panel is facing the horizon.
Defaults to 25˚. Specified as:
tilt_<tilt>
Panel orientation
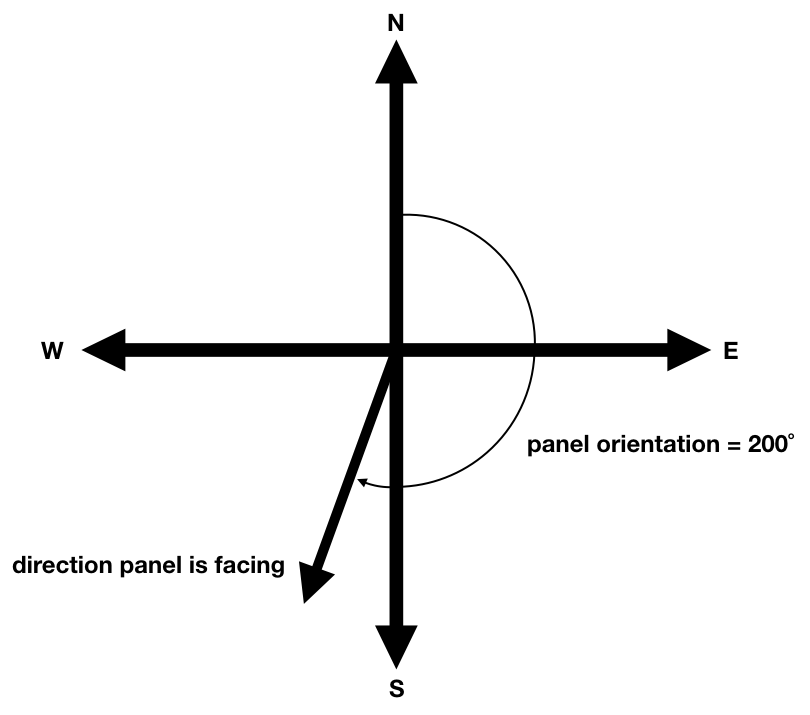
The panel orientation is given in degrees, where 0˚ means the panel is facing north, 90˚ means east, 180˚ south, 270˚ west.
Defaults to 180˚. Specified as:
orientation_<orientation>
Tracking types
-
Fixed: the panel is fixed on both axes. The fixed orientation and tilt can be specified in the query.
tracking_type_fixed -
Azimuth tracking: the tilt is fixed and can be specified in the query while the panel orientation is
variable (the orientation follows the position of the sun).
tracking_type_azimuth-tracking -
Tilted north-south tracking (also known as polar aligned single
axis tracking): the panel tilt equals its latitude. If the panel is on the
northern hemisphere and the panel orientation is set to south (180),
the panel rotates around the axis pointing towards the polar
star. The maximum panel rotation is capped at +- 80 degrees from
noon position.
tracking_type_tilted-north-south-tracking -
Tilted single-axis tracking:
The panel rotates around its tilt axis to follow the sun.
If the tilt is set to the panel's latitude, the results are
similar to tilted north-south tracking except at low sun
elevations (morning and evening) as the maximum panel rotation is
set to +- 50 degrees from noon position. Tilt and orientation can be fixed
tracking_type_tilted-single-axis-tracking -
Full tracking: tilt and orientation are variable, the panel is always facing the sun.
tracking_type_full-tracking
Critical snow depth
If the snow depth is bigger than this value (in cm), the production is started to be damped with a ~1/R relationship, where R is the radiation (see image). The production is lowered by the amount of radiation that can not penetrate the snow cover.
A value of 0 means that the panel will always be assumed to be free of snow. Defaults to 1.5. Specified as:
critical_snowdepth_<value>Note
To generate solar power forecasts with lead times > 45 days, the parameter critical snow depth must be set to 0.
Examples
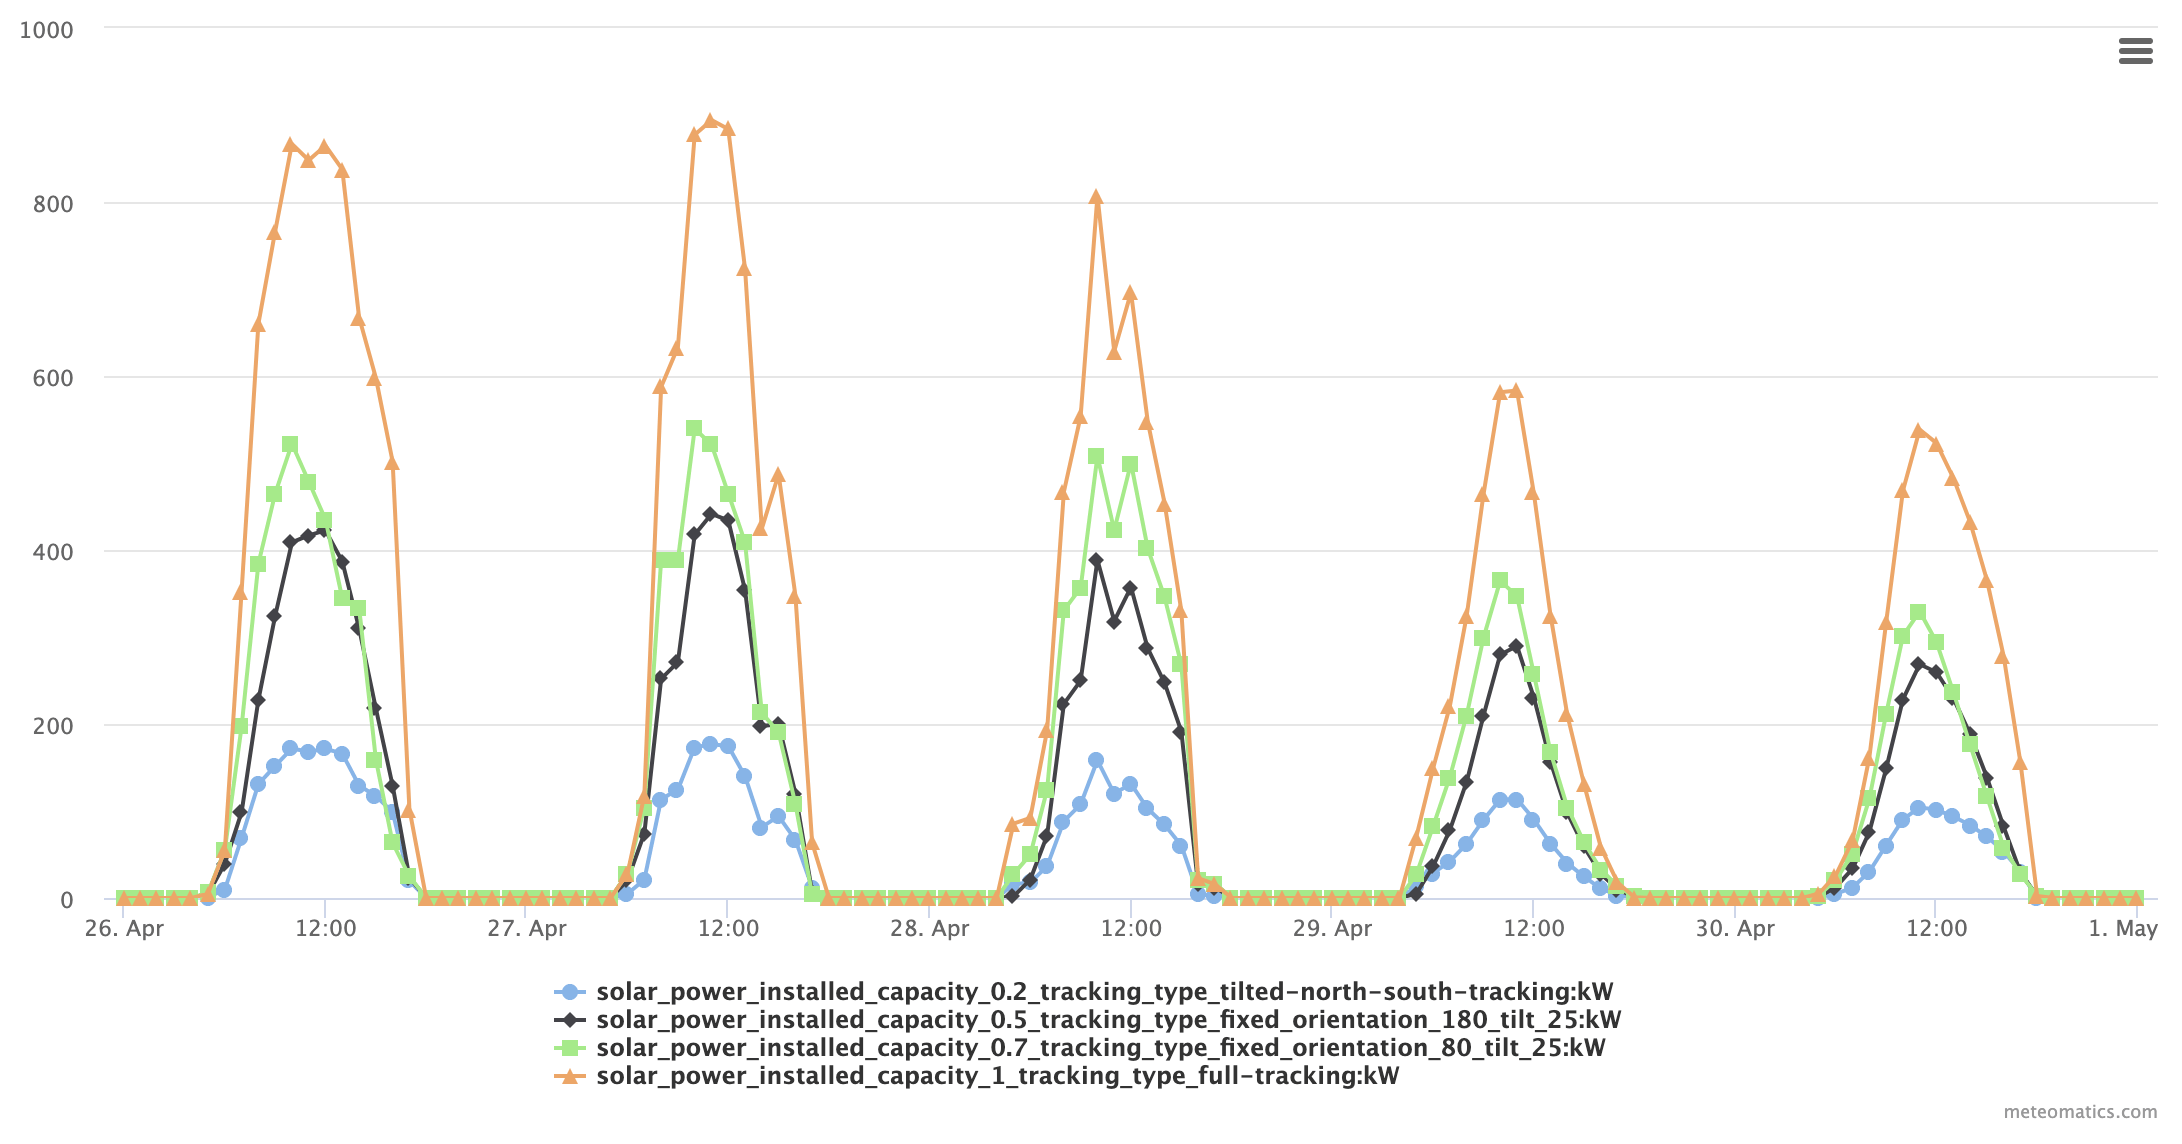
- Time series comparing different installed capacities, tilts and tracking types:
https://api.meteomatics.com/2026-07-30T00:00:00Z--2026-08-04T00:00:00Z:PT1H/solar_power_installed_capacity_0.2_tracking_type_tilted-north-south-tracking:kW,solar_power_installed_capacity_0.5_tracking_type_fixed_orientation_180_tilt_25:kW,solar_power_installed_capacity_0.7_tracking_type_fixed_orientation_80_tilt_25:kW,solar_power_installed_capacity_1_tracking_type_full-tracking:kW/47.427660,9.378648/html - The CSV output for the solar power for the next three days:
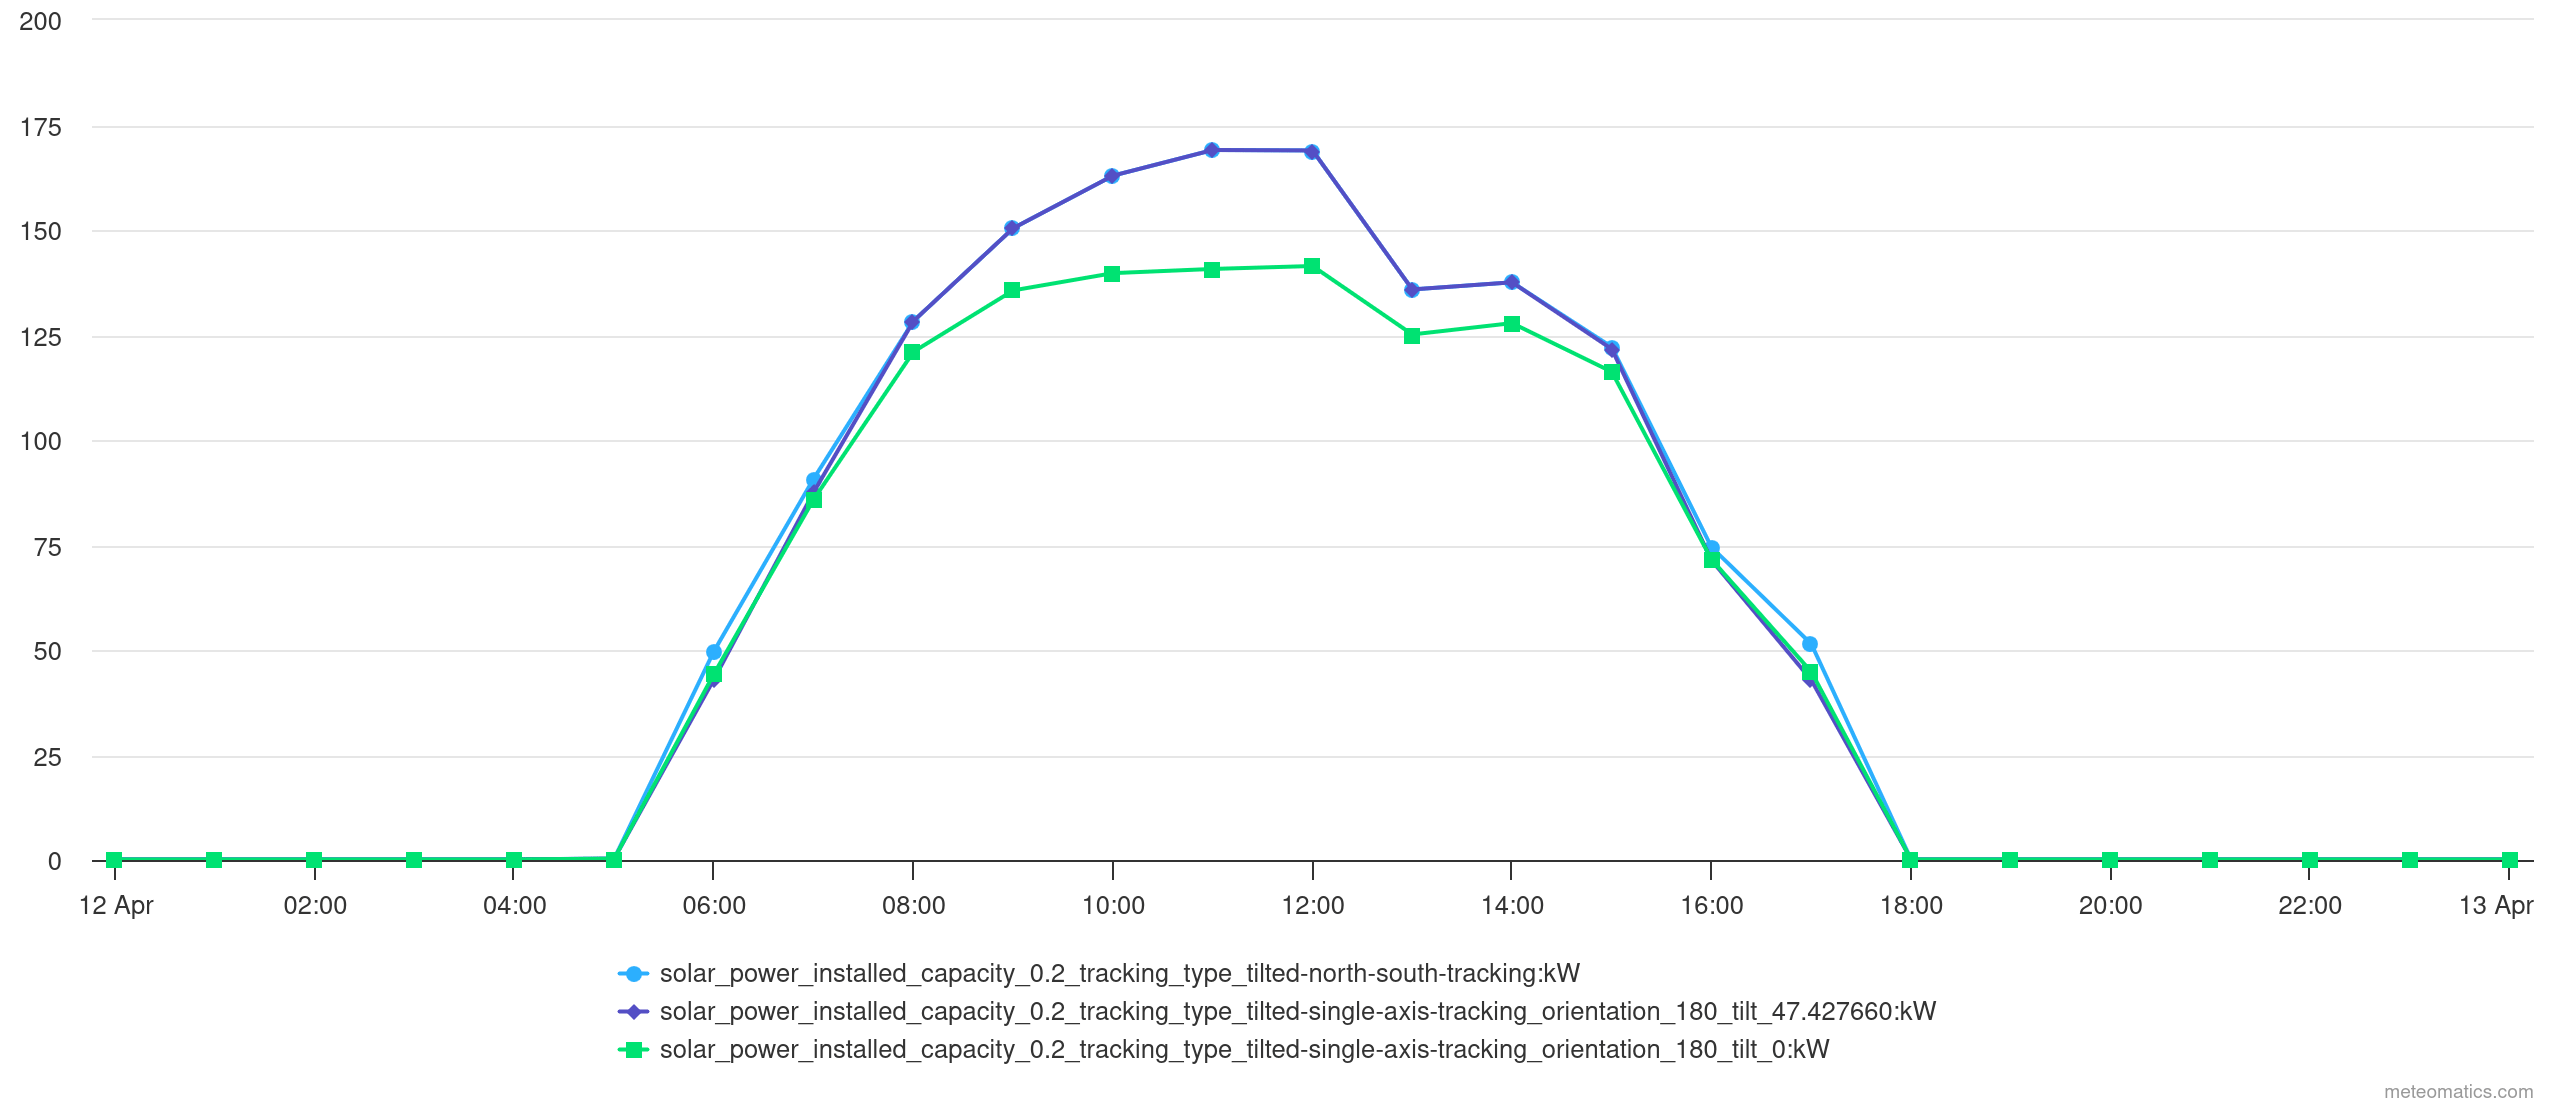
https://api.meteomatics.com/2026-07-30T00:00:00Z--2026-08-02T00:00:00Z:PT2H/solar_power_orientation_180_tilt_25:kW/47.427660,9.378648/csvvaliddate;solar_power_orientation_180_tilt_25:MW 2017-08-01T00:00:00Z;0 2017-08-01T02:00:00Z;0 2017-08-01T04:00:00Z;0 2017-08-01T06:00:00Z;0.065 2017-08-01T08:00:00Z;0.396 2017-08-01T10:00:00Z;0.829 2017-08-01T12:00:00Z;0.906 2017-08-01T14:00:00Z;0.661 2017-08-01T16:00:00Z;0.169 2017-08-01T18:00:00Z;0.009 2017-08-01T20:00:00Z;0 2017-08-01T22:00:00Z;0 2017-08-02T00:00:00Z;0 - Time series showing the equality of tilted north-south tracking and tilted single-axis tracking with tilt set to the latitude for high sun elevation (times close to solar noon) https://api.meteomatics.com/2024-04-12T00:00:00Z--2024-04-13T00:00:00Z:PT1H/solar_power_installed_capacity_0.2_tracking_type_tilted-north-south-tracking:kW,solar_power_installed_capacity_0.2_tracking_type_tilted-single-axis-tracking_orientation_180_tilt_47.427660:kW,solar_power_installed_capacity_0.2_tracking_type_tilted-single-axis-tracking_orientation_180_tilt_0:kW/47.427660,9.378648/html
-
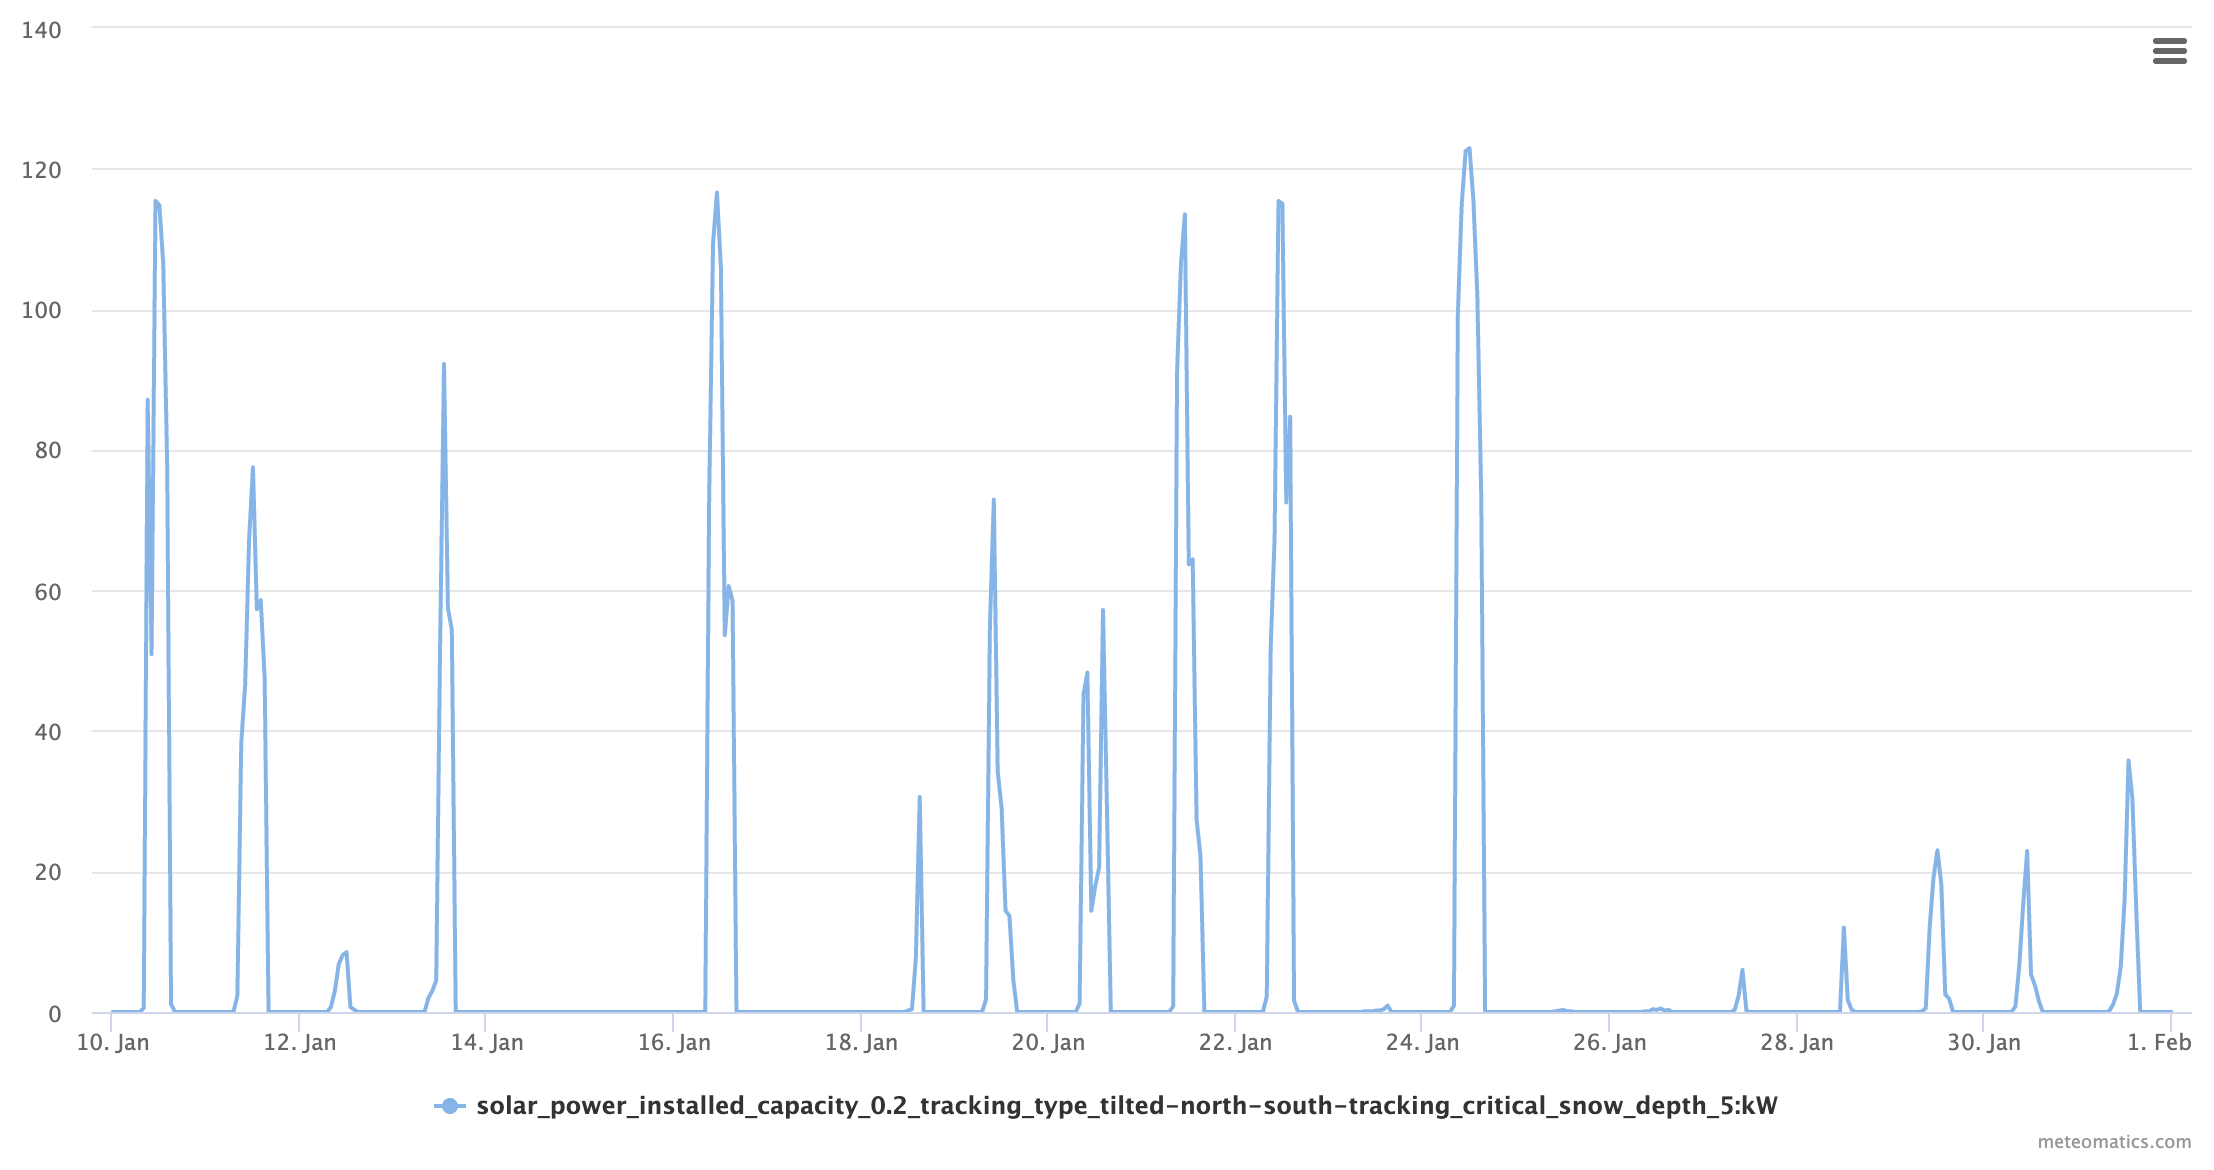
Time series during snowy conditions in January 2021 including a critical snow depth of 5 cm:
https://api.meteomatics.com/2026-07-30T00:00:00Z--2026-08-04T00:00:00Z:PT1H/solar_power_installed_capacity_0.2_tracking_type_tilted-north-south-tracking_critical_snowdepth_5:kW/47.427660,9.378648/html