Data Connectors
We provide connectors for several programming languages and programs to simplify the integration of the data into existing workflows. Please contact us for access to specific connectors or if you require a connector for a language or program that is not yet listed.
- ArcGIS
- C++
- Excel
- Go
- Google Maps
- Google Spreadsheet
- Java
- JavaScript
- Julia
- Kotlin
- Matlab
- PHP
- Postman
- Power BI
- Python
- Qlik
- QGIS
- R
- Rust
- Swift
- Tableau
ArcGIS
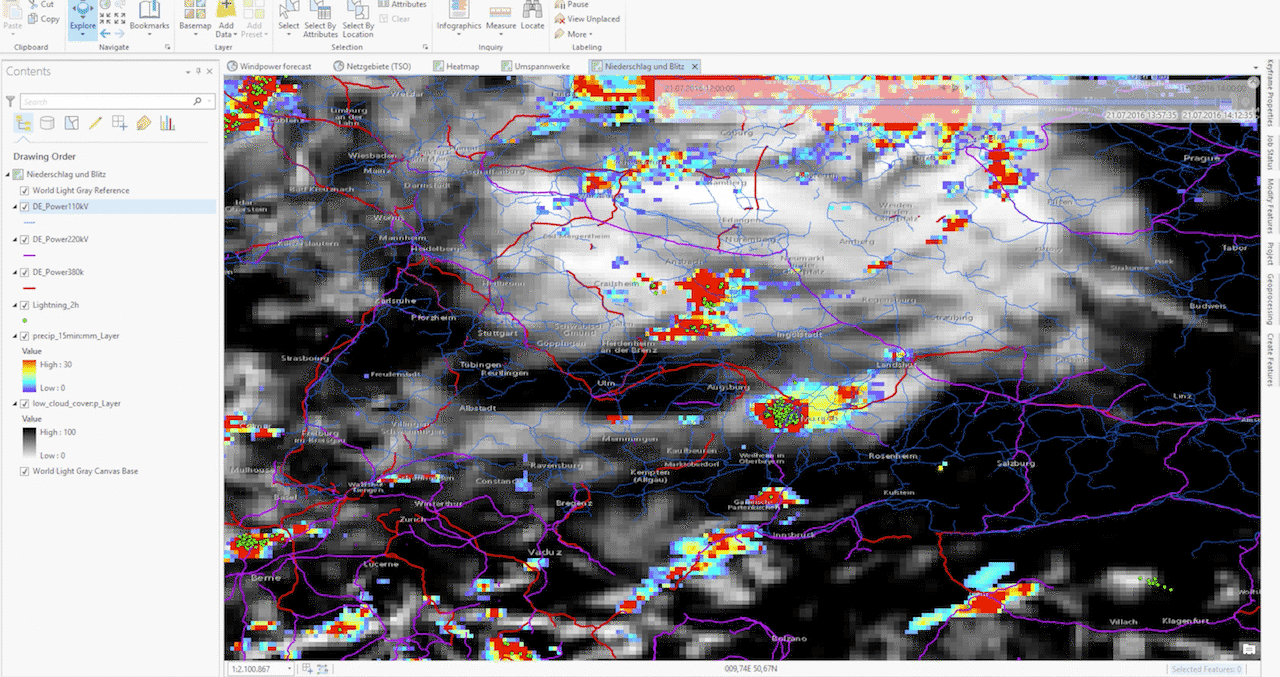
ArcGIS is the de facto standard of geo information systems (GIS). Thanks to WMS and WFS capability, arbitrary data layers can be easily integrated into your personal ArcGIS application. For instance, the following example shows real-time radar images, satellite images, and lightning data with the power line network of a major transmission system operator. A time slider allows operators to see past and short-term forecasted data, which enables them to estimate the impacts of severe storms to their infrastructure. As well as the aforementioned variables like radar, satellite, and lightning data, the weather API provides short-term forecasts (nowcasts) in 5-minutes resolution.
Please refer to ArcGIS (WMS) or ArcGIS (WFS) for further instructions on how to use our API in ArcGIS.

ArcGis Online
The following link shows an example how the API is used in ArcGIS Online:
https://www.arcgis.com/home/webmap/viewer.html?webmap=d0cdbda4e13c418da23c8aa86867166e

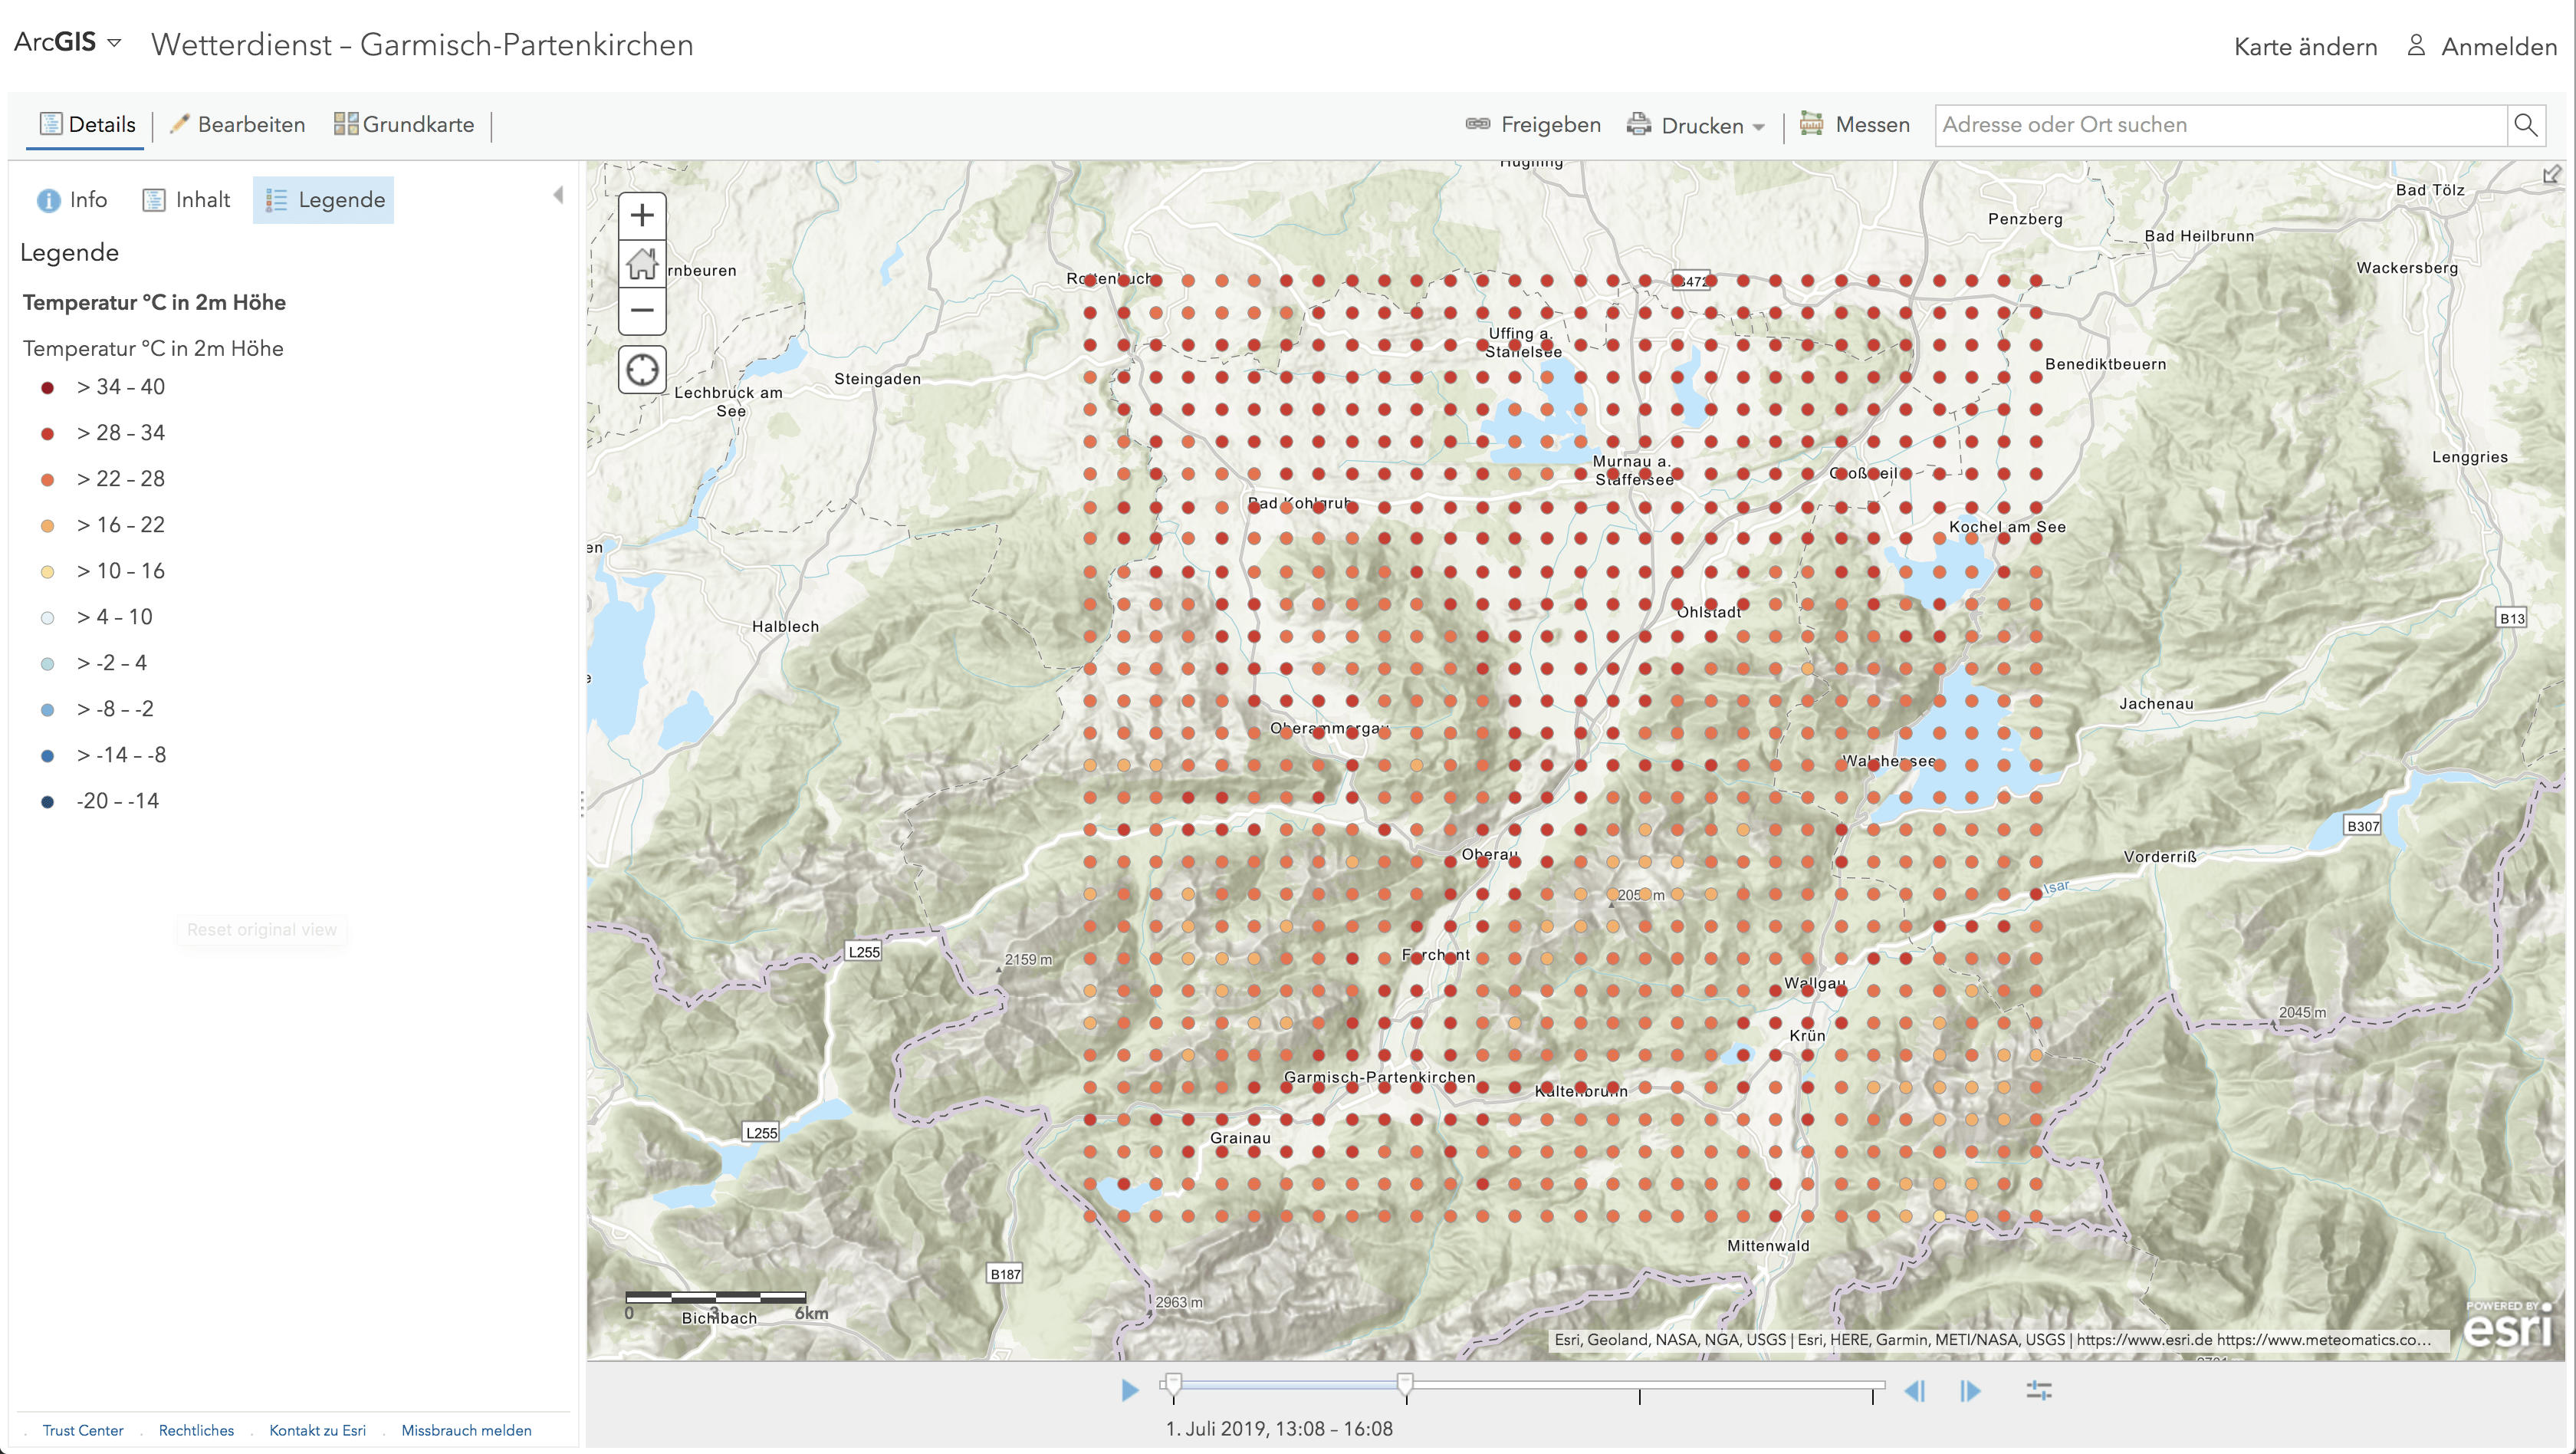
In this example a layer containing the temperature grid is added to a map showing the region around Garmisch-Partenkirchen.
C++
C++ is our preferred internal language for high performance applications. The C++-API connector also supports binary communication to our API, which is to be preferred for large amounts of data.
Use the link below to access the most recent version of our C++ Weather API Connector:
http://github.com/meteomatics/cpp-connector-api
Excel
You can use Microsoft Excel for easy and convenient access to weather data. This functionality can be used to do your own analysis of your business' dependence on weather, e.g. how rain could affect sales activities, a marketing event, or wind farm maintenance.

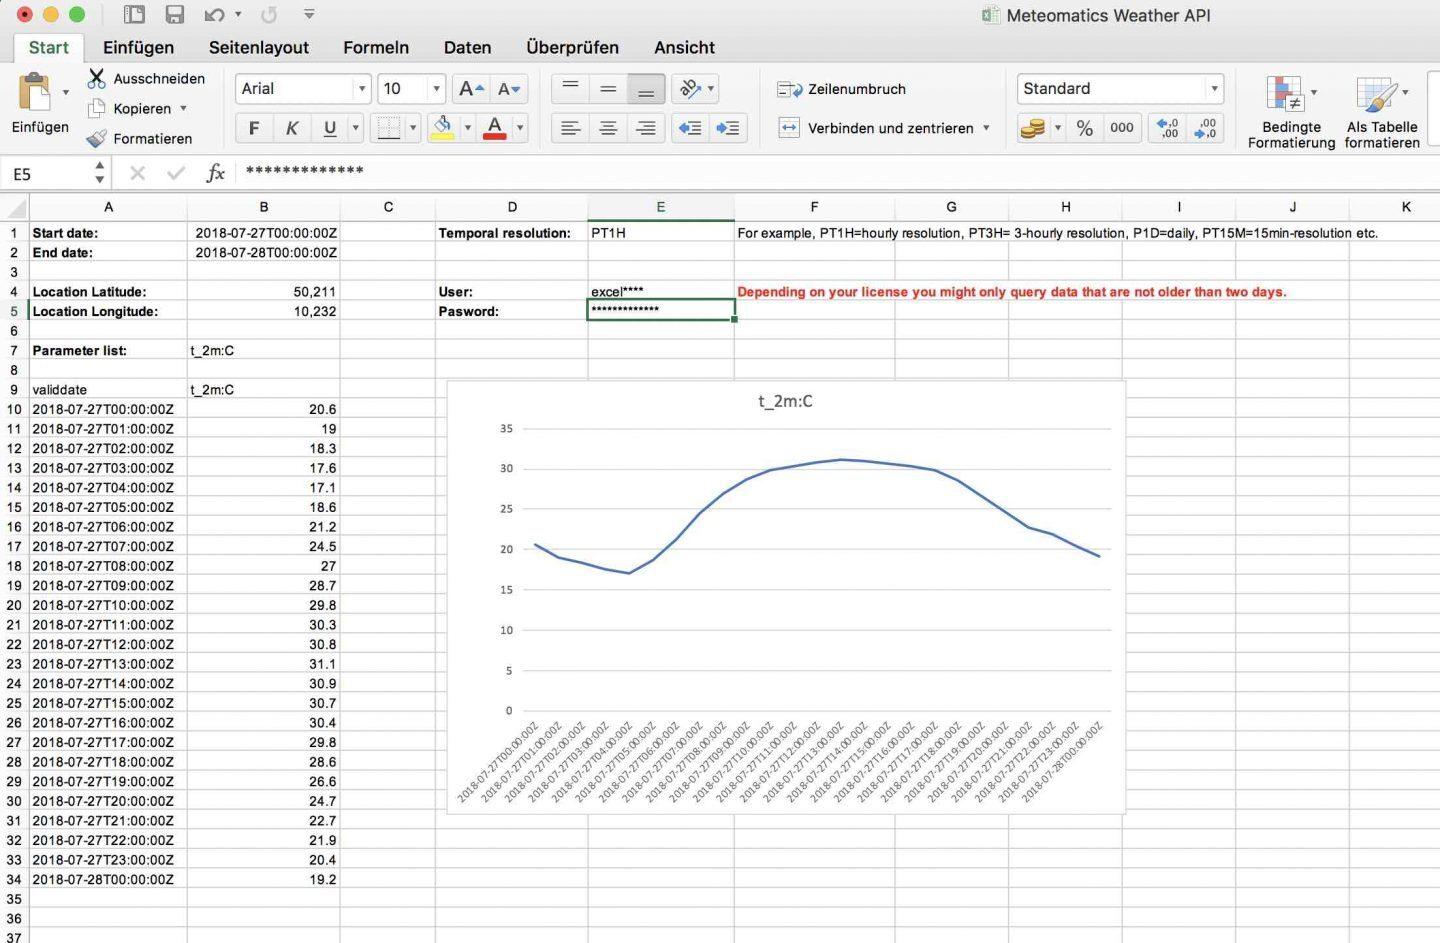
Please contact us for the most recent version of the Excel weather API connector.
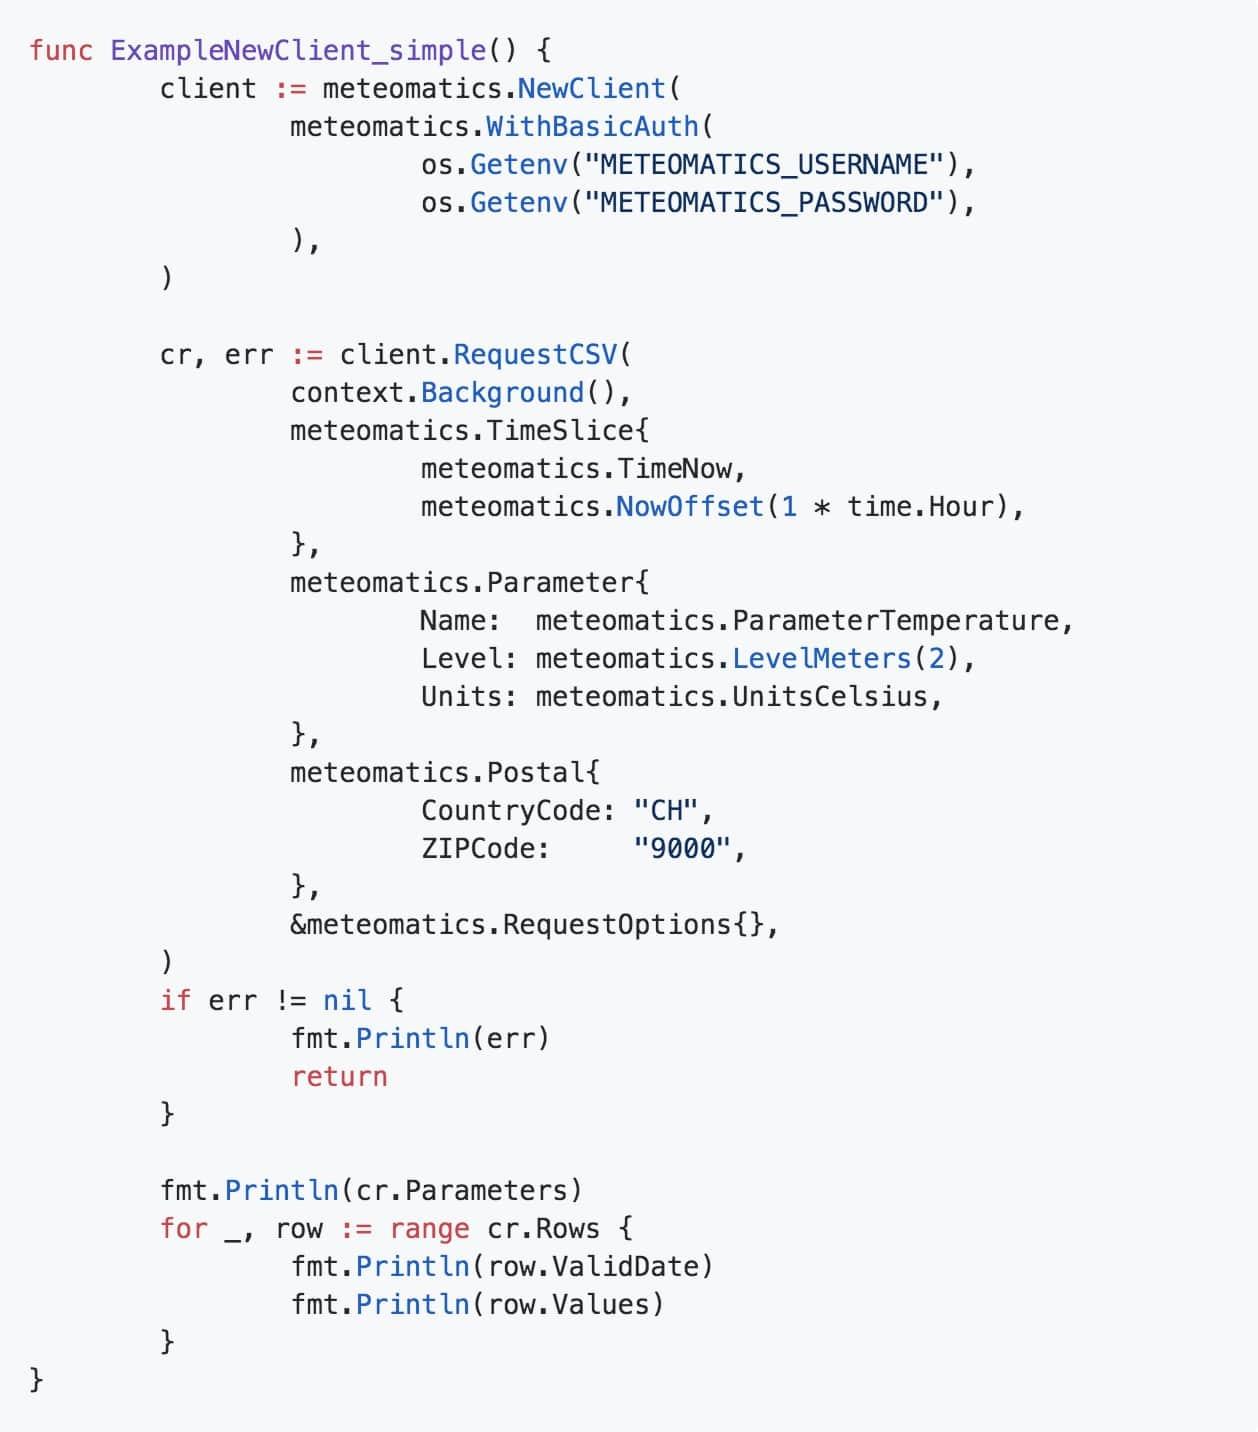
Go Connector
Go is a programming language designed by Google. The structure of Go is related to C, but with greater simplicity. Thanks to members of the data science community, a Go connector for accessing all kinds of meteorological data is now available. The connector supports CSV, JSON and PNG requests.

The connector as well as descriptions and examples can be downloaded from the following GitHub repository:
https://github.com/twpayne/go-meteomatics
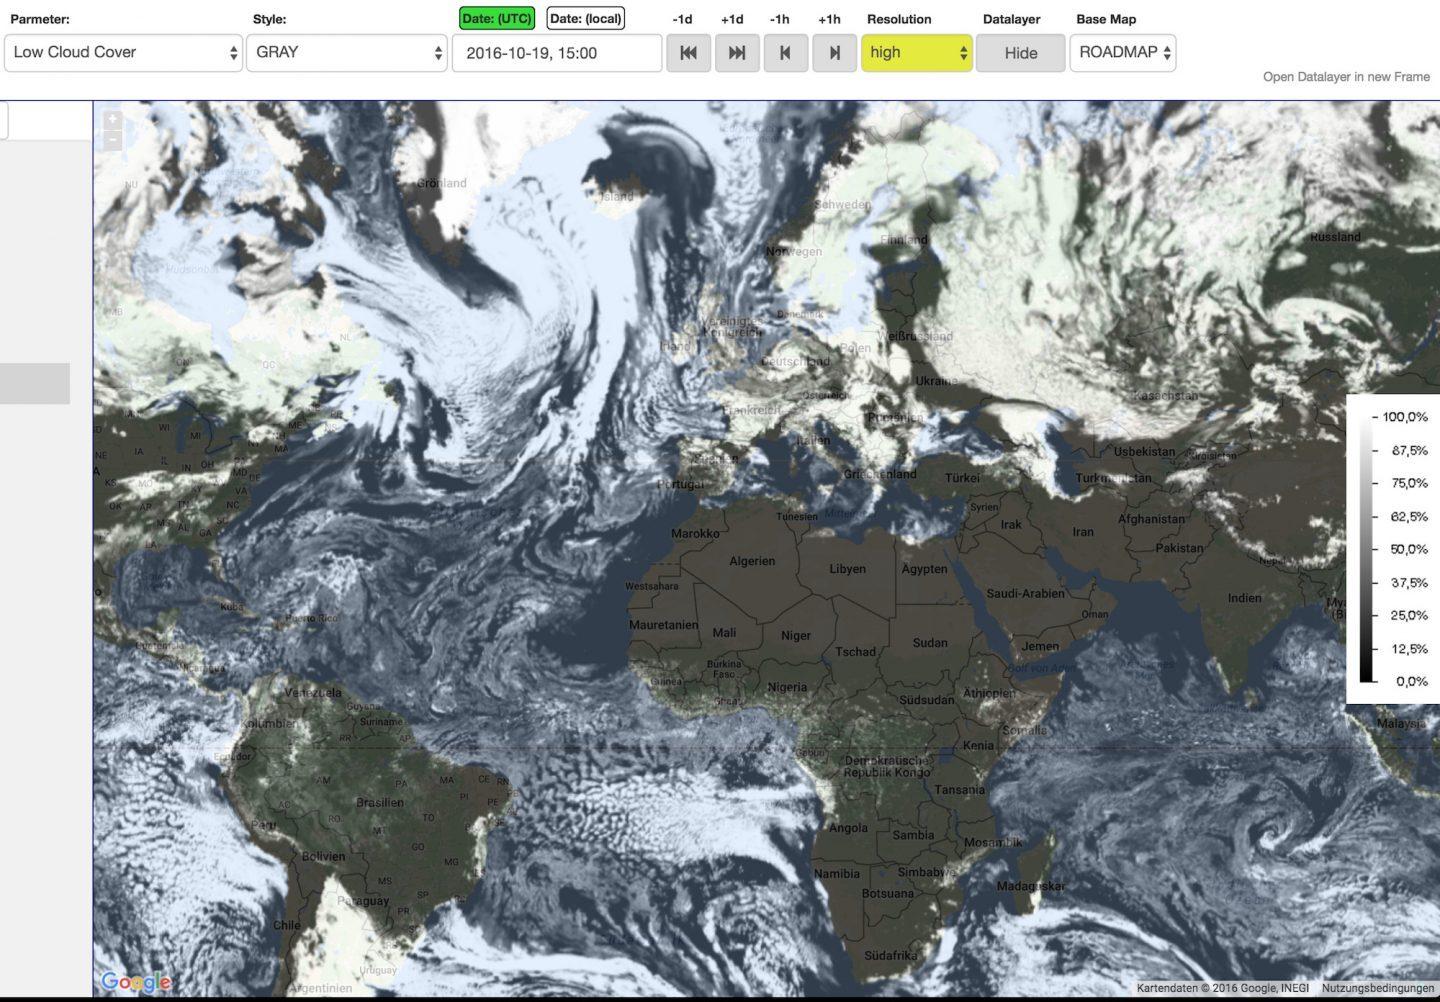
Google Maps
With Google Maps you have the possibility to have an overlook over the entire world. Our Weather API is WMS-compatible and easy to integrate into Google Maps.
In the picture you can see the integration of the Weather API into Google Maps.

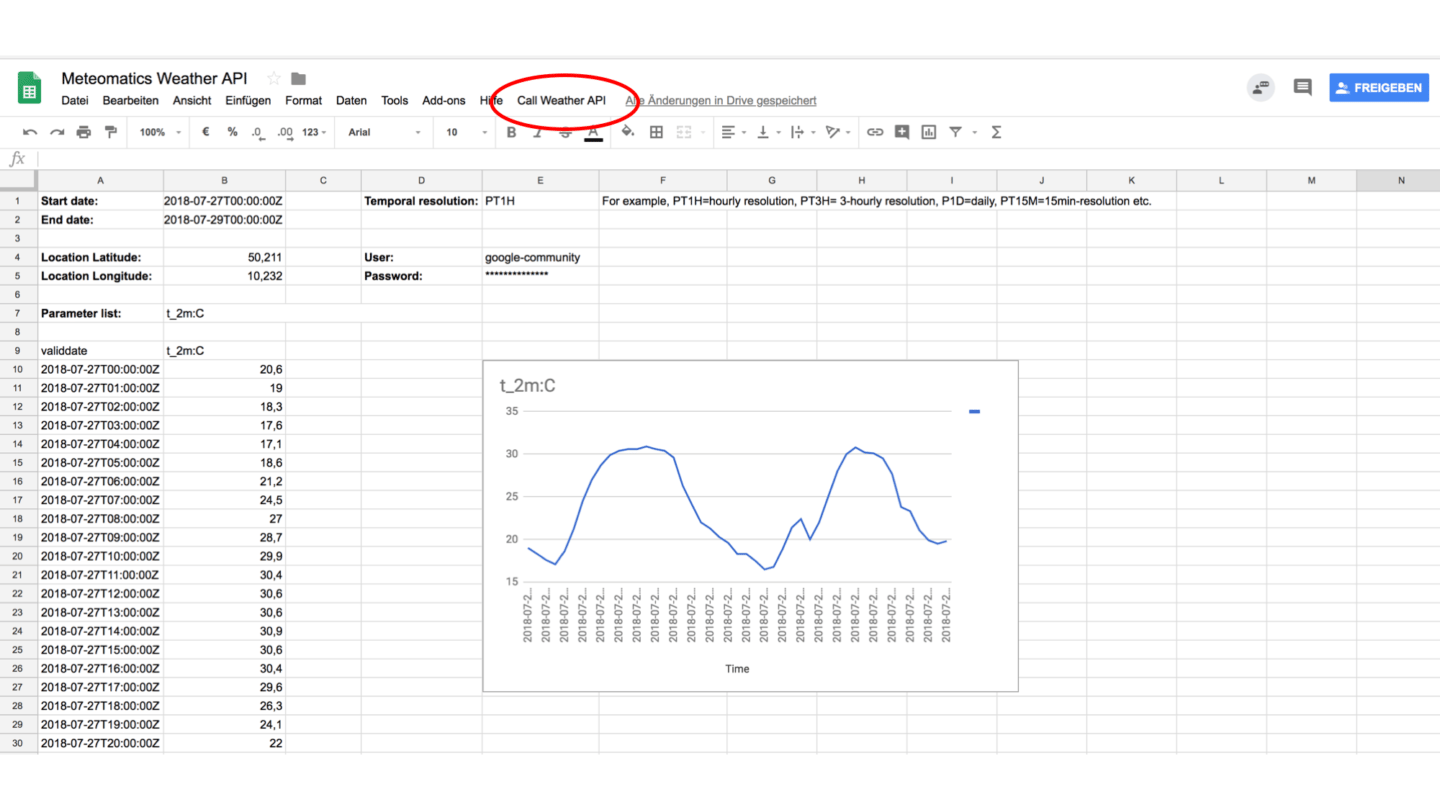
Google Spreadsheet
The weather API can be simply integrated into a Google spreadsheet: The integration is done via a Javascript code that is bound to a Google Spreadsheet. When opening the spreadsheet, a button appears to the menu such the API can be queried.

Use the link below to access the most recent version of the Google Spreadsheet connector:
https://github.com/meteomatics/Google_spreadsheet_connector
Java
In case Java is your preferred programming language, you can use our sample code as a starting point to retrieve all the weather content you need. Happy coding!
Use the link below to access the most recent version of our Java Weather API Connector on our GitHub repository:
http://github.com/meteomatics/java-connector-api
JavaScript
JavaScript is probably the most prominent web programming language. Using the JavaScript weather API connector, you can easily derive your own charts and visualizations. The following example integrates the weather API Data with HighCharts:

Use the link below to get an example for create a HighCharts.
http://github.com/meteomatics/javascript-csv-data-to-highcharts
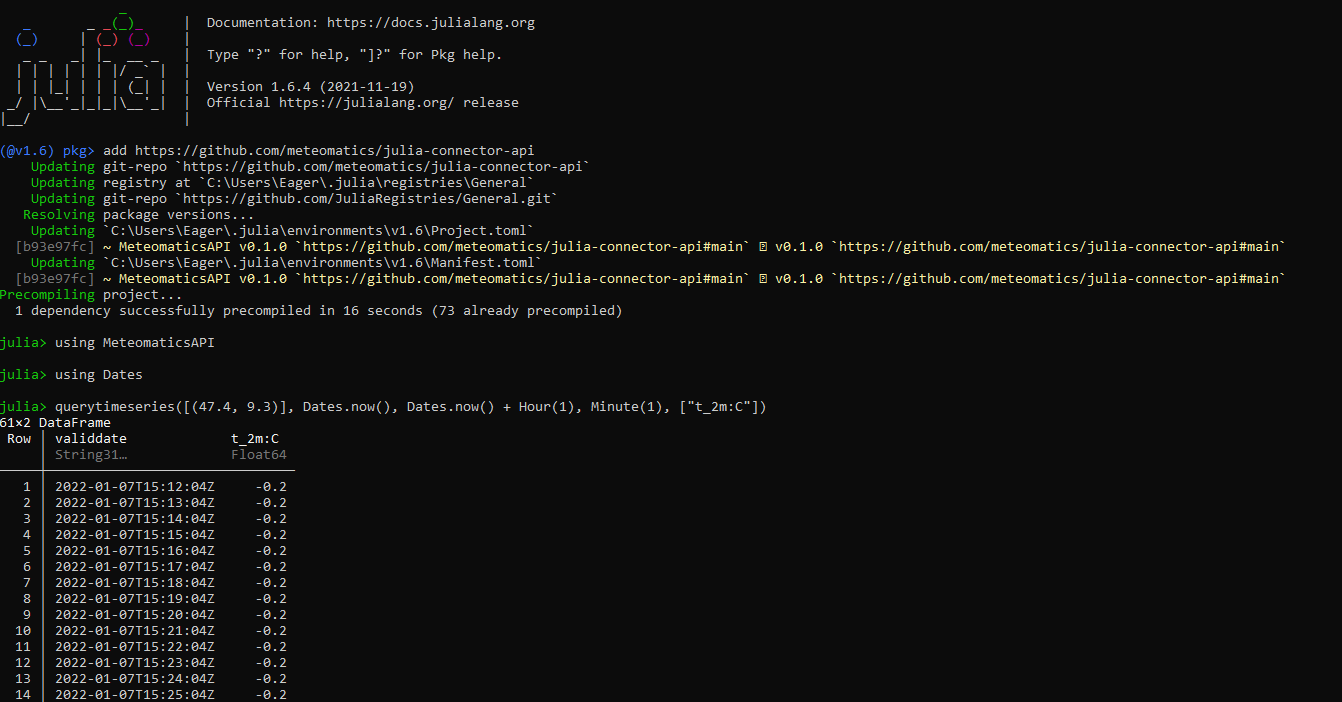
Julia
In order to guarantee easy access to a variety of weather data through the Meteomatics Weather API, there is now a connector for the high-level programming language Julia. This programming language is mainly used for numerical analysis and in computational science. The latest version of the connector as well as sample code, examples and descriptions are available on GitHub.

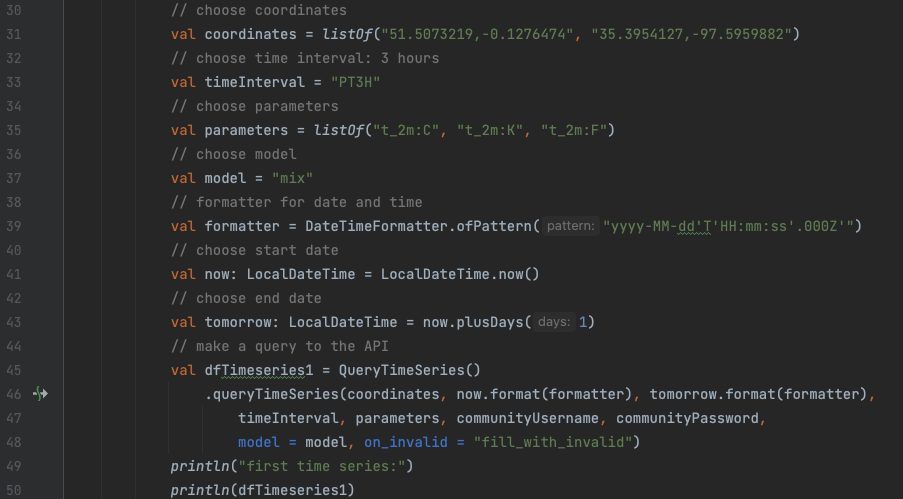
Kotlin
Kotlin is a high - level programming language, very similar to and fully interoperable with Java. One of the main advantages over Java is that it has a simplified syntax making it more efficient to write code. It is also preferred for Android development.
Our Kotlin API connector consists of the three most important queries: time series, grid and grid time series. With it you can query data and receive it in a nice and beautiful format, ready to use for analysis or applications :-)
Use the link below to access the most recent version of our Kotlin Weather API Connector on our GitHub repository:
https://github.com/meteomatics/kotlin-connector-api.

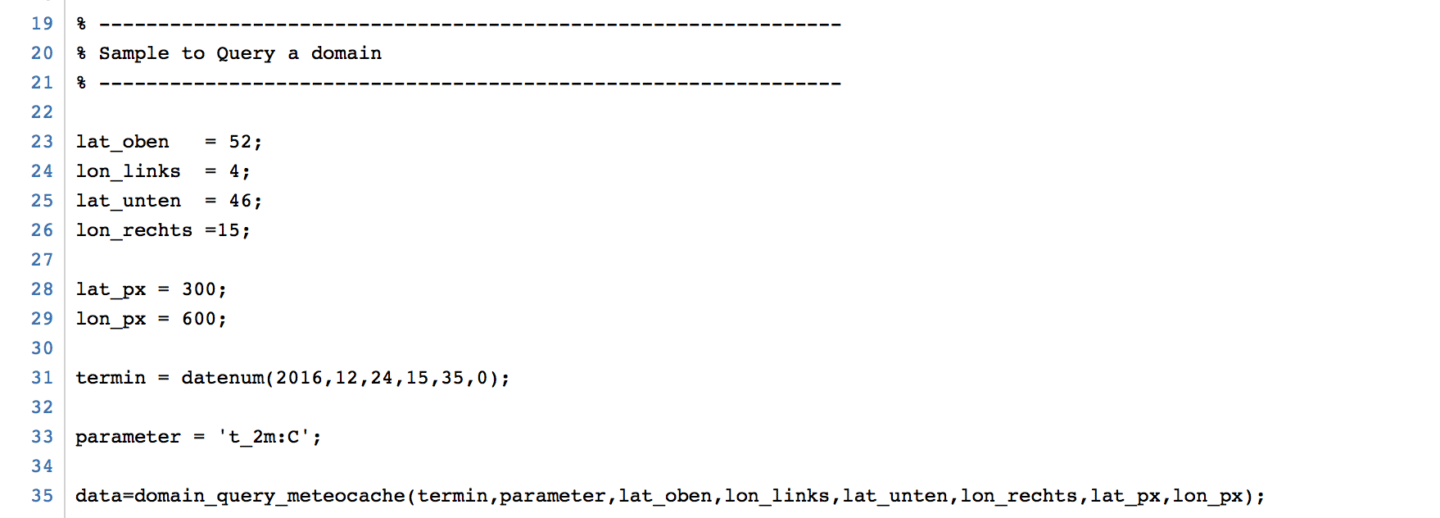
Matlab
Many scientists and scientifically-oriented product developers use Matlab. For instance, energy market analysts use Matlab to load forecasts and to develop in-house models for wind and solar power. So that they can concentrate on the scientific modeling, we provide a Matlab weather API connector. This collection of samples codes shows how to retrieve historical weather model data with a single line of code, which allows you to compare the forecast skill of different weather models such as ECMWF, GFS, UK Met Office, etc. so that you can develop your own mixing strategies to to increase forecasting skill.

Use the link below to access the most recent version of our Matlab Weather API Connector:
https://ch.mathworks.com/matlabcentral/fileexchange/63992-meteomatics-weather-api-connector
PHP
PHP is another wide spread web programming language like JavaScript and is known for its simplicity. Because of this simplicity, we have enabled easy weather API data access using PHP.
You can download a simple example on how to use our API within PHP from Github:
http://github.com/meteomatics/php-connector-api
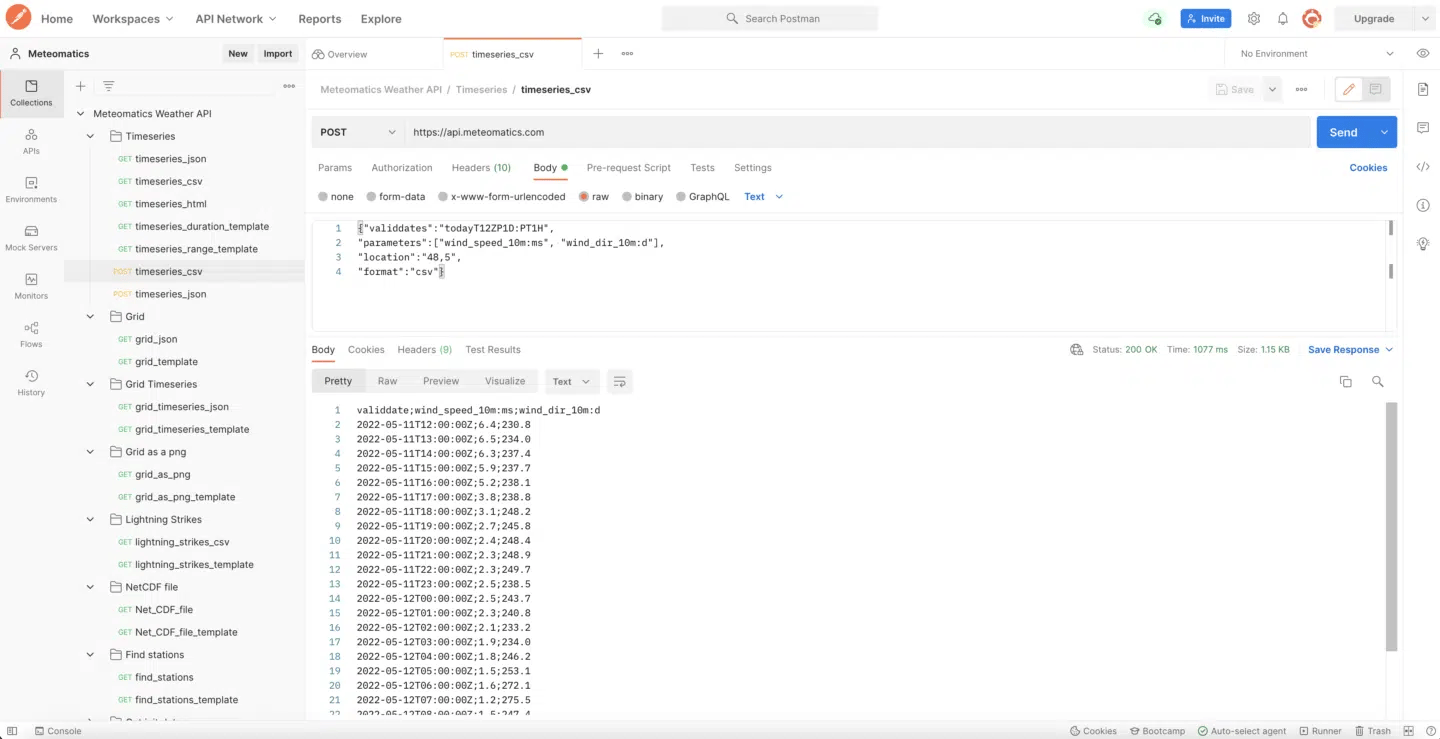
Postman
Postman is an API Platform for building and using APIs. On GitHub you can find a Postman collection as a json file. This file can be imported into your workspace. The collection includes examples and templates to create requests for the Meteomatics Weather API.

Power BI
Power BI is a business analytic service based on a cloud-system. With Power BI you have the possibility to compare the data from the Weather API with your own business data and visualize them as well. The data from the Weather API can be downloaded into Power BI by the use of our provided R-Script.

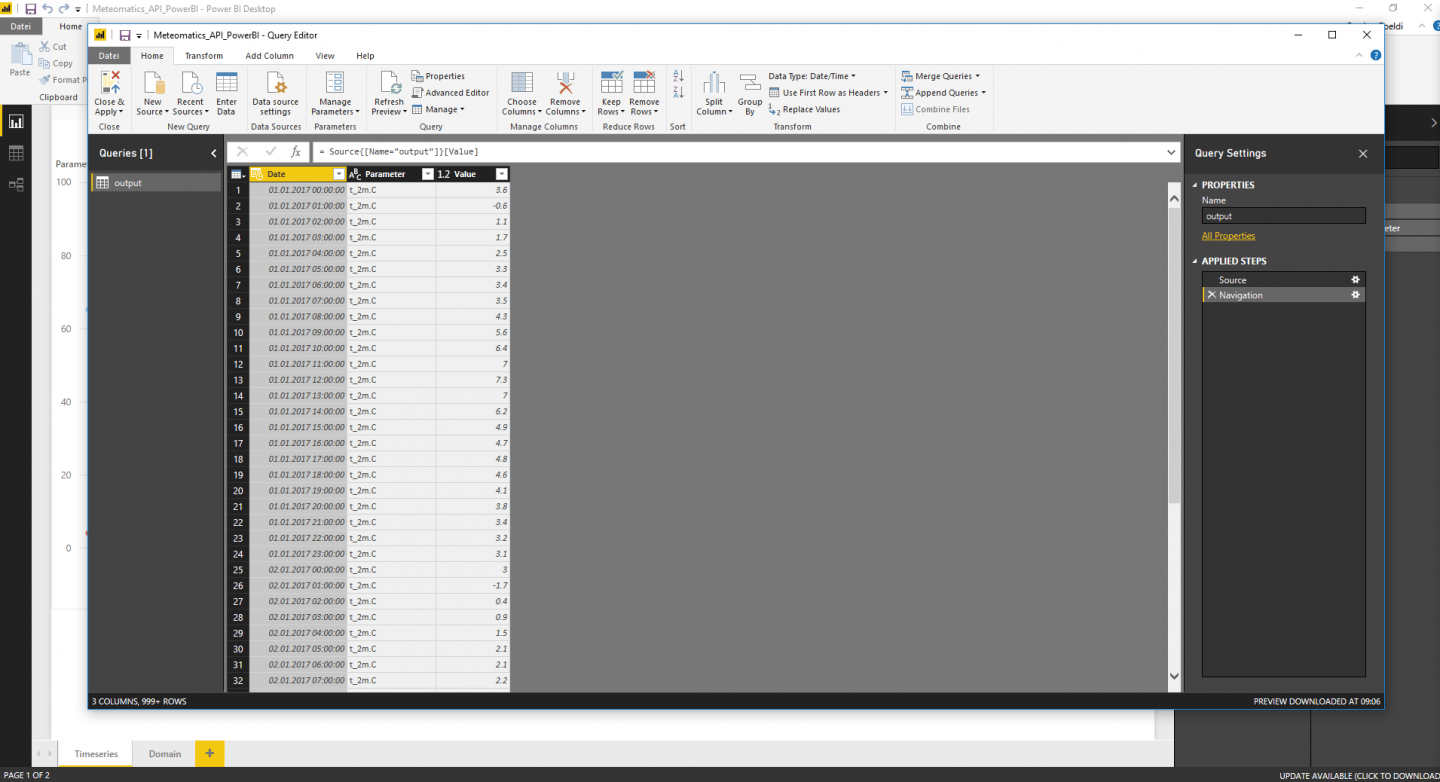
Use the link below to access the most recent version of our Weather API Connector for Power BI:
http://github.com/meteomatics/PowerBI-connector-api
Python
To make access to a variety of weather data as convenient as possible, you can use sample code and open source Python modules for access to all the weather content you need by typing a single line. This includes time series of various weather model data, station data, forecast data, radar and satellite images.
Examples to help you get started with the python connector can be found here
Use the link below to access the most recent version of our Python Weather API Connector on our GitHub repository:
http://github.com/meteomatics/python-connector-api
Example code of how to get data for a time series:
import datetime as dt

import meteomatics.api as api


username = 'max'

password = 'mustermann'


coordinates = [(47.11, 11.47)]

parameters = ['t_2m:C', 'precip_1h:mm', 'wind_speed_10m:ms']

model = 'mix'

startdate = dt.datetime.utcnow().replace(minute=0, second=0, microsecond=0)

enddate = startdate + dt.timedelta(days=1)

interval = dt.timedelta(hours=1)


df = api.query_time_series(coordinates, startdate, enddate, interval, parameters, username, password, model=model)
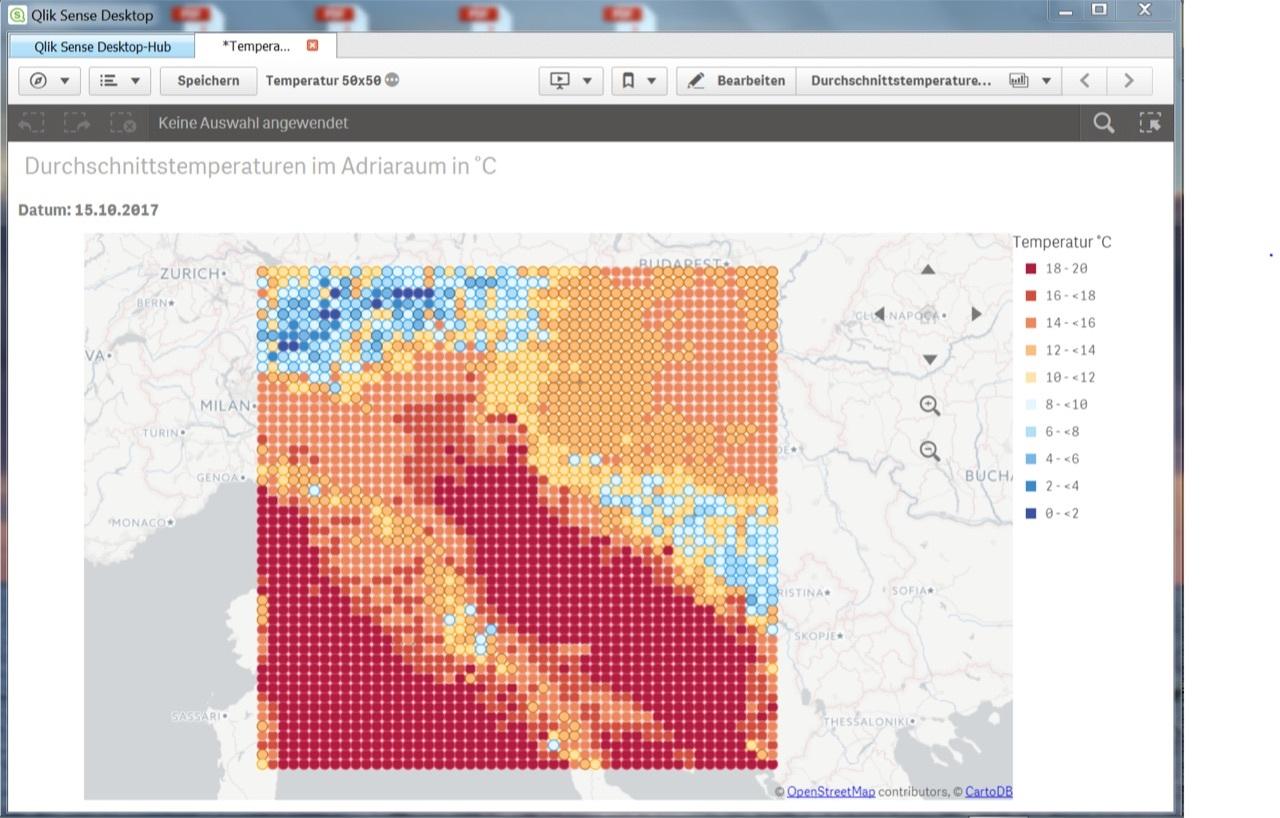
Qlik
Qlik is well known to the entire data science community. Thus, a good reason to also integrate with our weather API: data can be queried from our weather API and used for any further downstream analysis. Thanks to the built-in WMS capability all available meteorological and maritime variables can be either used just as a background map layer or also referenced in a numerical analysis. This covers not only radar and satellite images, but also any quantities that are derived from different meteorolgical quantities such as model information, downscaled temperature and humidity, wind speed, hail and lightning information etc. for historical, current or future points in time.

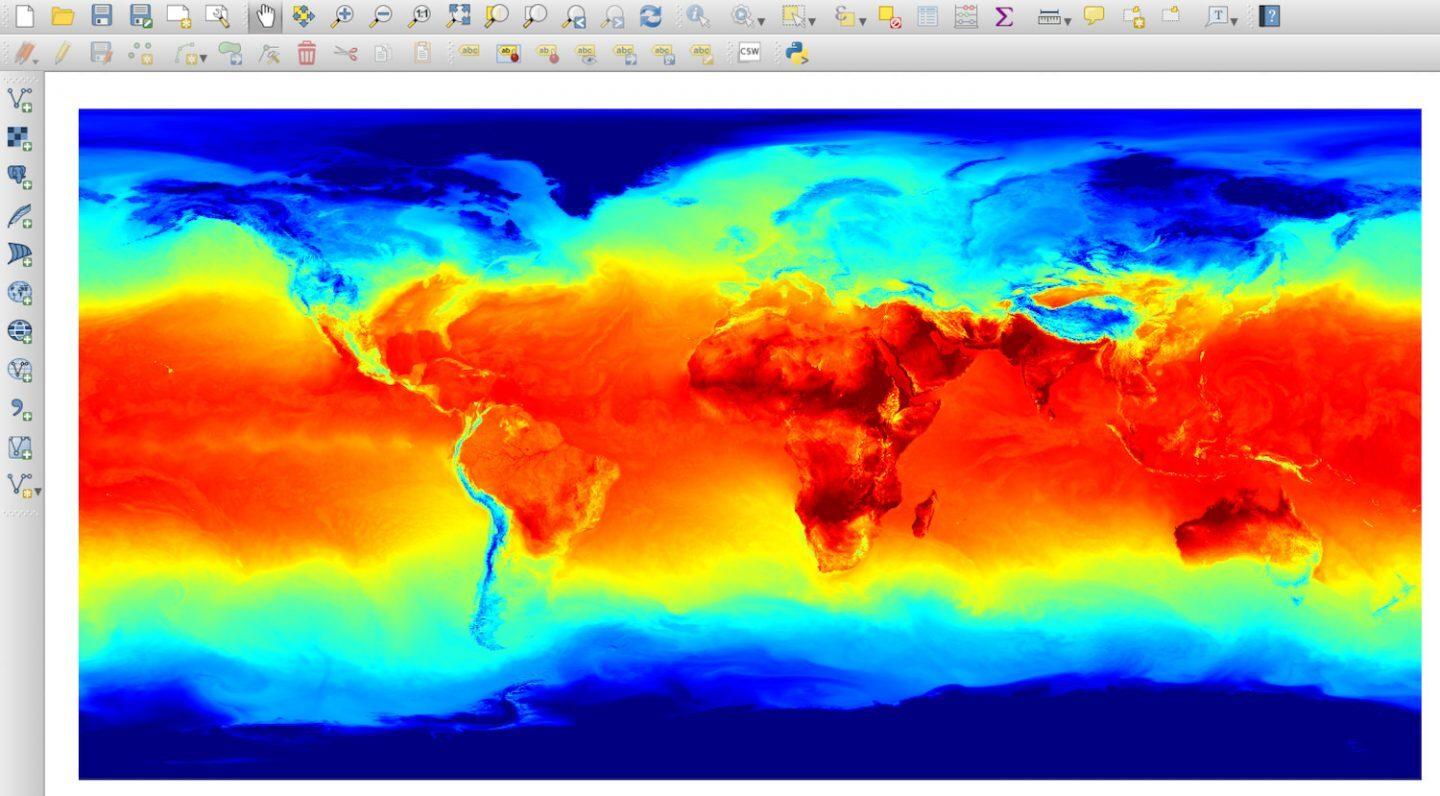
QGIS
QGIS is a widely used open source GIS tool. Thanks to WMS and WFS capability, arbitrary data layers can be easily integrated into QGIS. For instance, the following example shows air temperature globally. Of course, as with every other connector, you can also access all the other parameters featured by the Meteomatics API, e.g. short-term forecasts (nowcasts) in 5-minutes resolution.
Please refer to QGIS (WMS) or QGIS (WFS) for further instructions on how to use our API in QGIS.

R
R is a language widely used in statistics. Weather often plays a role in many topics under study. Therefore, we also developed a connector to simplify access to weather data within your R framework.

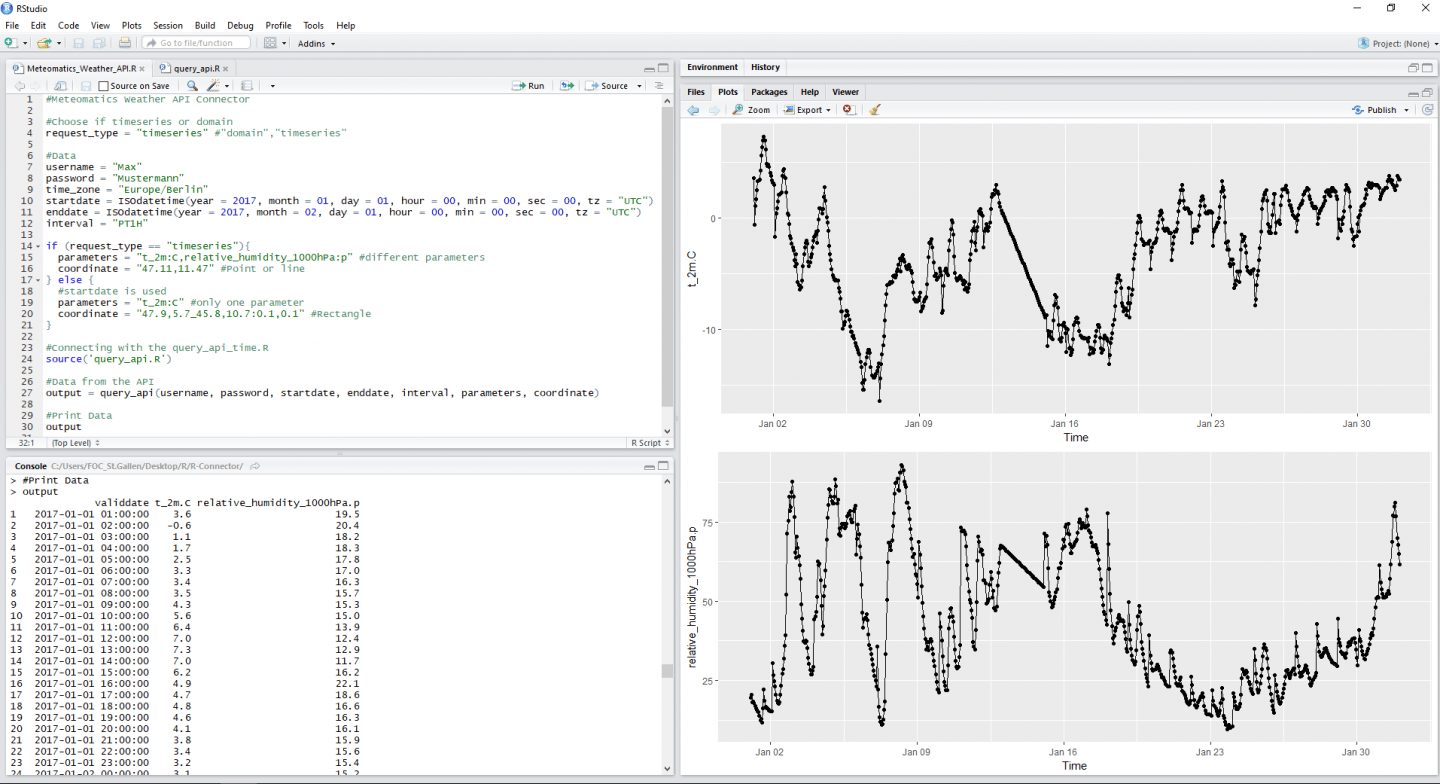
Use the link below to access the most recent version of our R Weather API Connector:
http://github.com/meteomatics/R-connector-api
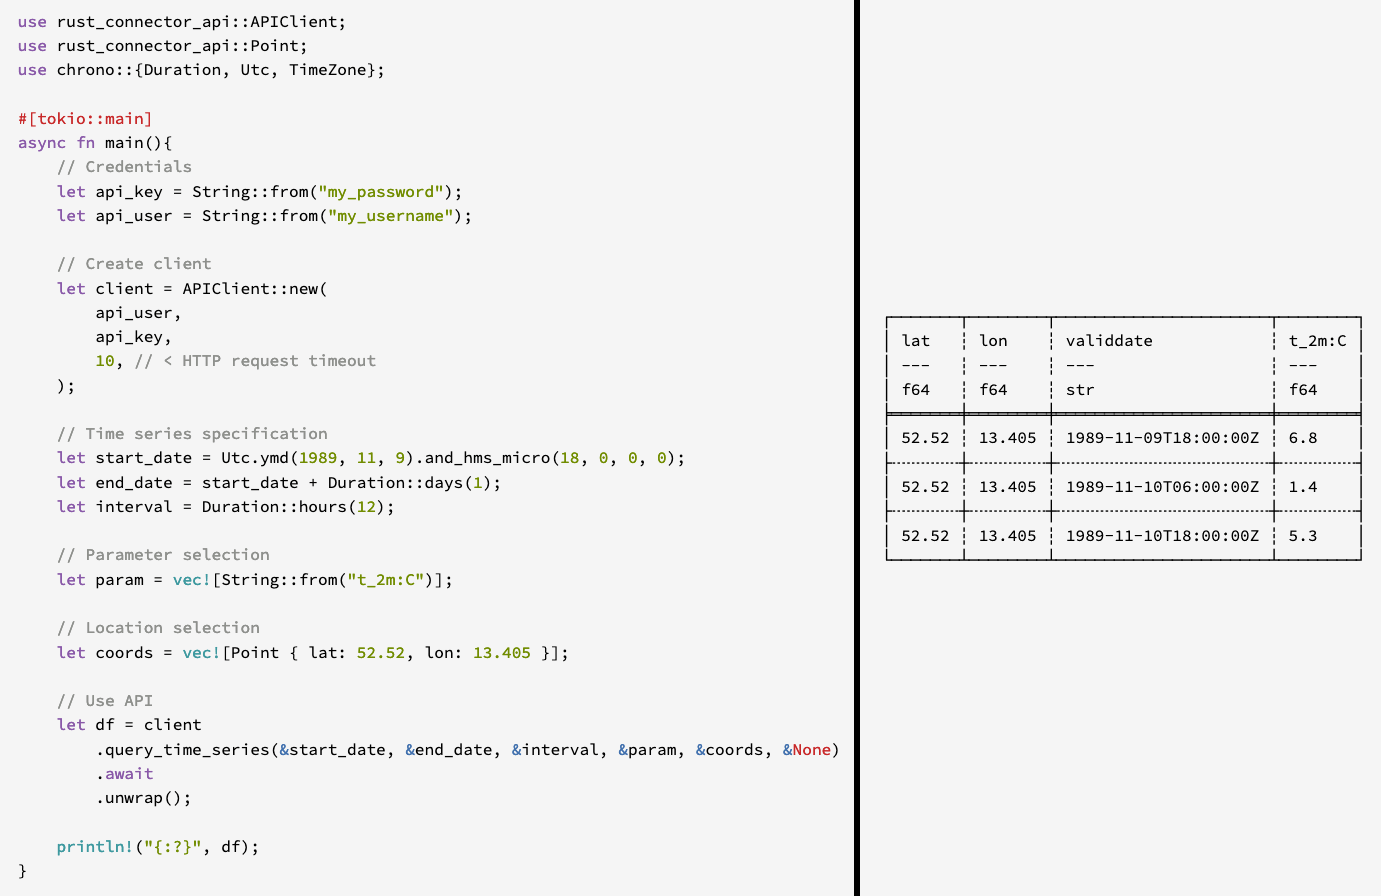
Rust
We also offer a connector forRust, which is a general-purpose, multi-paradigm programming language designed for performance and safety. With our connector we provide easy access to all of our weather data through the Meteomatics Weather API. You can find the connector here: https://crates.io/crates/meteomatics/

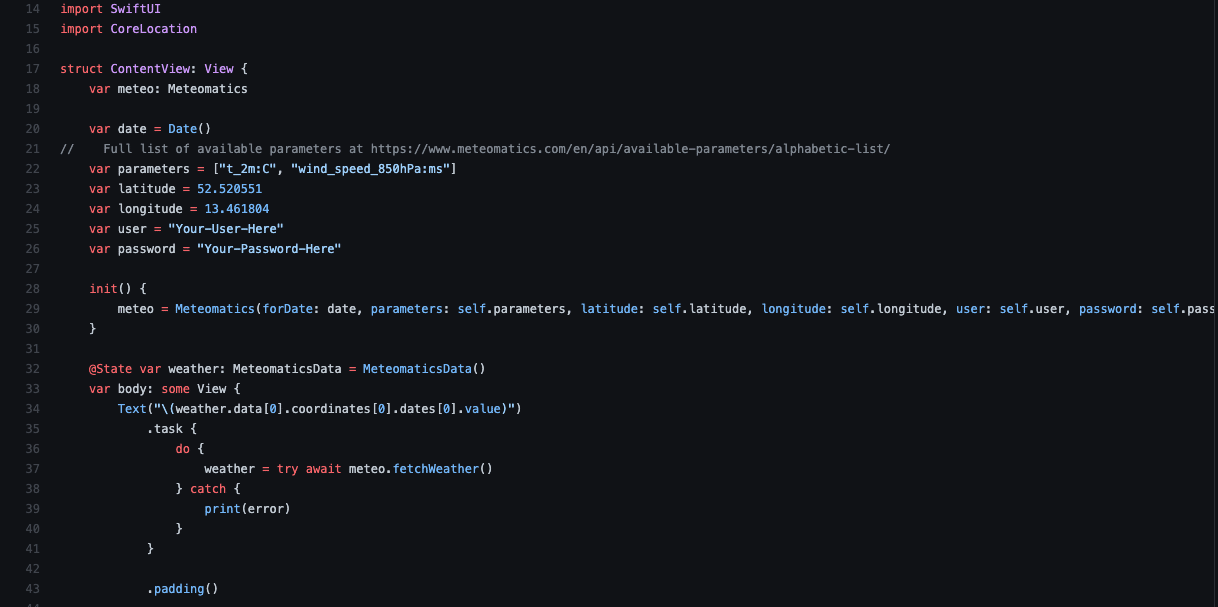
Swift
We can also offer a connector for Swift, which is a general-purpose, multi-paradigm, compiled programming language developed by Apple Inc. in order to guarantee easy access to all of our weather data through the Meteomatics Weather API. The latest version of the connector as well as sample code, examples and descriptions are available on GitHub.

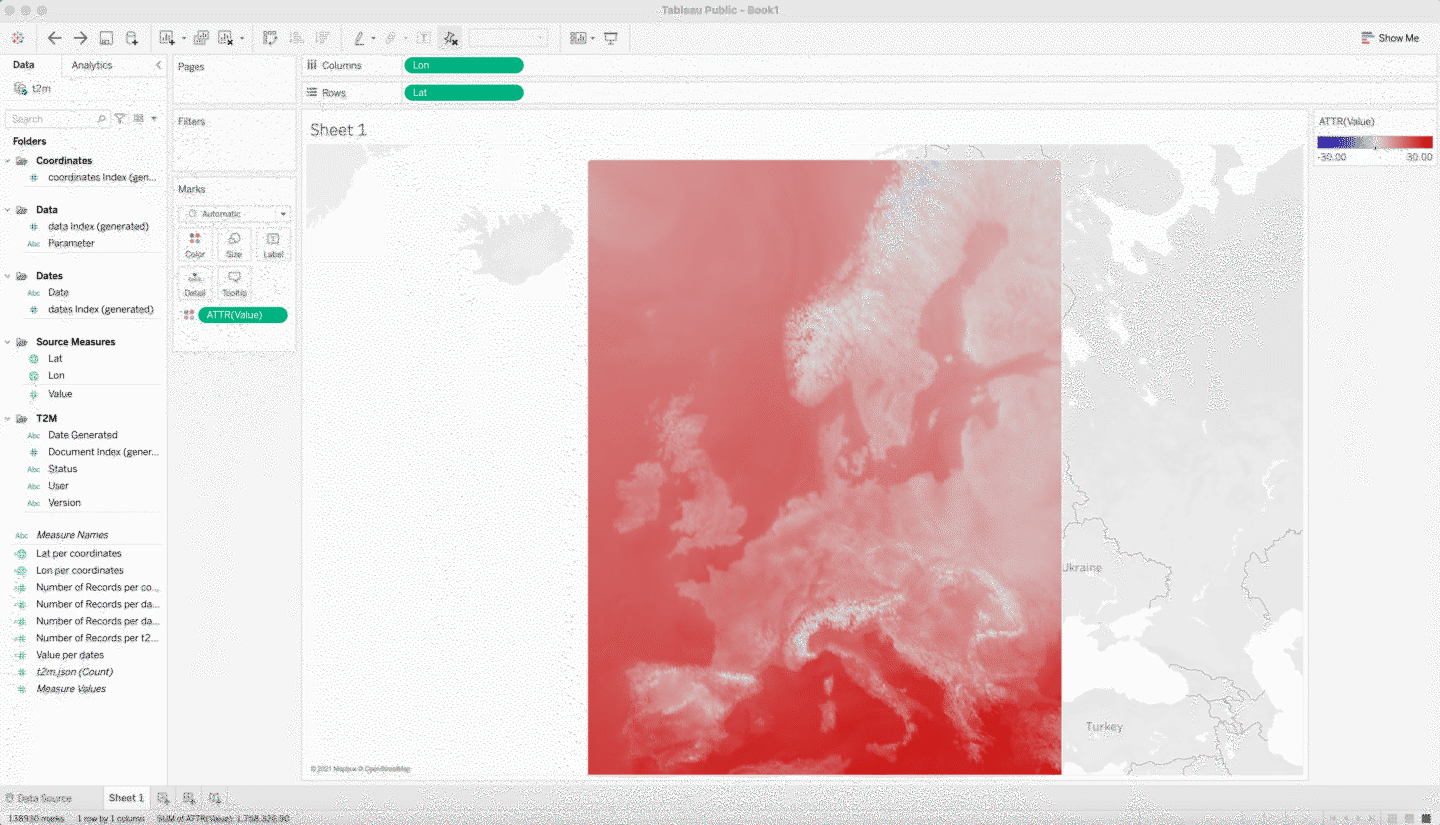
Tableau
Tableau is one of the most leading tools for data analysis and visualization. The Meteomatics Weather API connects with Tableau such that data can be queried and used for any downstream analysis. Thanks to the built-in json capability all available meteorological and maritime variables can be integrated. To do so, select a meteorological variable and use "json" as your output format, e.g. https://api.meteomatics.com/2025-06-30T00:00:00Z/t_2m:C/Europe:0.1,0.1/json (2m temperature over Europe). Download and store the API output on your local machine and in Tableau select "JSON file", which prompts you to a window where you can select the downloaded json file.

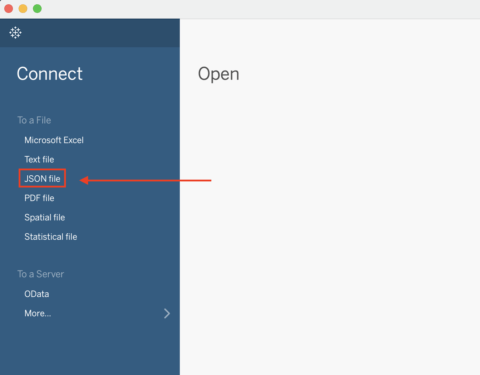
Once you integrated the downloaded json file into Tableau, you can visualise the data.