Agricultural Parameters
Below is an overview of all agricultural parameters:
Evapotranspiration | Growing Degree Days | Grass Land Temperature Sum | Leaf Wetness | Phytophthora Negative | Most Similar Year
Every parameter is now explained in more detail:
Evapotranspiration
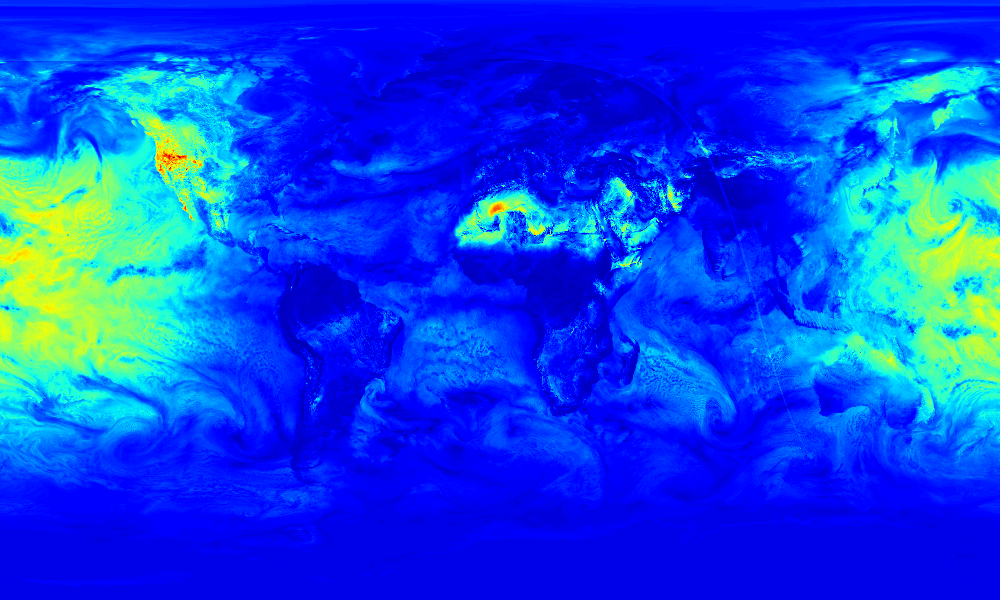
Evapotranspiration in millimeters accumulated for 1h, 3h, 6h, 12h, or 24h. Evapotranspiration (ET) is the sum of evaporation and plant transpiration from the Earth's land and ocean surface to the atmosphere. Evaporation accounts for the movement of water to the air from sources such as the soil, canopy interception, and bodies of water. Transpiration accounts for the movement of water within a plant and the subsequent loss of water as vapor through stomata in its leaves. Evapotranspiration is an important part of the water cycle.
This parameter shows the reference evapotranspiration, which is the evapotranspiration from a hypothetical well-watered grass surface.
evapotranspiration_<interval>:<unit>Available units: mm, in
Available intervals: 1h, 3h, 6h, 12h, 24h
Examples
- Show the amount of evapotranspiration over the entire world.
- The data in csv format over a smaller area:
https://api.meteomatics.com/2026-03-30T12:00:00Z/evapotranspiration_1h:mm/45,10_40,15:1,1/csv
validdate;2017-08-25 12:00:00
parameter;evapotranspiration_1h:mm
data;10;11;12;13;14;15
45;0.61;0.59;0.58;0.53;0.63;0.55
44;0.52;0.58;0.6;0.52;0.55;0.55
43;0.51;0.64;0.63;0.66;0.55;0.56
42;0.51;0.55;0.6;0.73;0.64;0.59
41;0.53;0.57;0.59;0.55;0.63;0.74
40;0.56;0.59;0.6;0.6;0.56;0.54

Growing Degree Days
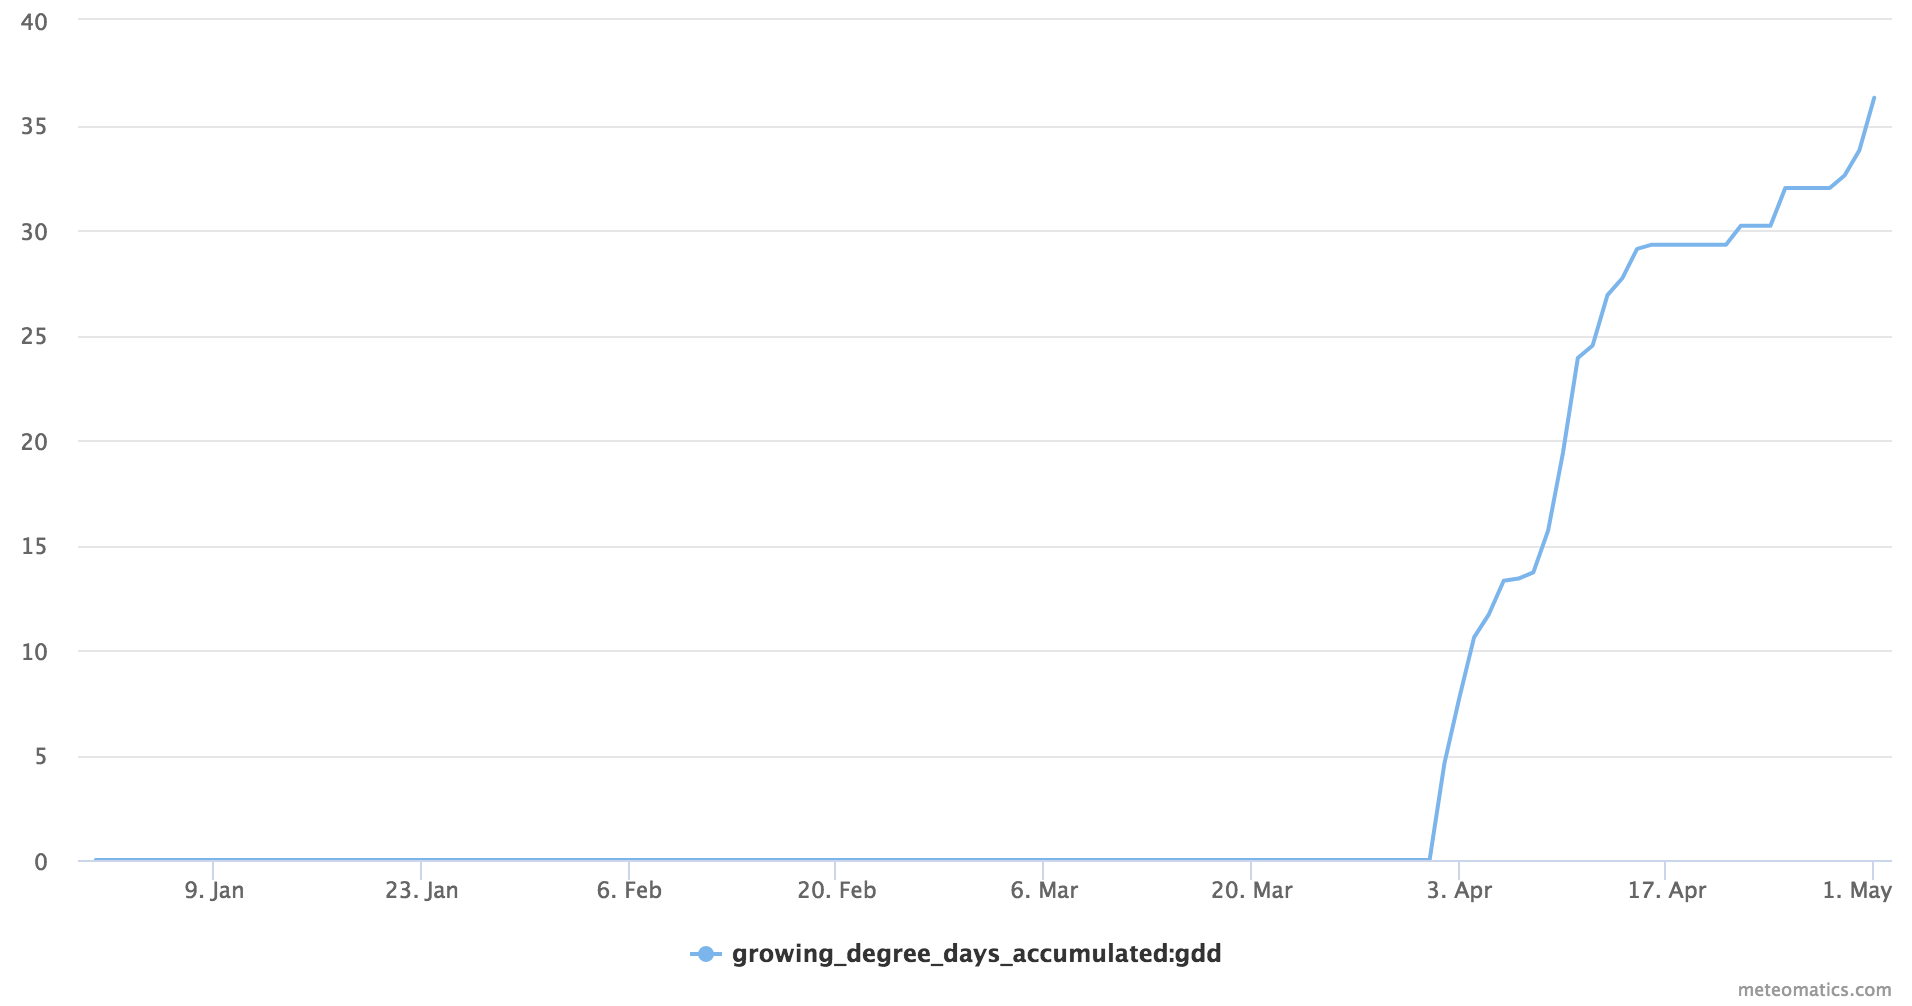
Growing degree days (GDD), also called growing degree units (GDUs), are a heuristic tool in phenology. GDD are a measure of heat accumulation used by horticulturists, gardeners, and farmers to predict plant and animal development rates such as the date that a flower will bloom, an insect will emerge from dormancy, or a crop will reach maturity.
growing_degree_days_accumulated:gddExamples
- Show the accumulated growing degree days from the first of January on.
- A part of the corresponding csv file.
validdate;growing_degree_days_accumulated:gdd
2017-04-01T00:00:00Z;0
2017-04-02T00:00:00Z;4.5
2017-04-03T00:00:00Z;7.7
2017-04-04T00:00:00Z;10.6
2017-04-05T00:00:00Z;11.7
2017-04-06T00:00:00Z;13.3
2017-04-07T00:00:00Z;13.4
2017-04-08T00:00:00Z;13.6

Grass Land Temperature Sum
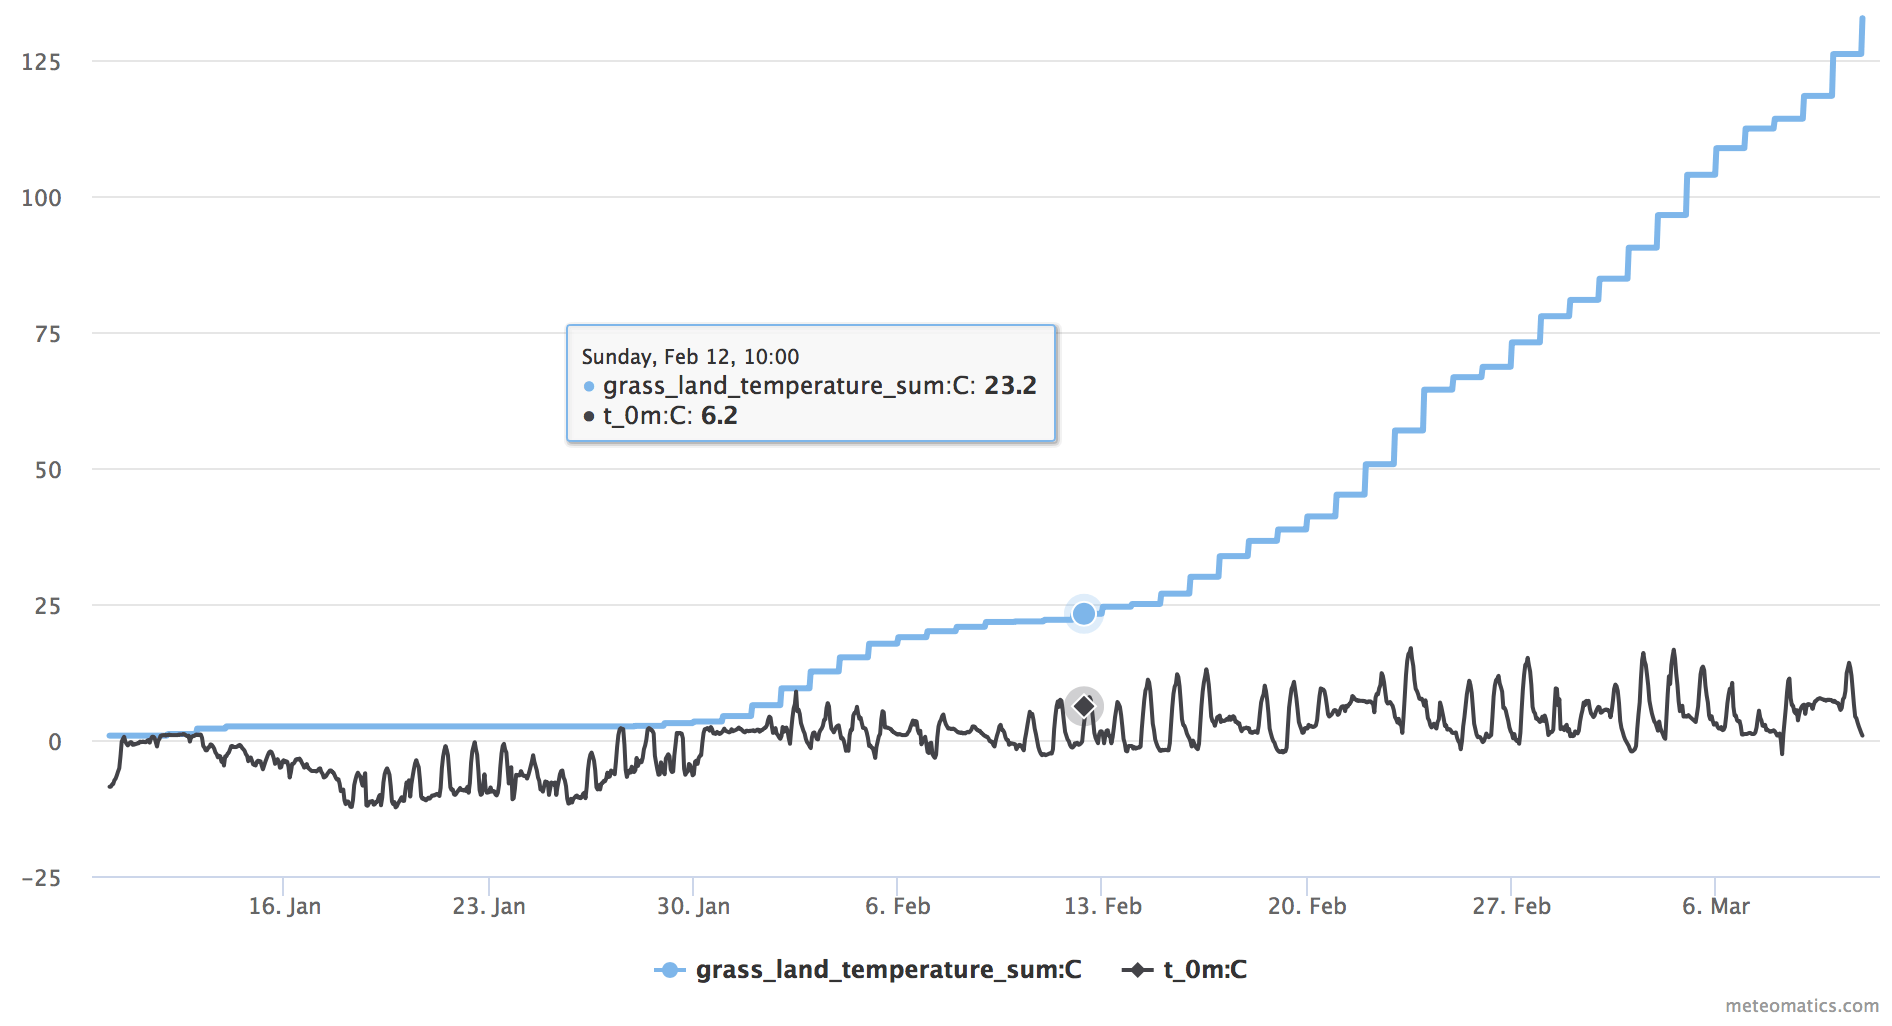
This is a special form of the GDD (Growing degree days). It is used for the date determination for the start of field work after the winter. Accumulation of the mean day temperatures starts on the first of January of the indicated year.
grass_land_temperature_sum:<unit>Available units: C, F
Examples
- Show the grass land temperature sum along with the temperature at two meters.
- An example of the data as a json output.
{"version":"3.0","user":"api-test","dateGenerated":"2018-02-21T13:42:44Z","status":"OK","data":
[{"parameter":"grass_land_temperature_sum:C","coordinates":[{"lat":47.4122,"lon":9.34065,"dates":
[{"date":"2017-01-10T00:00:00Z","value":2},{"date":"2017-01-10T06:00:00Z","value":2},
{"date":"2017-01-10T12:00:00Z","value":2},{"date":"2017-01-10T18:00:00Z","value":2},
{"date":"2017-01-11T00:00:00Z","value":2},{"date":"2017-01-11T06:00:00Z","value":2},
{"date":"2017-01-11T12:00:00Z","value":2},{"date":"2017-01-11T18:00:00Z","value":2},
{"date":"2017-01-12T00:00:00Z","value":2.3}]}]},
{"parameter":"t_2m:C","coordinates":[{"lat":47.4122,"lon":9.34065,"dates":
[{"date":"2017-01-10T00:00:00Z","value":-2.4},{"date":"2017-01-10T06:00:00Z","value":-1.5},
{"date":"2017-01-10T12:00:00Z","value":-0.7},{"date":"2017-01-10T18:00:00Z","value":-0.2},
{"date":"2017-01-11T00:00:00Z","value":-1.1},{"date":"2017-01-11T06:00:00Z","value":-1.1},
{"date":"2017-01-11T12:00:00Z","value":-0.1},{"date":"2017-01-11T18:00:00Z","value":2.3},
{"date":"2017-01-12T00:00:00Z","value":2}]}]}]}

Leaf Wetness
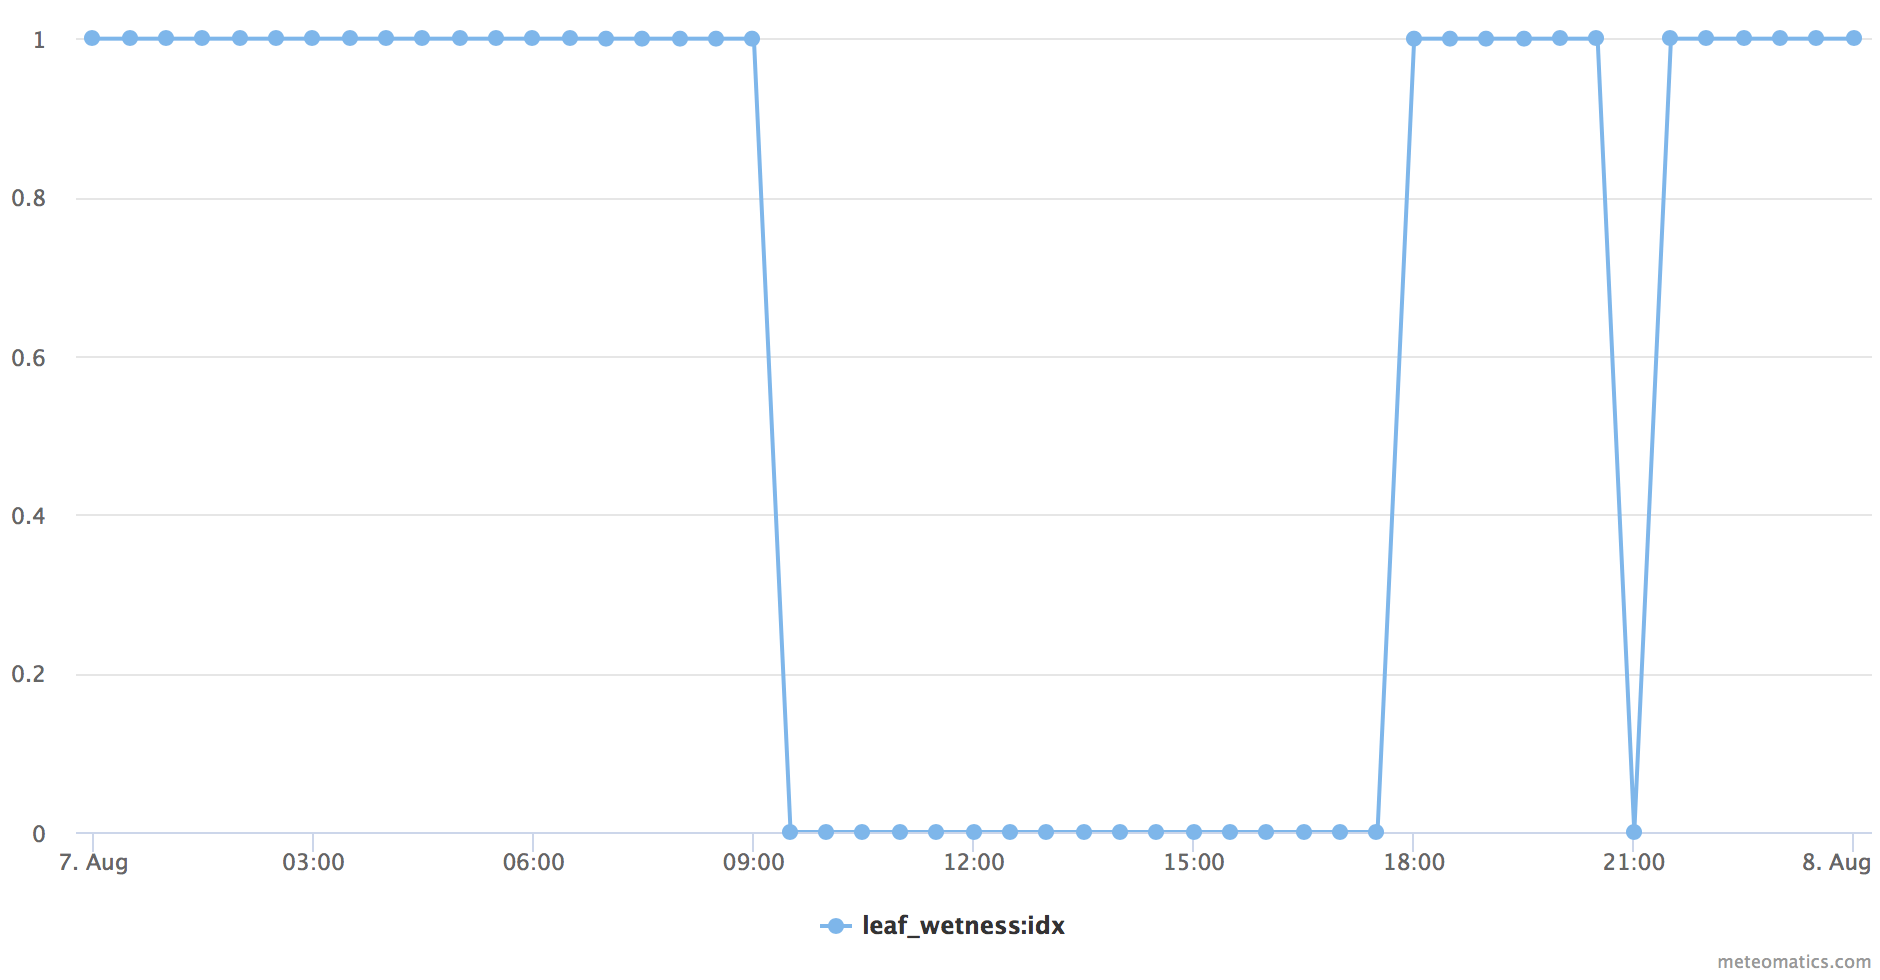
Leaf wetness describes the amount of dew left on surfaces. It is used for detection of fog and dew conditions. The output is binary where 1 indicates wetness.
leaf_wetness:idxExamples
- Show the binary leaf wetness index with a 30 minute resolution. It is clearly visible that leaf wetness is present in the evening, night and morning.
- The leaf wetness as a json format.
{"version":"3.0","user":"api-test","dateGenerated":"2018-02-07T12:33:04Z","status":"OK","data":
[{"parameter":"leaf_wetness:idx","coordinates":[{"lat":47.4122,"lon":9.34065,"dates":
[{"date":"2018-01-01T00:00:00Z","value":0},{"date":"2018-01-01T03:00:00Z","value":1},
{"date":"2018-01-01T06:00:00Z","value":0},{"date":"2018-01-01T09:00:00Z","value":0},
{"date":"2018-01-01T12:00:00Z","value":0},{"date":"2018-01-01T15:00:00Z","value":0},
{"date":"2018-01-01T18:00:00Z","value":0},{"date":"2018-01-01T21:00:00Z","value":1},
{"date":"2018-01-02T00:00:00Z","value":1}]}]}]}

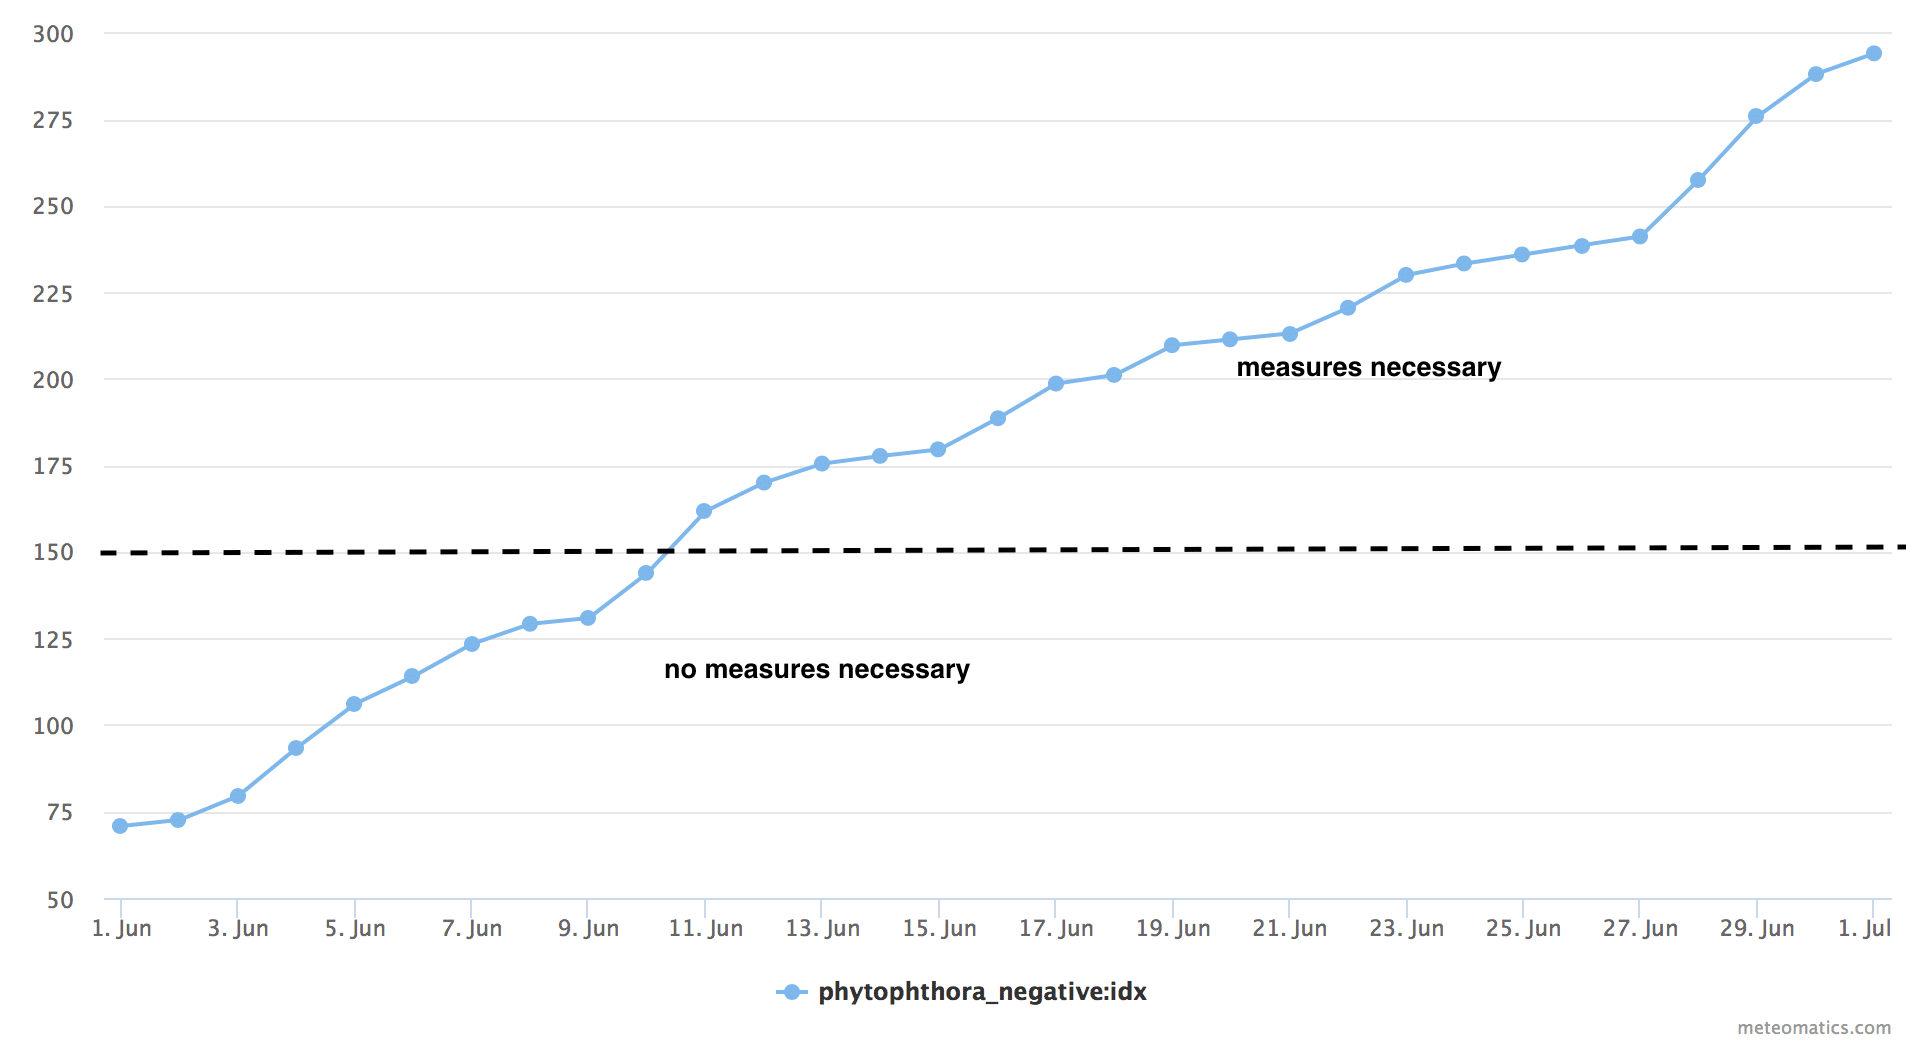
Phytophthora Negative Prognosis
The Phytophthora negative prognosis is an index for the necessity of safety measures against potato blight. No safety measures against Phytophthora infestans are necessary up to a value of 150.
phytophthora_negative:idxExamples
- Show the prognosis for the month of June. We can observe that measures against potato blight become necessary after the first third of the month has elapsed.
https://api.meteomatics.com/2026-03-30T00:00:00ZP30D:P1D/phytophthora_negative:idx/50,10/html
- An example out of the corresponding csv file:
validdate;phytophthora_negative:idx
2017-06-01T00:00:00Z;71.4
2017-06-02T00:00:00Z;73.2
2017-06-03T00:00:00Z;80.1
2017-06-04T00:00:00Z;94
2017-06-05T00:00:00Z;106.7
2017-06-06T00:00:00Z;114.7
2017-06-07T00:00:00Z;124
2017-06-08T00:00:00Z;129.9

Most Similar Year
The year in which conditions on a particular date were most similar to those on the queried year regarding temperature and precipitation.
most_similar_year:yExamples
- Show the year which has the most similar conditions on a respective date:
validdate;most_similar_year:y
2017-08-06T00:00:00Z;2003
2017-08-07T00:00:00Z;2015