Atmospheric Trace Gases
Below is an overview of all atmospheric trace gas parameters. The abbreviation AOD stands for Aerosol Optical Depth.
- Carbon: Black Carbon AOD 550nm | Black Carbon Hydrophil | Black Carbon Hydrophob | Carbone Monoxide
- Hydrogen: Hydroxyl Radikal
- Nitrogen Oxides: Nitrogen Dioxide | Nitrogen Monoxide
- Sulfur: Sulfur Dioxide | Sulfate AOD 550nm
- Ozone: Ozone
- Total column of trace gases: Methane | Nitrogen Dioxide | Nitrogen Monoxide | Ozone | Sulfur Dioxide
- Air Quality: Trace Gas Air Quality | Total Air Quality
Each parameter is explained in more detail below.
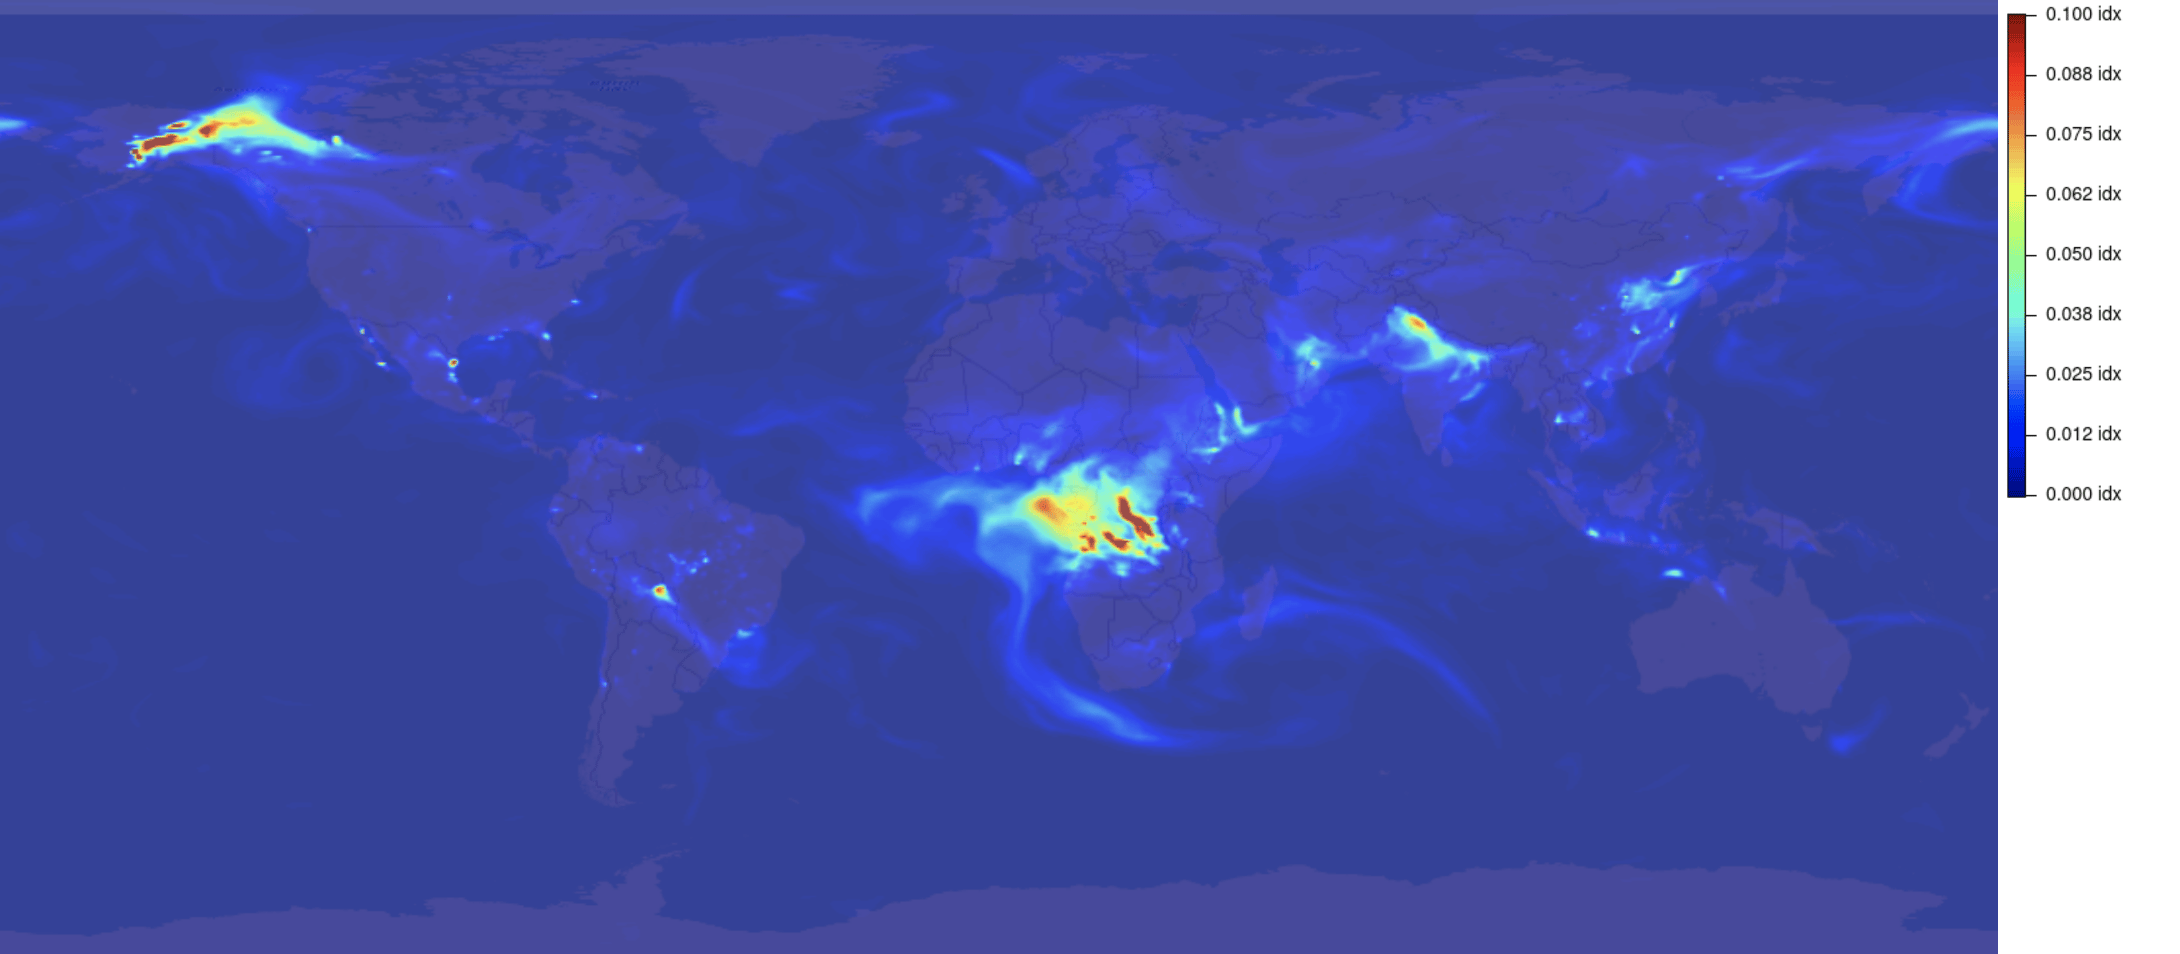
Black Carbon Aerosol Optical Depth
Gives the black carbon aerosol optical depth at 550nm.
black_carbon_aod_550nm:idxExamples
-
Show the AOD for the entire world
-
The data showed in the csv format containing the AOD for the next four days in the ocean.
https://api.meteomatics.com/2025-07-03T00:00:00ZP4D:P1D/black_carbon_aod_550nm:idx/70,-15/csv
validdate;black_carbon_aod_550nm:idx
2017-08-25T00:00:00Z;0.038
2017-08-26T00:00:00Z;0.036
2017-08-27T00:00:00Z;0.011
2017-08-28T00:00:00Z;0.003
2017-08-29T00:00:00Z;0.004

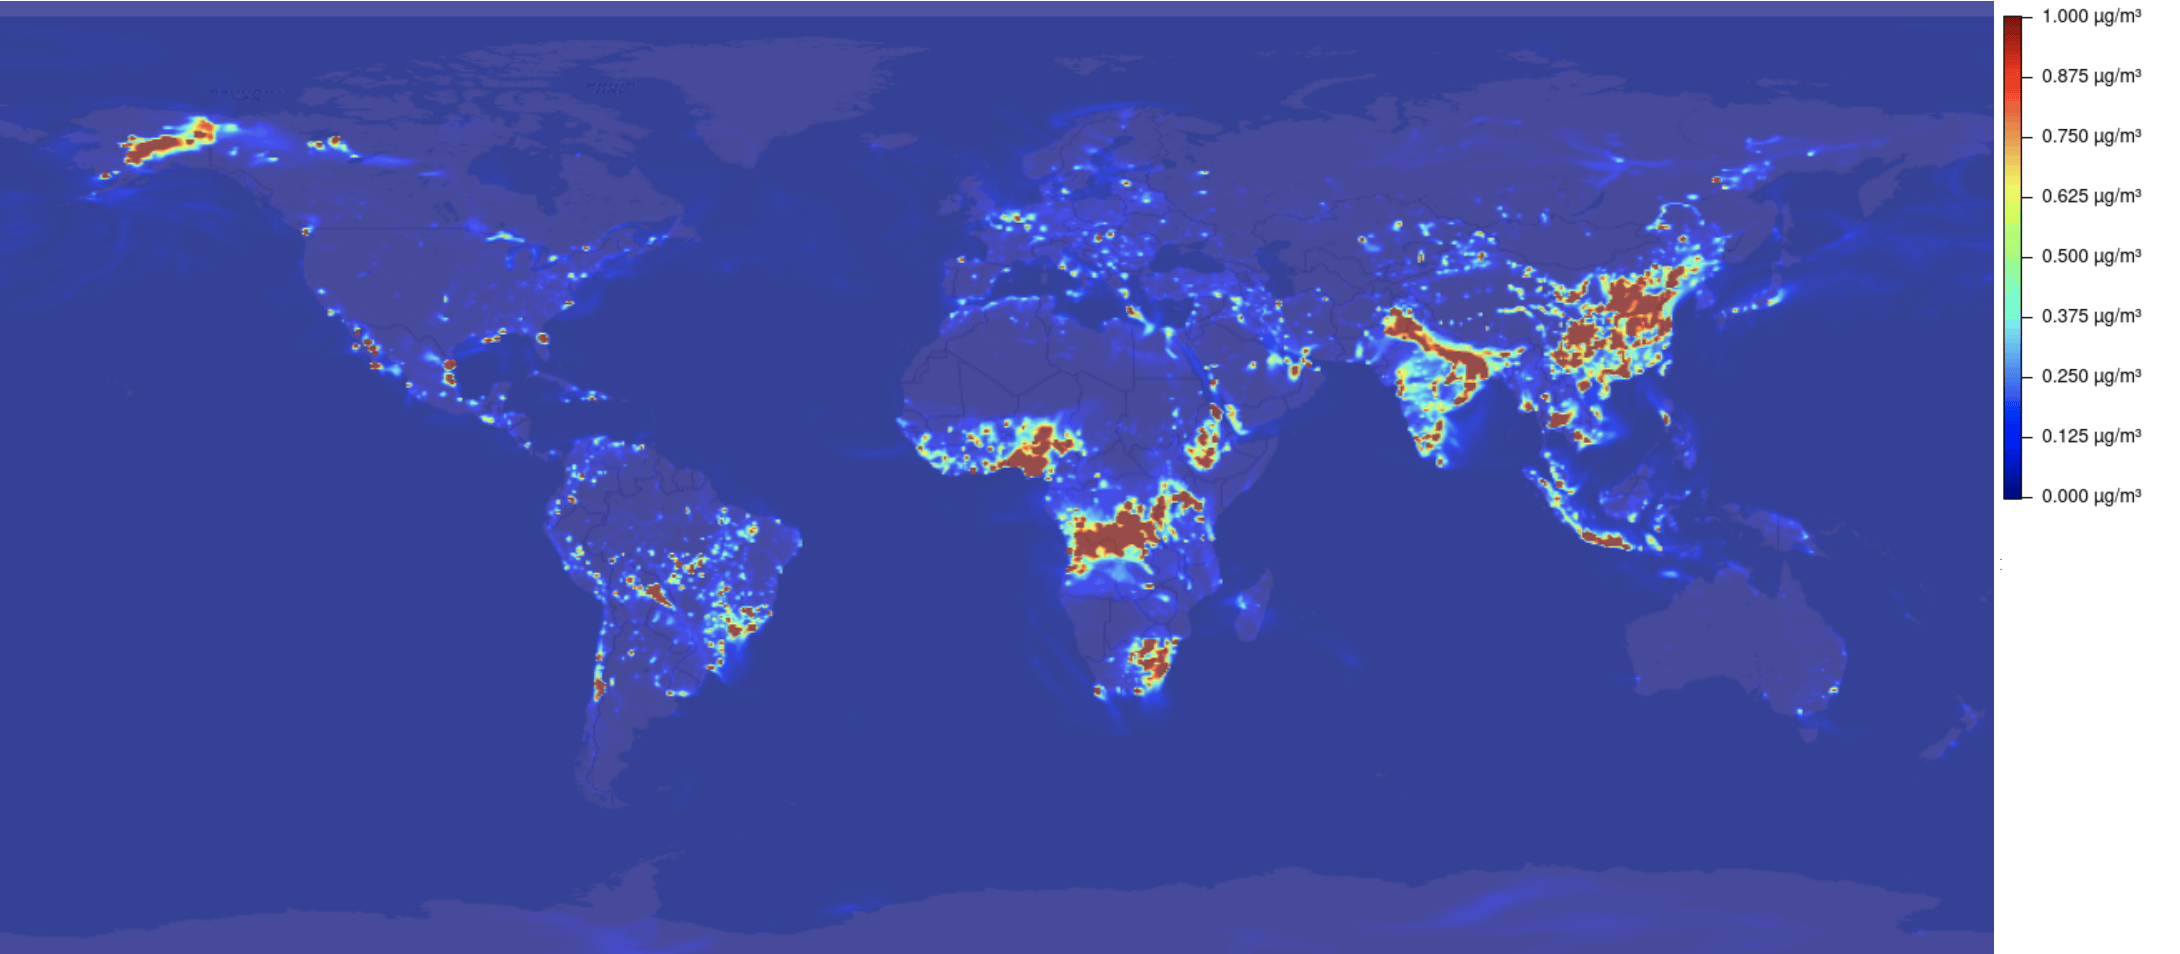
Hydrophilic Black Carbon Concentration
Hydrophilic black carbon concentration at the surface in units of [μg/m3].
black_carbon_hydrophil:ugm3Examples
-
-
https://api.meteomatics.com/2025-07-03T00:00:00Z/black_carbon_hydrophil:ugm3/70,-15_35,30:10,9/csv
validdate;2018-02-20 00:00:00
parameter;black_carbon_hydrophil:ugm3
data;-15;-6;3;12;21;30
70;0.001;0.001;0.001;0.005;0.005;0.011
65;0.004;0.006;0.004;0.018;0.104;0.016
60;0.014;0.003;0.083;0.109;0.166;0.321
55;0.009;0.033;0.267;0.221;0.302;0.417
50;0.012;0.023;0.367;0.478;0.41;0.29
45;0.019;0.013;0.134;0.267;0.151;0.253
40;0.003;0.187;0.05;0.043;0.093;0.072
35;0.041;1.385;0.457;0.048;0.015;0.002
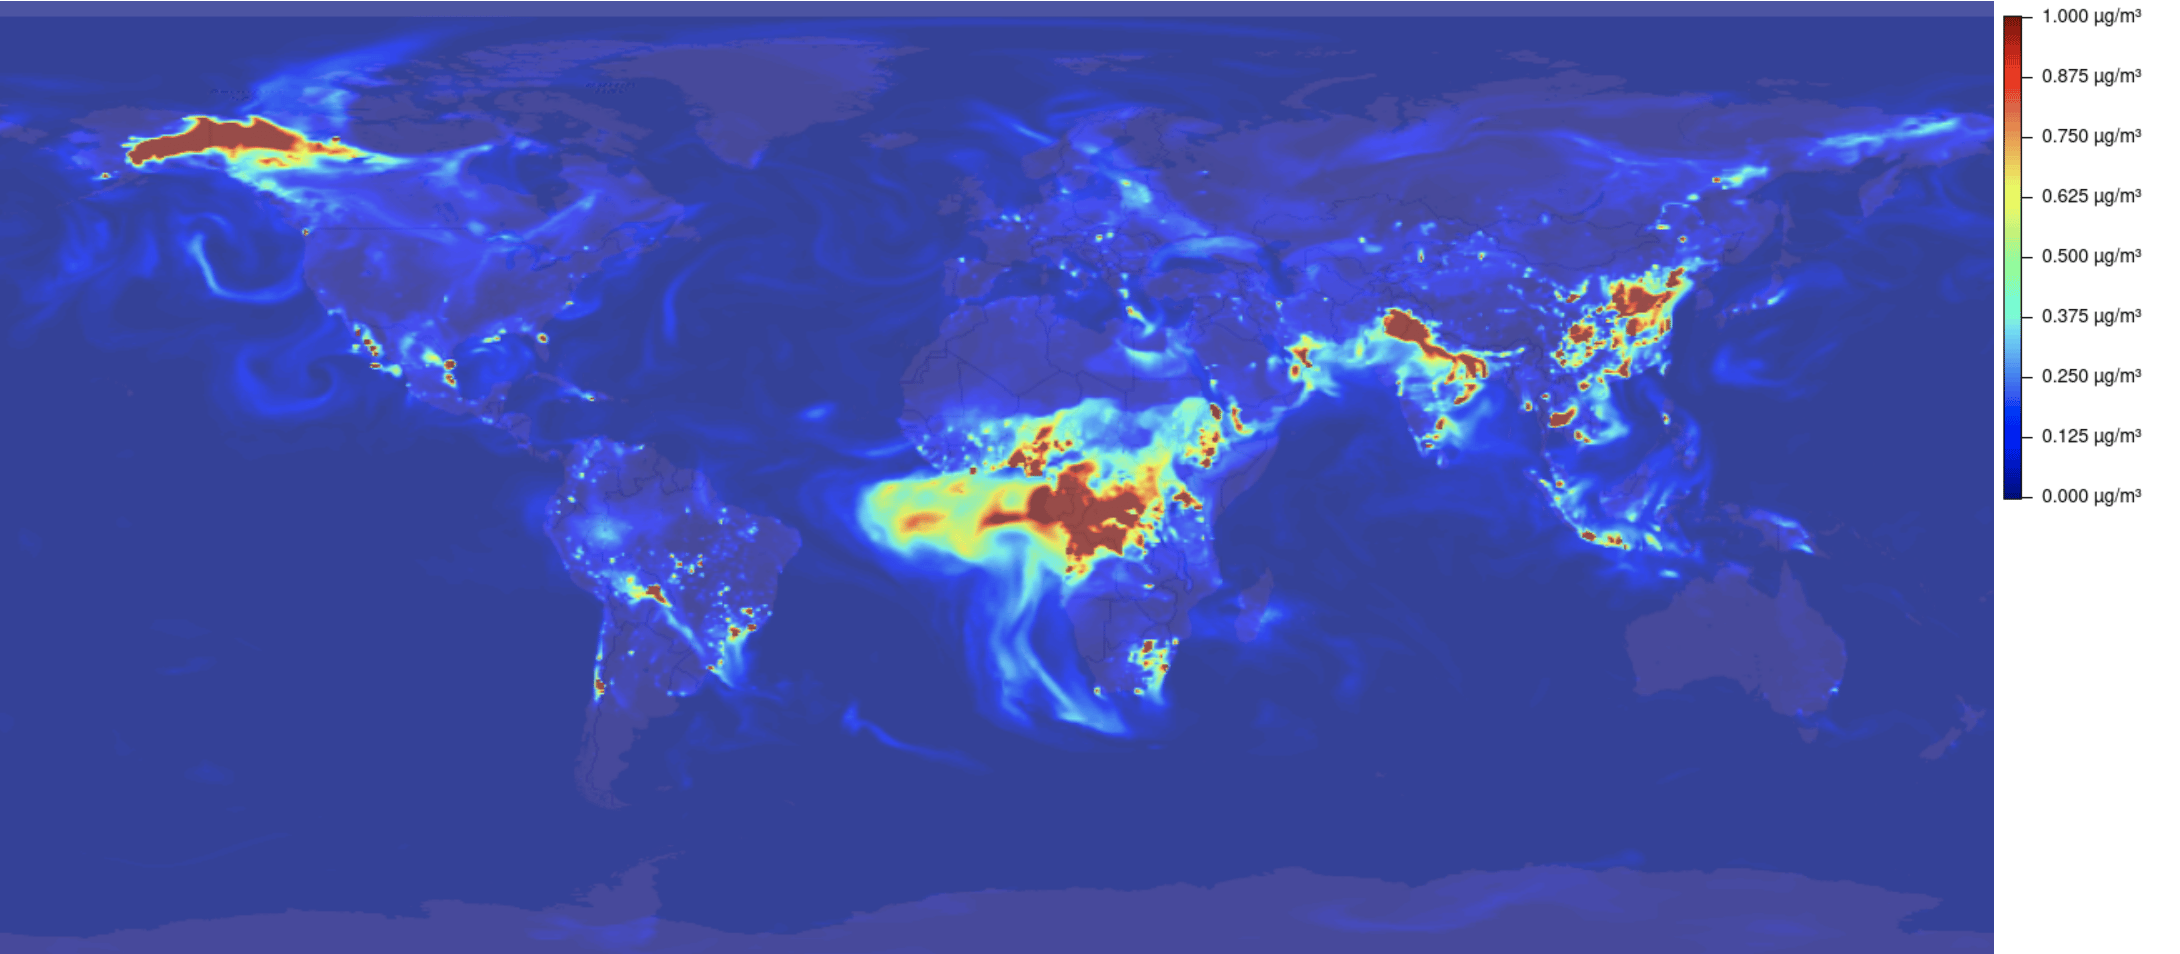
Hydrophobic Black Carbon Concentration
Hydrophobic black carbon concentration at surface in units [μg/m3].
black_carbon_hydrophob:ugm3Examples
-
-
https://api.meteomatics.com/2025-07-03T00:00:00Z/black_carbon_hydrophob:ugm3/70,-15_35,30:9,25/json
{"version":"3.0","user":"api-test","dateGenerated":"2018-02-28T10:13:40Z","status":"OK","data":
[{"parameter":"black_carbon_hydrophob:ugm3","coordinates":
[{"lat":35,"lon":-15,"dates":[{"date":"2018-02-28T00:00:00Z","value":0.011}]},
{"lat":35,"lon":10,"dates":[{"date":"2018-02-28T00:00:00Z","value":0.529}]},
{"lat":44,"lon":-15,"dates":[{"date":"2018-02-28T00:00:00Z","value":0.131}]},
{"lat":44,"lon":10,"dates":[{"date":"2018-02-28T00:00:00Z","value":0.236}]},
{"lat":53,"lon":-15,"dates":[{"date":"2018-02-28T00:00:00Z","value":0.092}]},
{"lat":53,"lon":10,"dates":[{"date":"2018-02-28T00:00:00Z","value":0.158}]},
{"lat":62,"lon":-15,"dates":[{"date":"2018-02-28T00:00:00Z","value":0.053}]},
{"lat":62,"lon":10,"dates":[{"date":"2018-02-28T00:00:00Z","value":0.014}]}]}]}
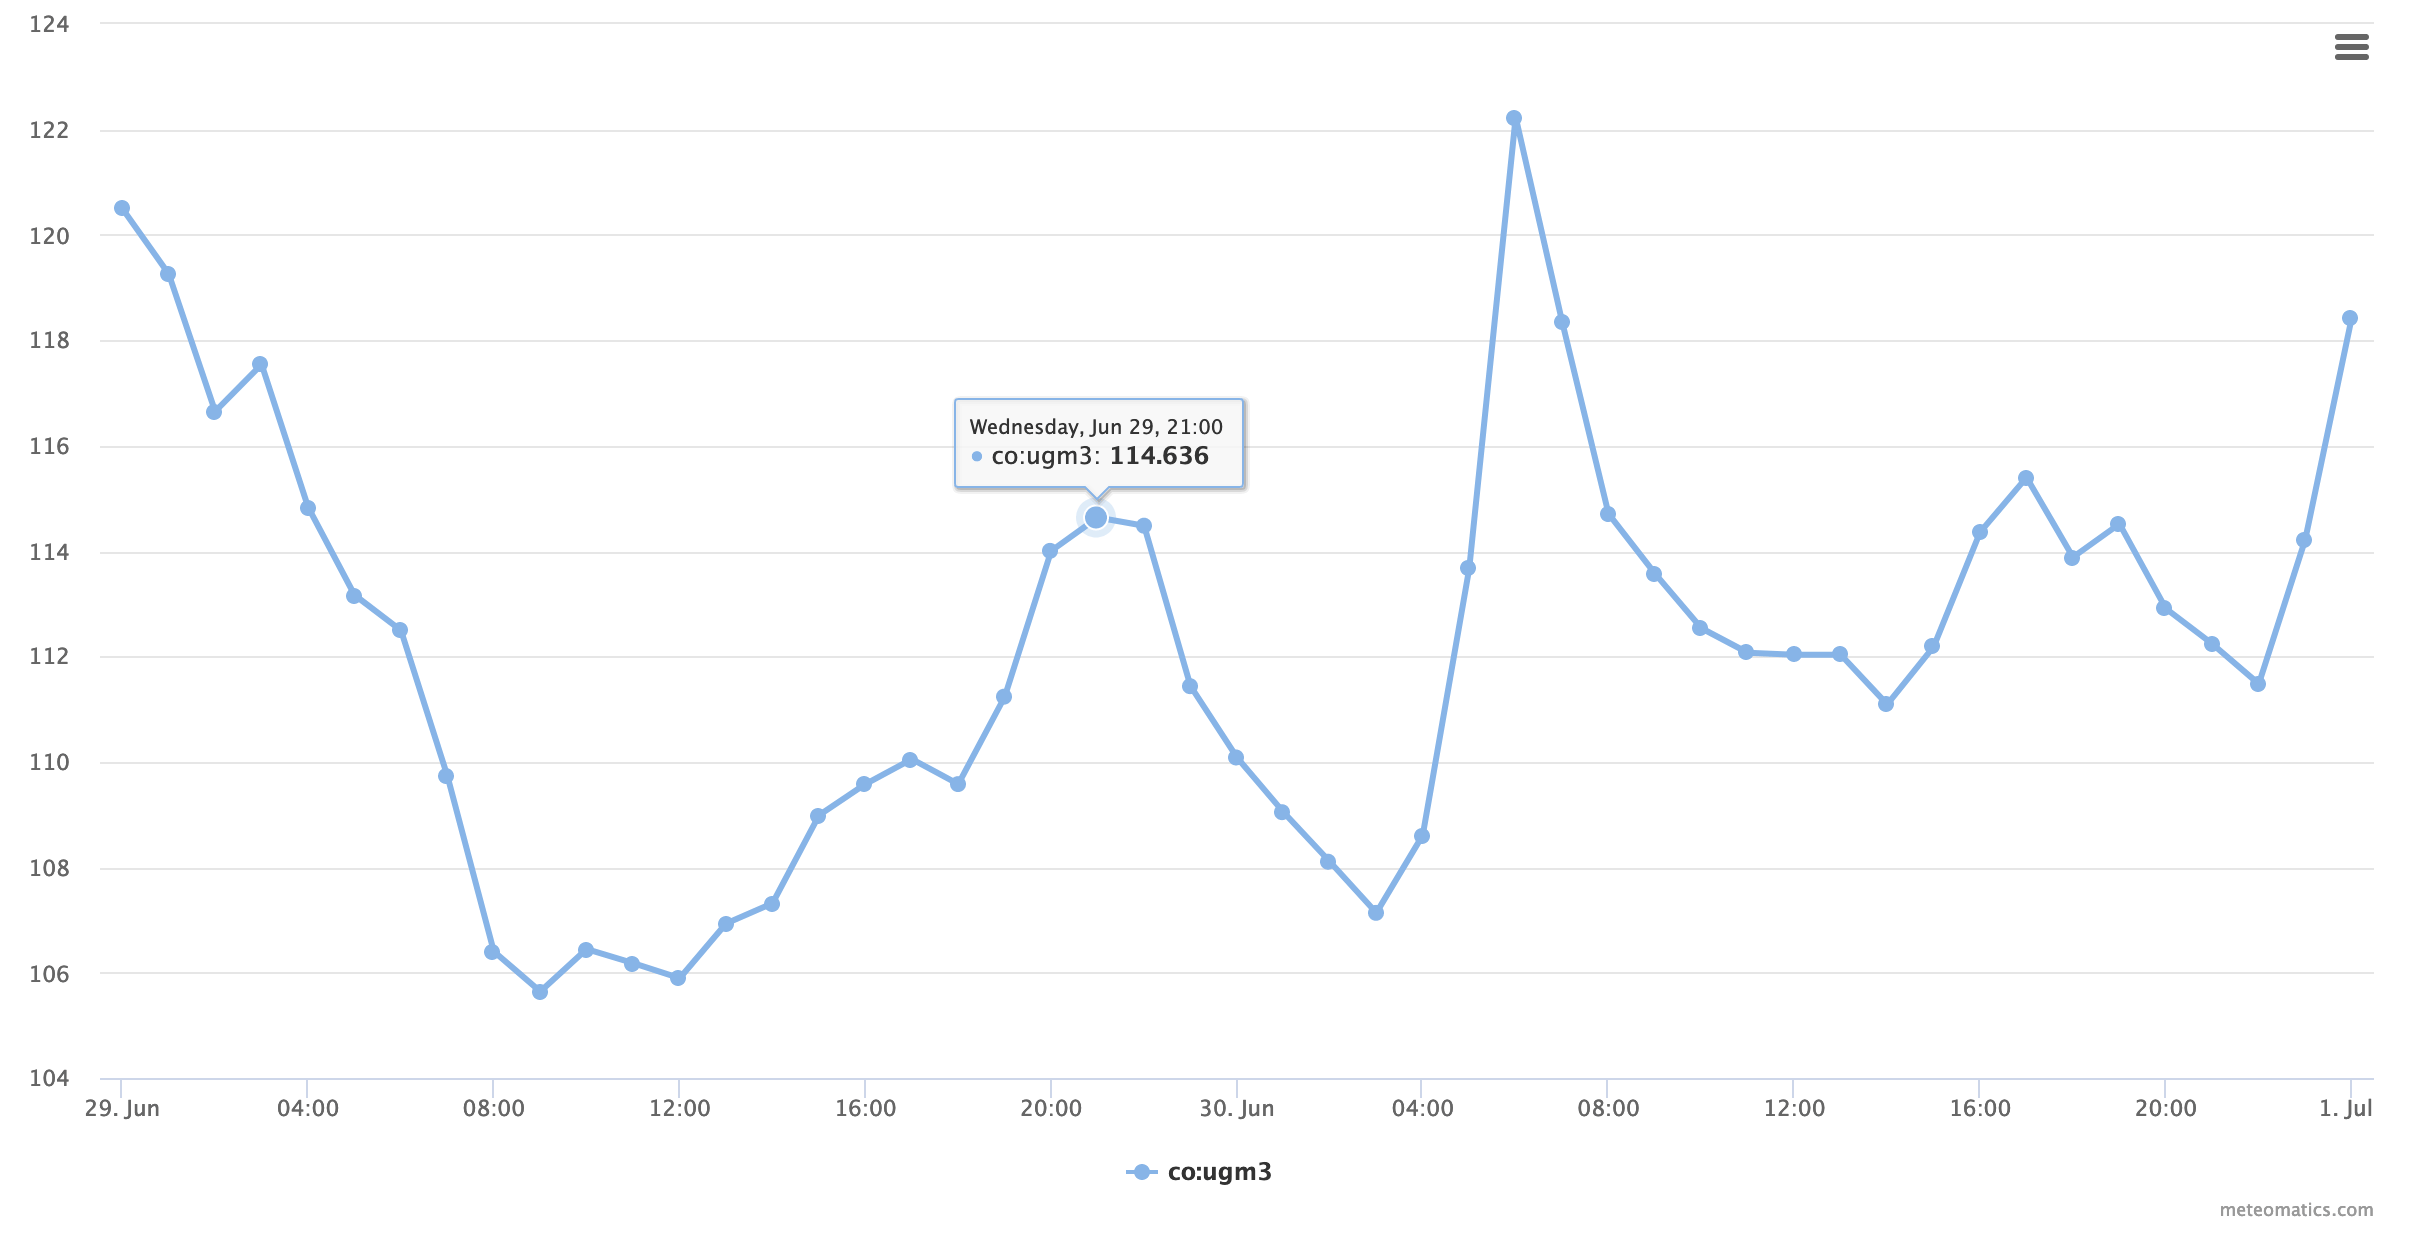
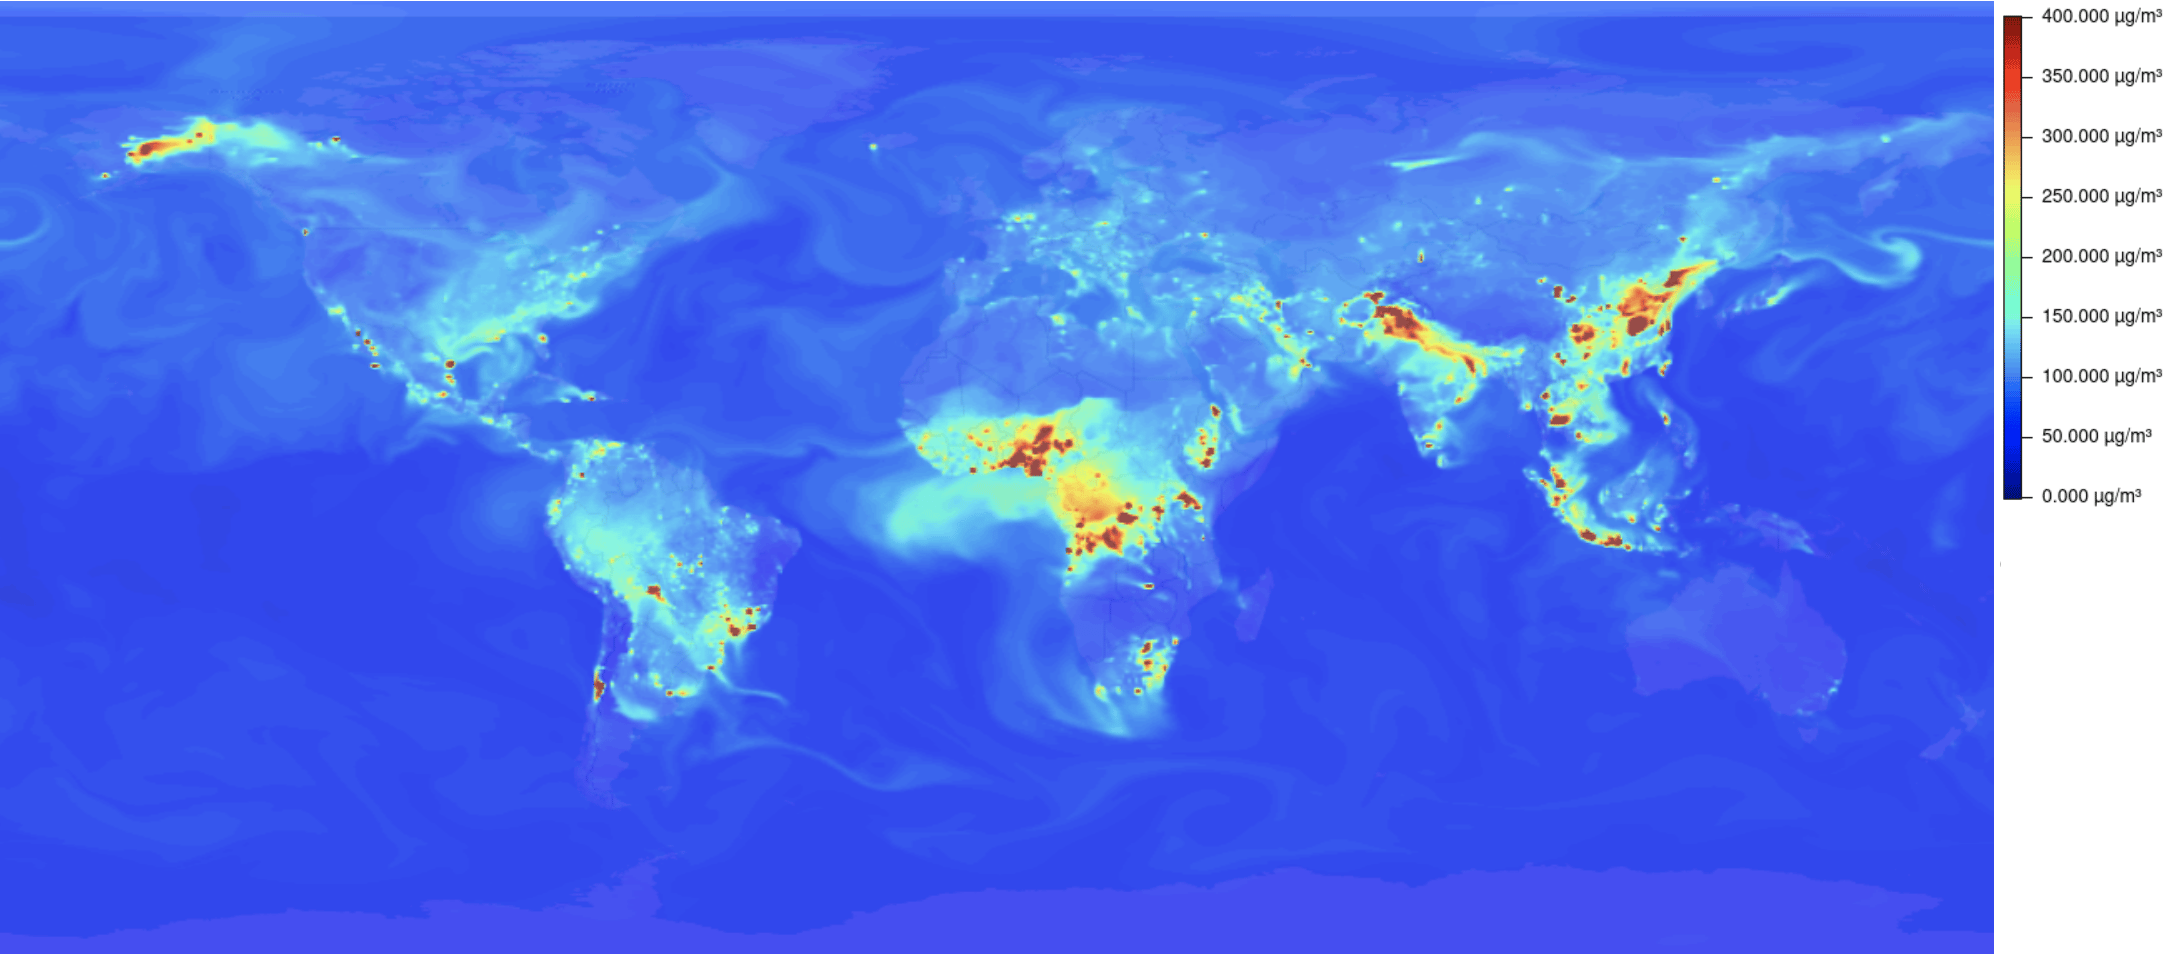
Carbon Monoxide Concentration
Carbon monoxide concentration at surface in units of [μg/m3].
co:ugm3Examples
-
Show the evolution of the carbon monoxide concentration over a period of two days
https://api.meteomatics.com/2025-07-03T00:00:00ZP2D:PT1H/co:ugm3/47.412164,9.340652/html
-
https://api.meteomatics.com/2025-07-03T00:00:00Z/co:ugm3/90,-180_-90,180:1000x600/html_map
-
https://api.meteomatics.com/2025-07-03T00:00:00Z/co:ugm3/70,-15_35,30:4x2/json
{"version":"3.0","user":"api-test","dateGenerated":"2018-02-21T14:06:00Z","status":"OK","data":
[{"parameter":"co:ugm3","coordinates":
[{"lat":35,"lon":-15,"dates":[{"date":"2018-02-21T00:00:00Z","value":128.508}]},
{"lat":35,"lon":0,"dates":[{"date":"2018-02-21T00:00:00Z","value":142.227}]},
{"lat":35,"lon":15,"dates":[{"date":"2018-02-21T00:00:00Z","value":157.87}]},
{"lat":35,"lon":30,"dates":[{"date":"2018-02-21T00:00:00Z","value":143.111}]},
{"lat":70,"lon":-15,"dates":[{"date":"2018-02-21T00:00:00Z","value":137.269}]},
{"lat":70,"lon":0,"dates":[{"date":"2018-02-21T00:00:00Z","value":131.778}]},
{"lat":70,"lon":15,"dates":[{"date":"2018-02-21T00:00:00Z","value":130.019}]},
{"lat":70,"lon":30,"dates":[{"date":"2018-02-21T00:00:00Z","value":129.45}]}]}]}

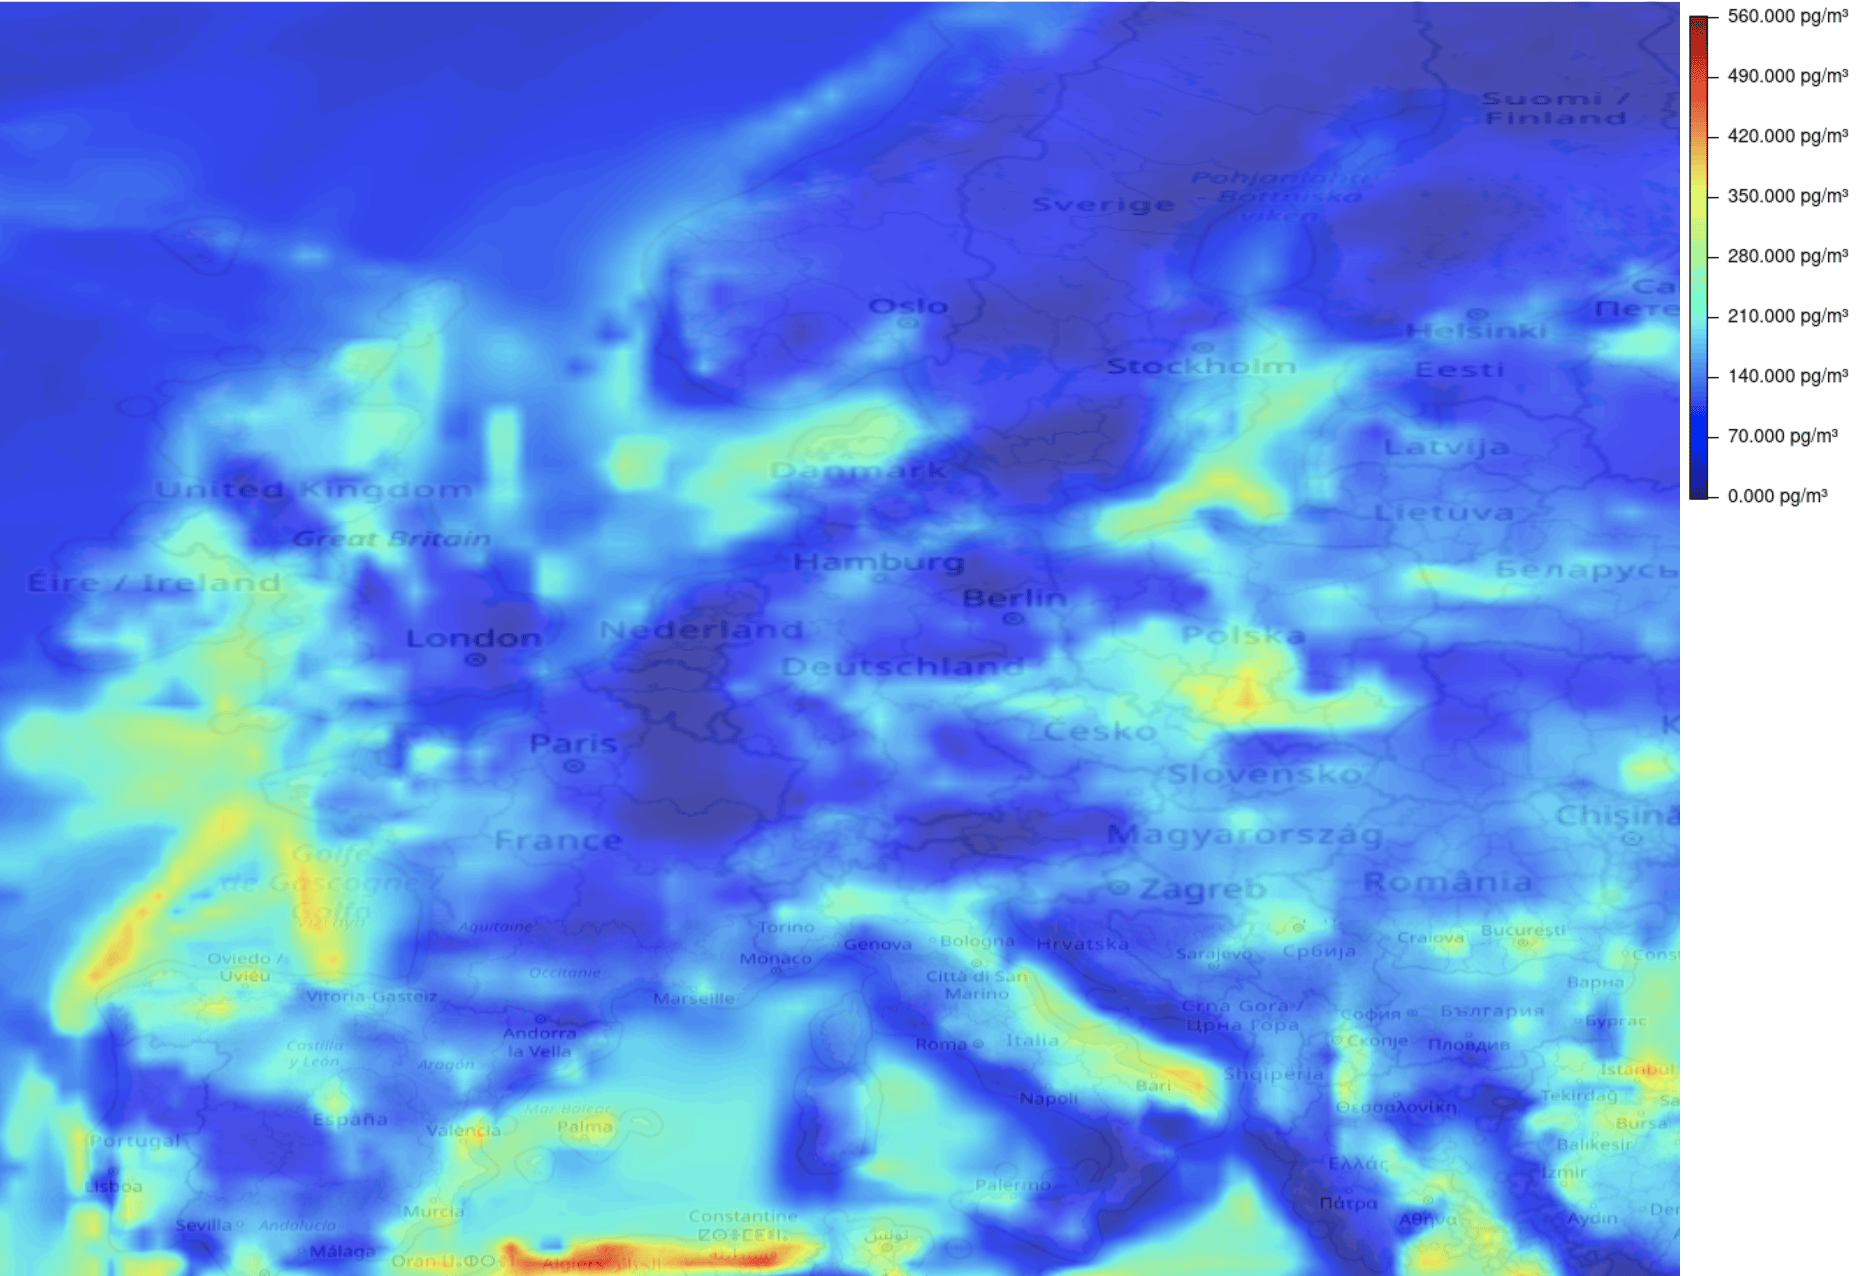
Hydroxyl Radikal
The hydroxyl radical (OH) is the major oxidizing chemical in the atmosphere, destroying about 3.7 Gt of trace gases, including CH4 and all Hydrofluorocarbons (HFCs) and hydrochlorofluorocarbons (HCFCs), each year (Ehhalt, 1999). This parameter is given in the units of .
oh:pgm3Example

Nitrogen Dioxide Concentration
Nitrogen dioxide concentration at surface in units of [μg/m3].
no2:ugm3Examples
-
https://api.meteomatics.com/2025-07-03T00:00:00Z/no2:ugm3/90,-180_-90,180:1000x600/html_map
-
https://api.meteomatics.com/2025-07-03T00:00:00Z/no2:ugm3/90,-180_-90,180:6x6/csv
validdate;2018-02-21 00:00:00
parameter;no2:ugm3
data;-180;-108;-36;36;108;180
90;0.005;0.005;0.005;0.005;0.005;0.005
54;0.997;0.366;0.039;8.52;1.278;0.997
18;0.02;0.087;0.024;0.892;0.091;0.02
-18;0.002;0.008;0.008;0.815;0.015;0.002
-54;0.003;0.002;0.002;0.002;0.001;0.003
-90;0;0;0;0;0;0
Nitrogen Monoxide Concentration
Nitrogen monoxide concentration at surface in units of [μg/m3].
no:ugm3Examples

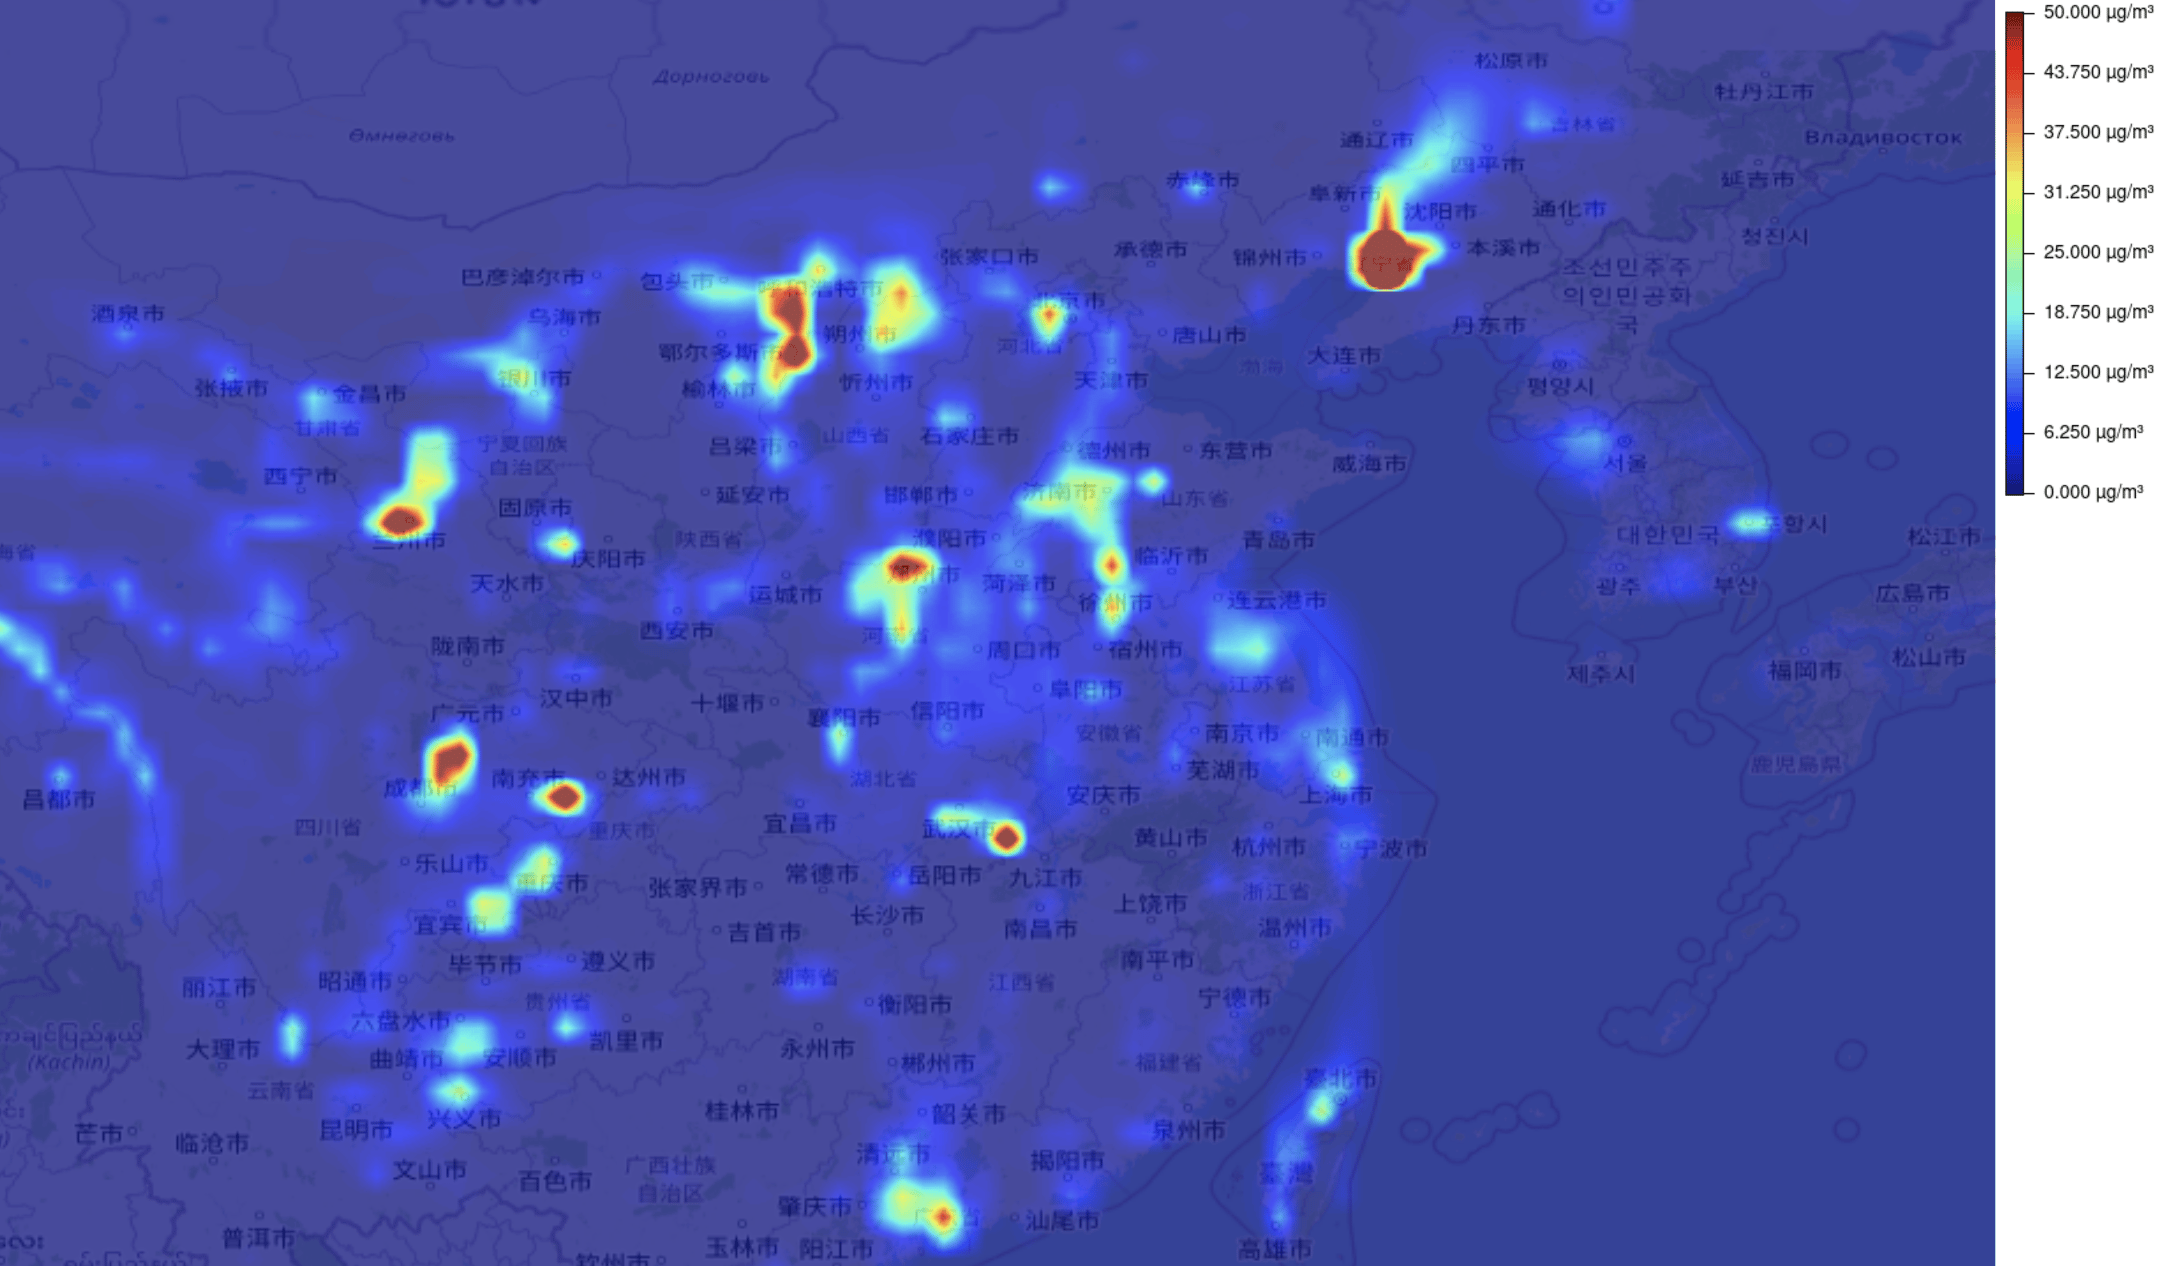
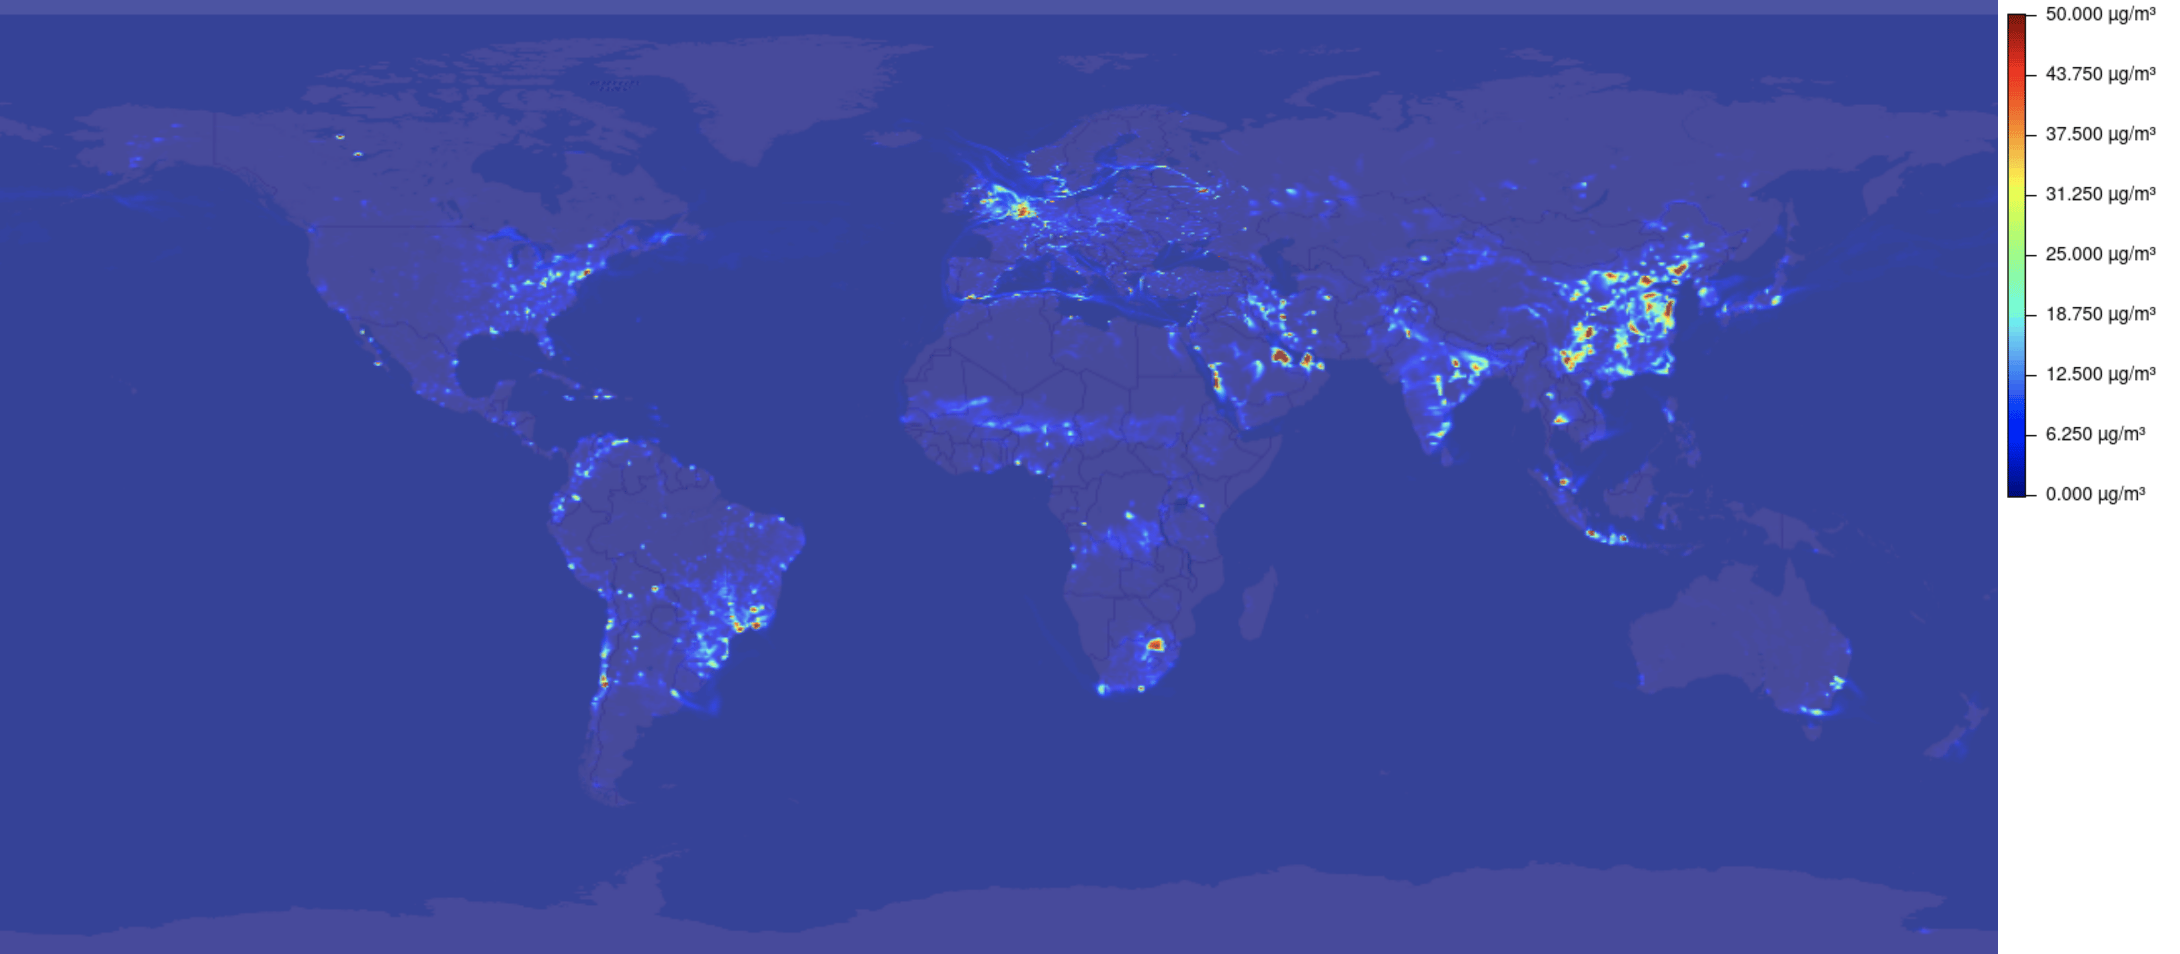
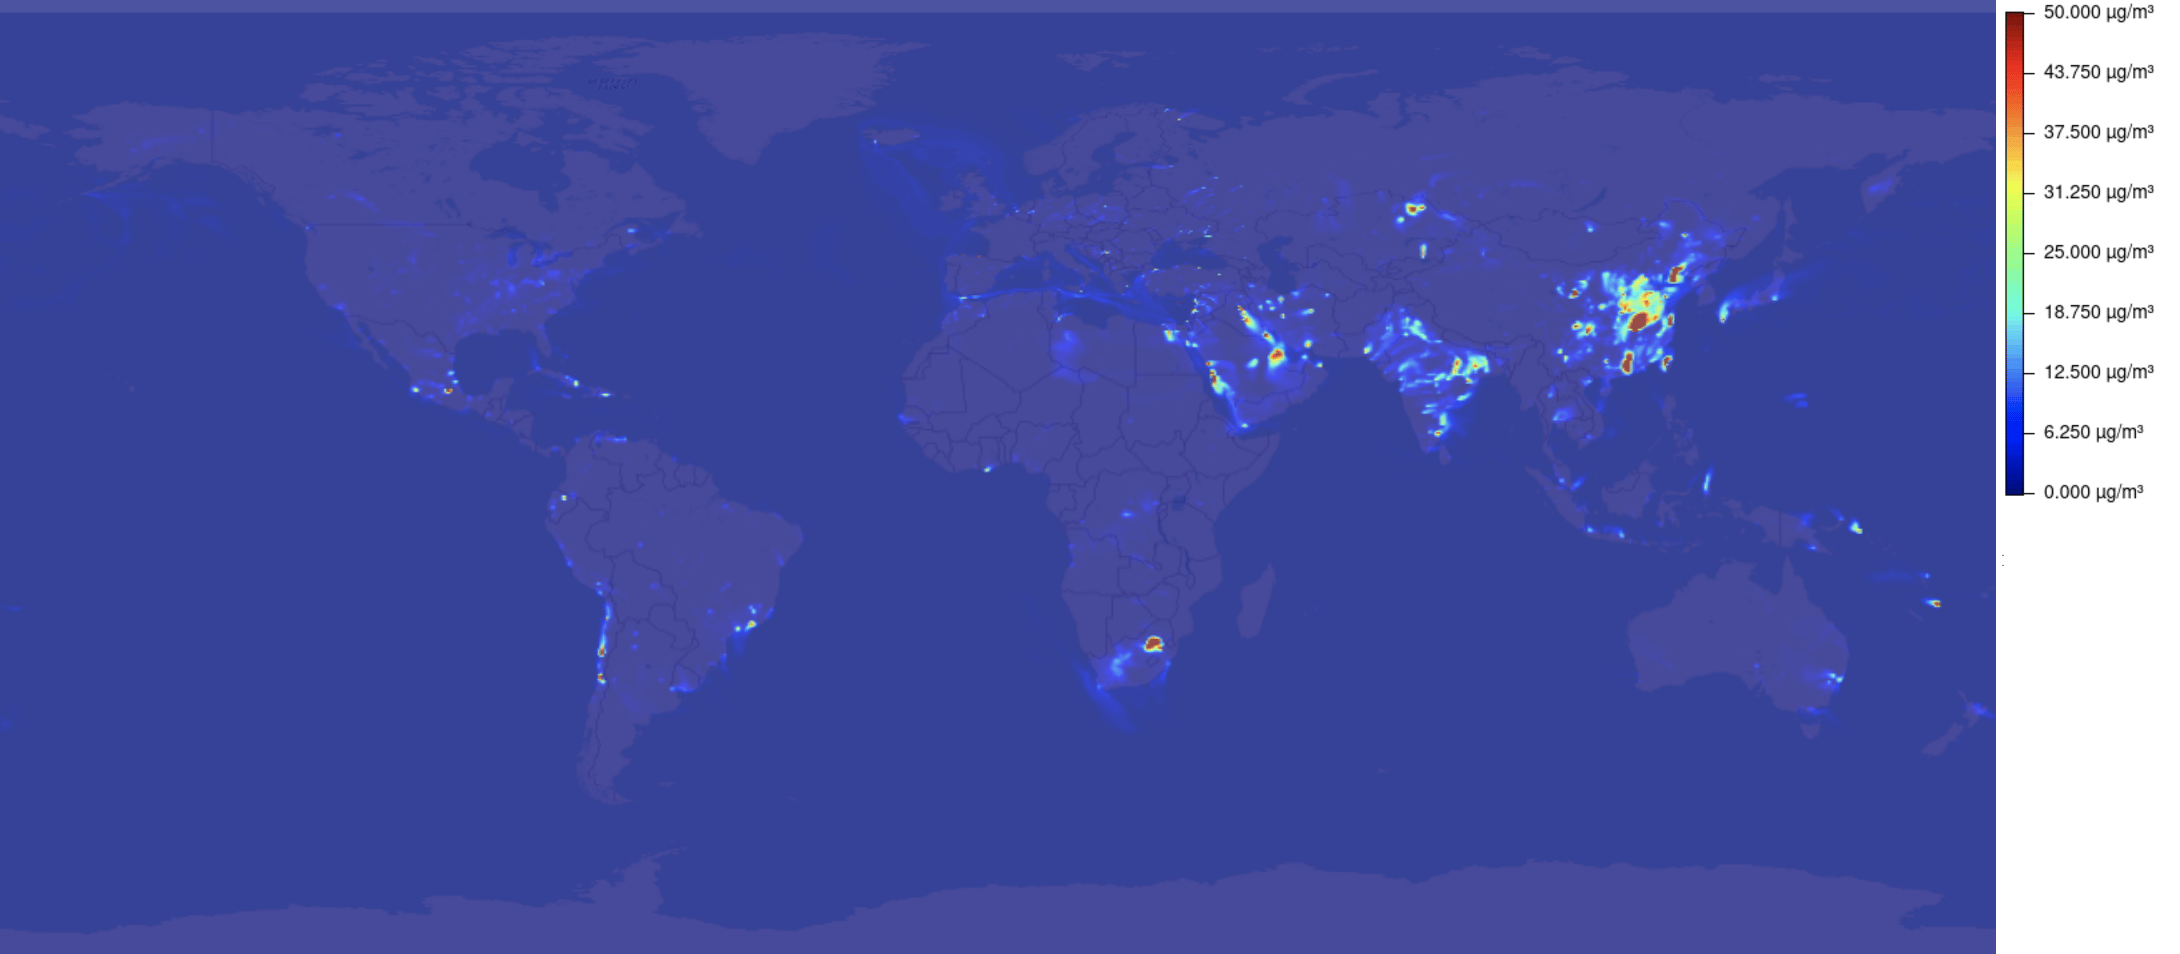
Sulfur Dioxide Concentration
Sulfur dioxide concentration at surface in units of [μg/m3].
so2:ugm3Examples
-
https://api.meteomatics.com/2025-07-03T00:00:00Z/so2:ugm3/90,-180_-90,180:1000x600/html_map
-
https://api.meteomatics.com/2025-07-03T00:00:00Z/so2:ugm3/70,-15/json
{"version":"3.0","user":"api-test","dateGenerated":"2018-02-07T13:20:56Z","status":"OK","data":
[{"parameter":"so2:ugm3","coordinates":[{"lat":70,"lon":-15,"dates":
[{"date":"2018-02-05T00:00:00Z","value":0.105}]}]}]}
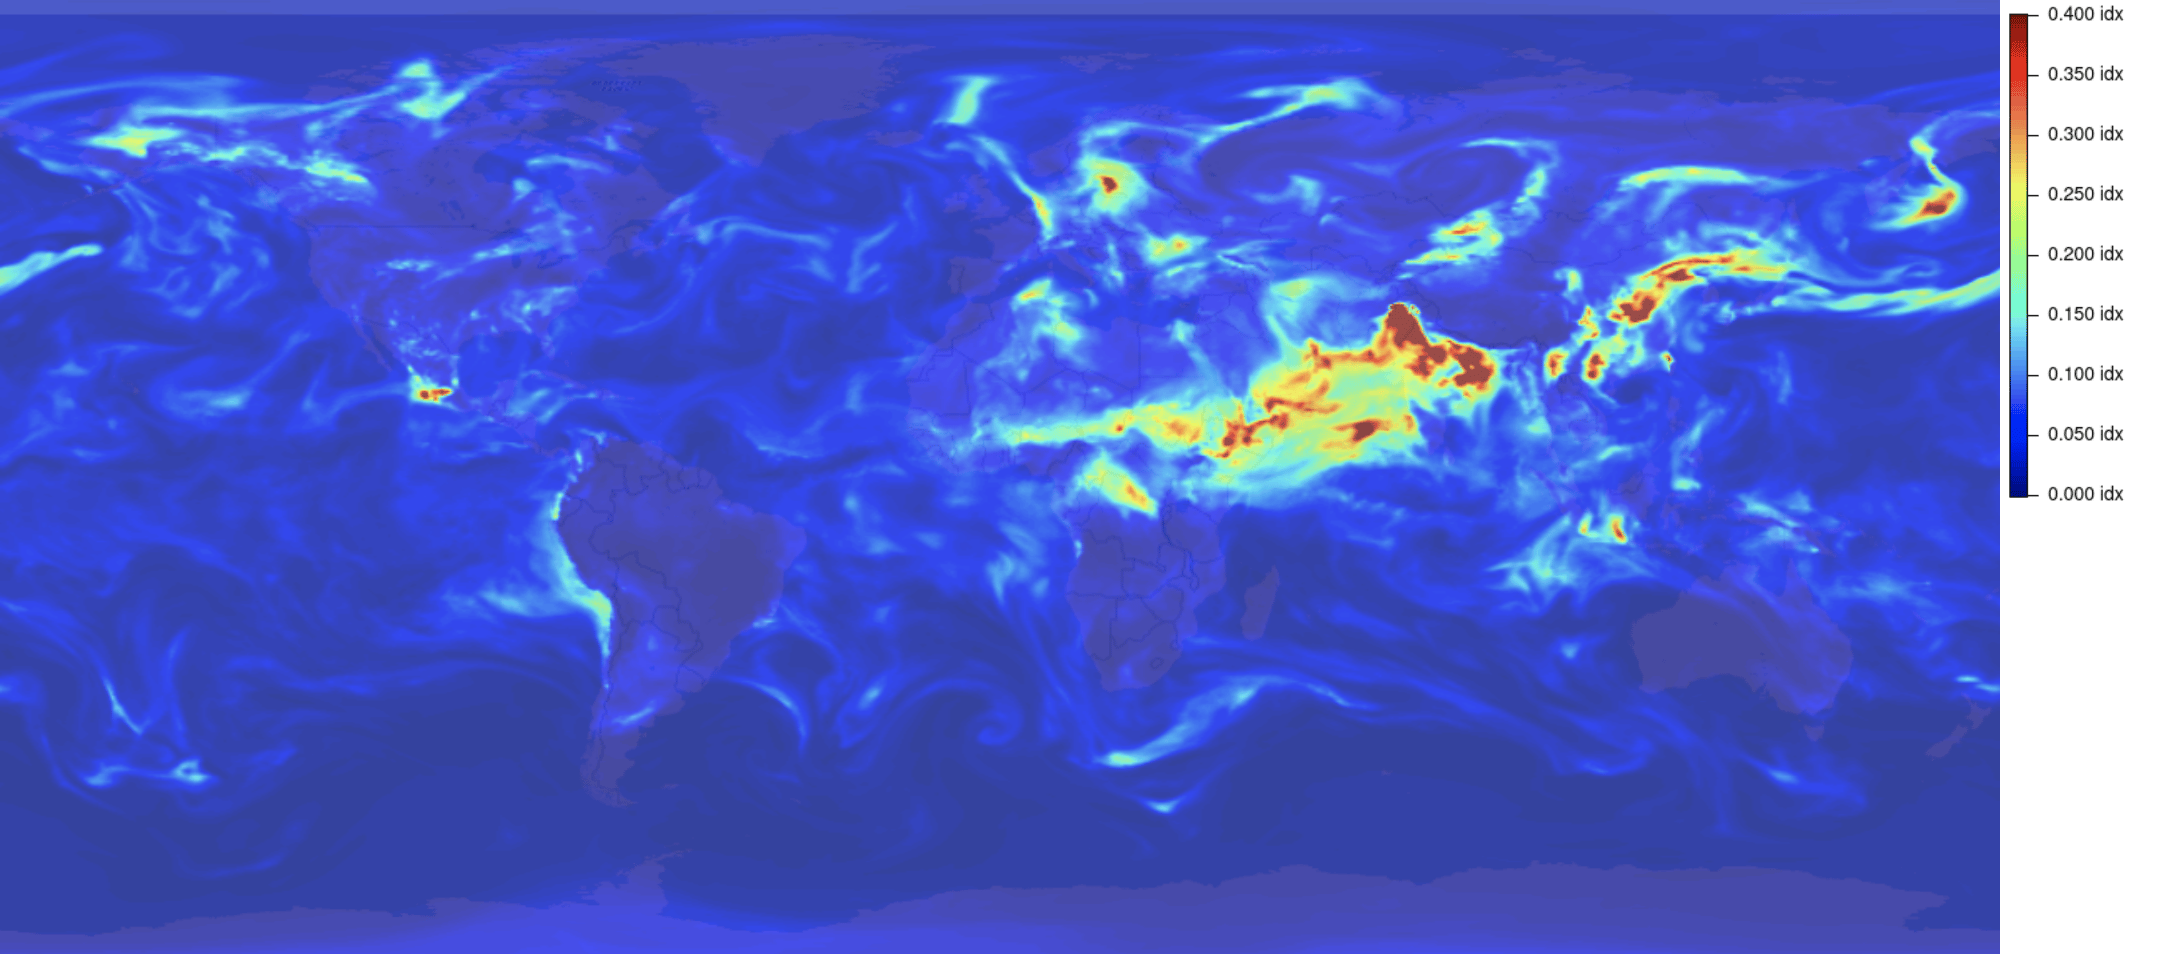
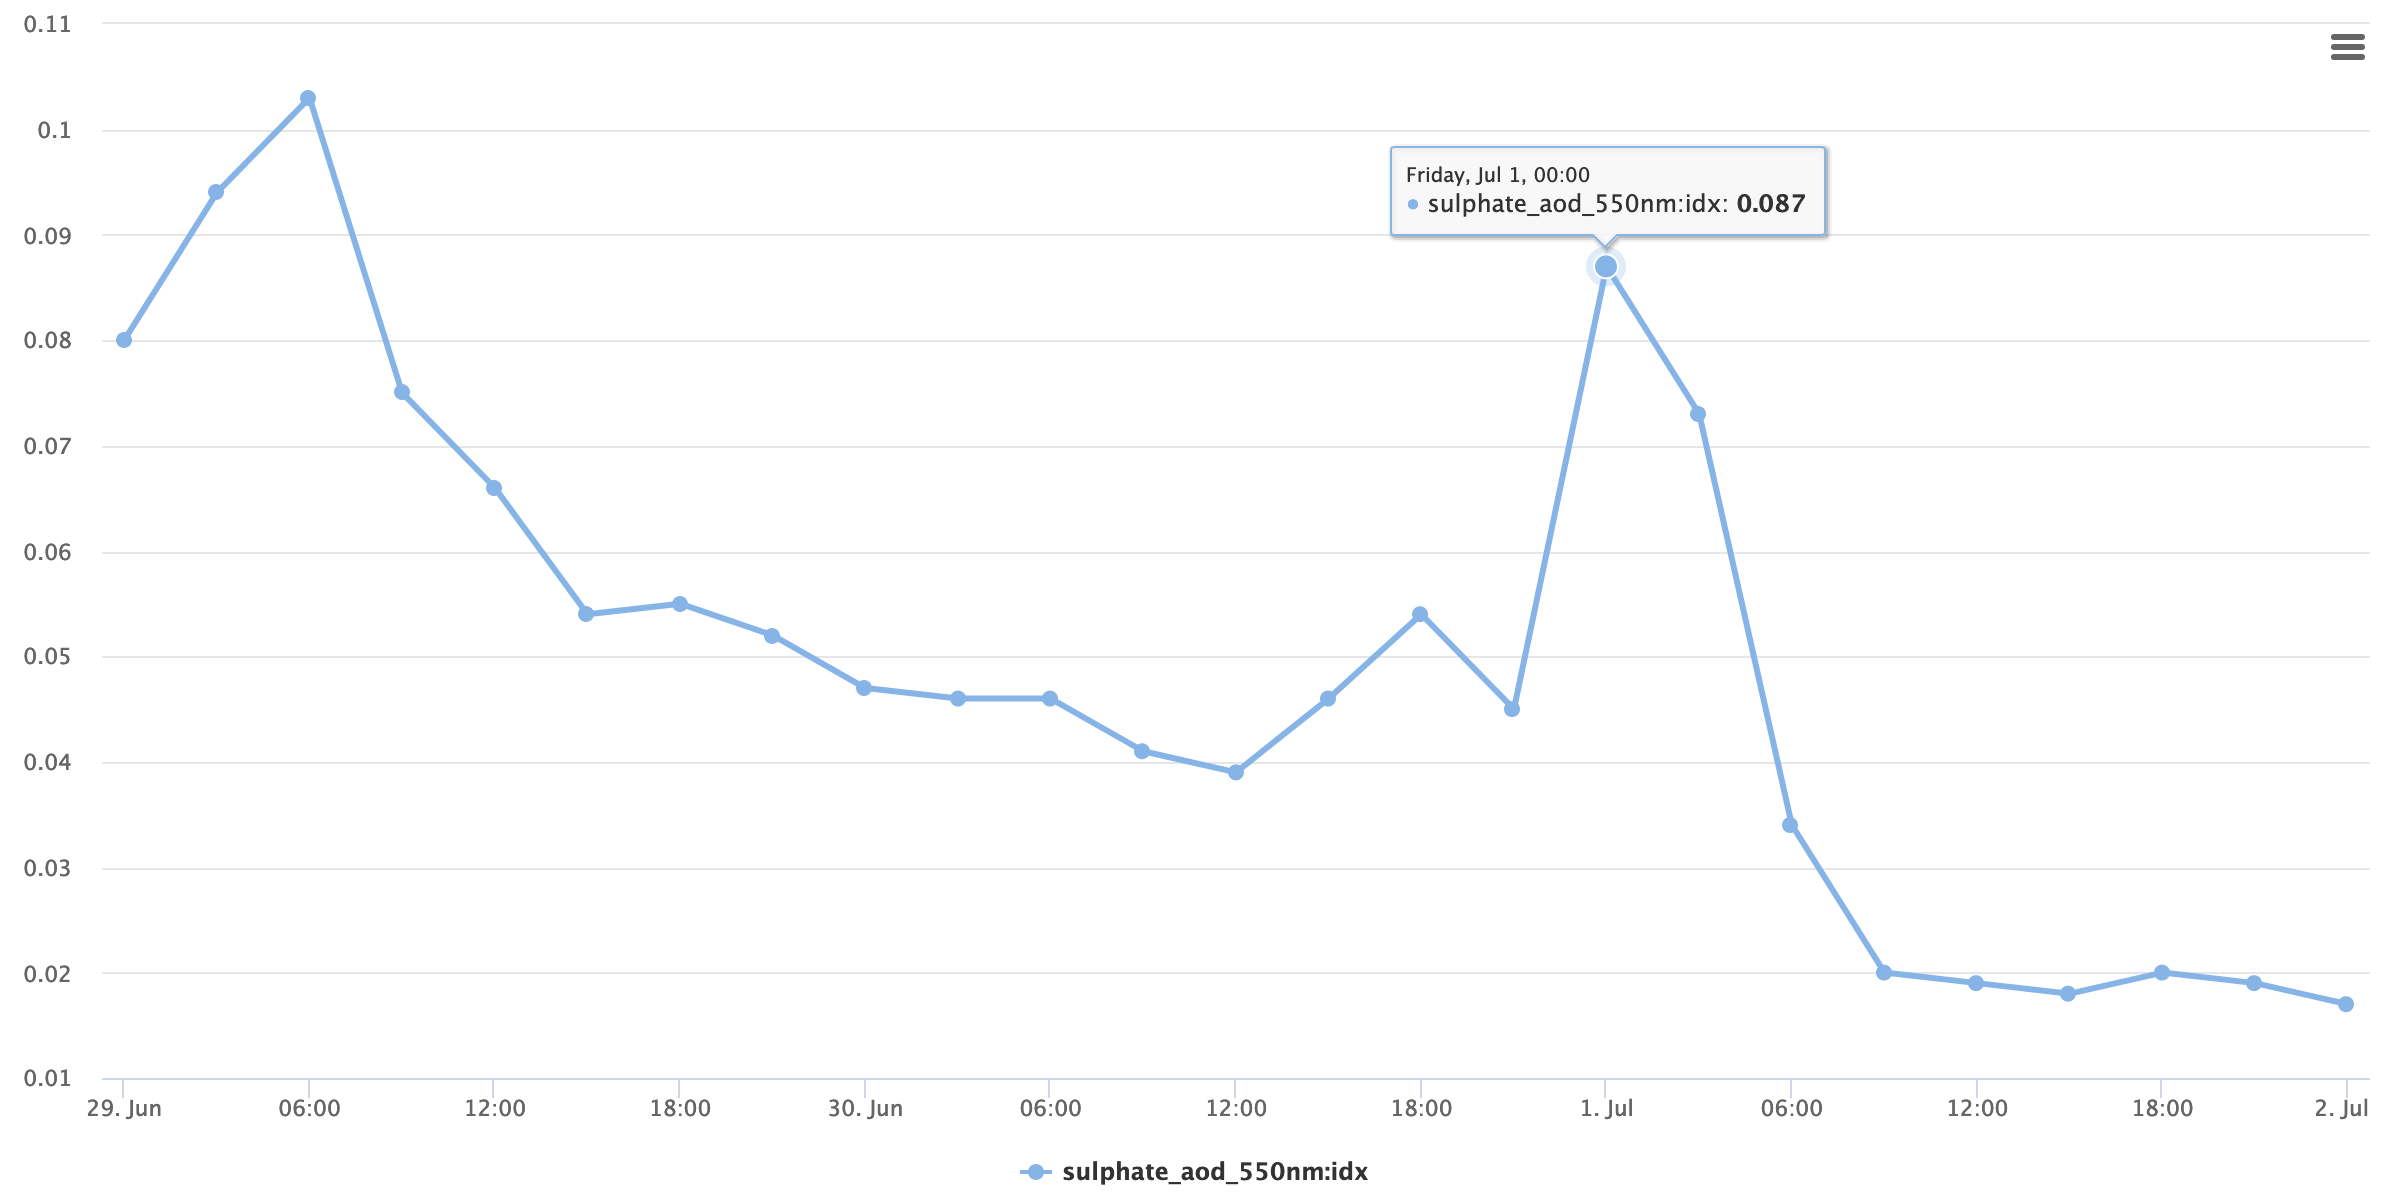
Sulfate Aerosol Optical Depth
Sulfate aerosol optical depth at 550 nm.
sulphate_aod_550nm:idxExamples
-
-
Show the evolution of the sulfate AOD over a period of three days
-
validdate;sulphate_aod_550nm:idx
2018-02-05T00:00:00Z;0.005
2018-02-05T03:00:00Z;0.004
2018-02-05T06:00:00Z;0.003
2018-02-05T09:00:00Z;0.004
2018-02-05T12:00:00Z;0.005
2018-02-05T15:00:00Z;0.008
2018-02-05T18:00:00Z;0.006
2018-02-05T21:00:00Z;0.007

Ozone Concentration
Ozone concentration at surface in units of [μg/m3].
o3:ugm3Examples

Total column of trace gases
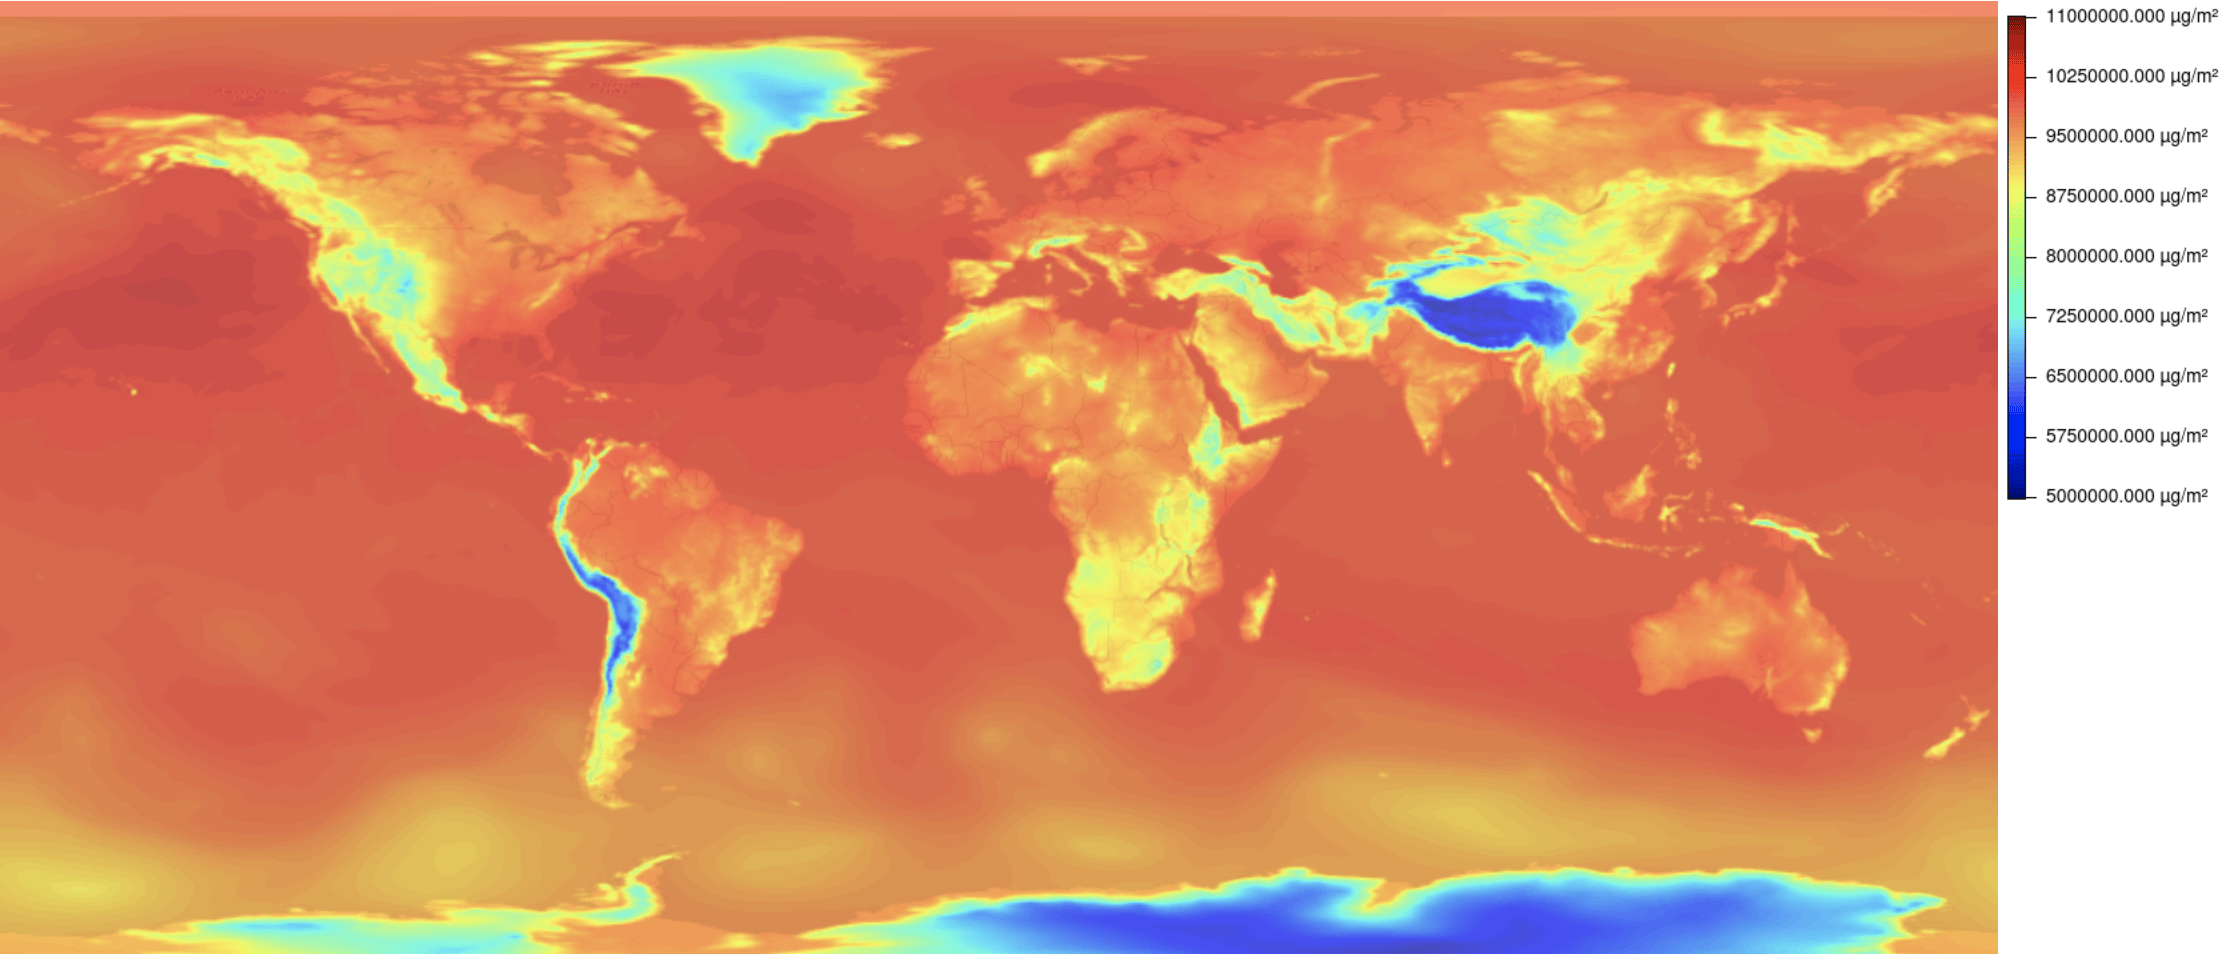
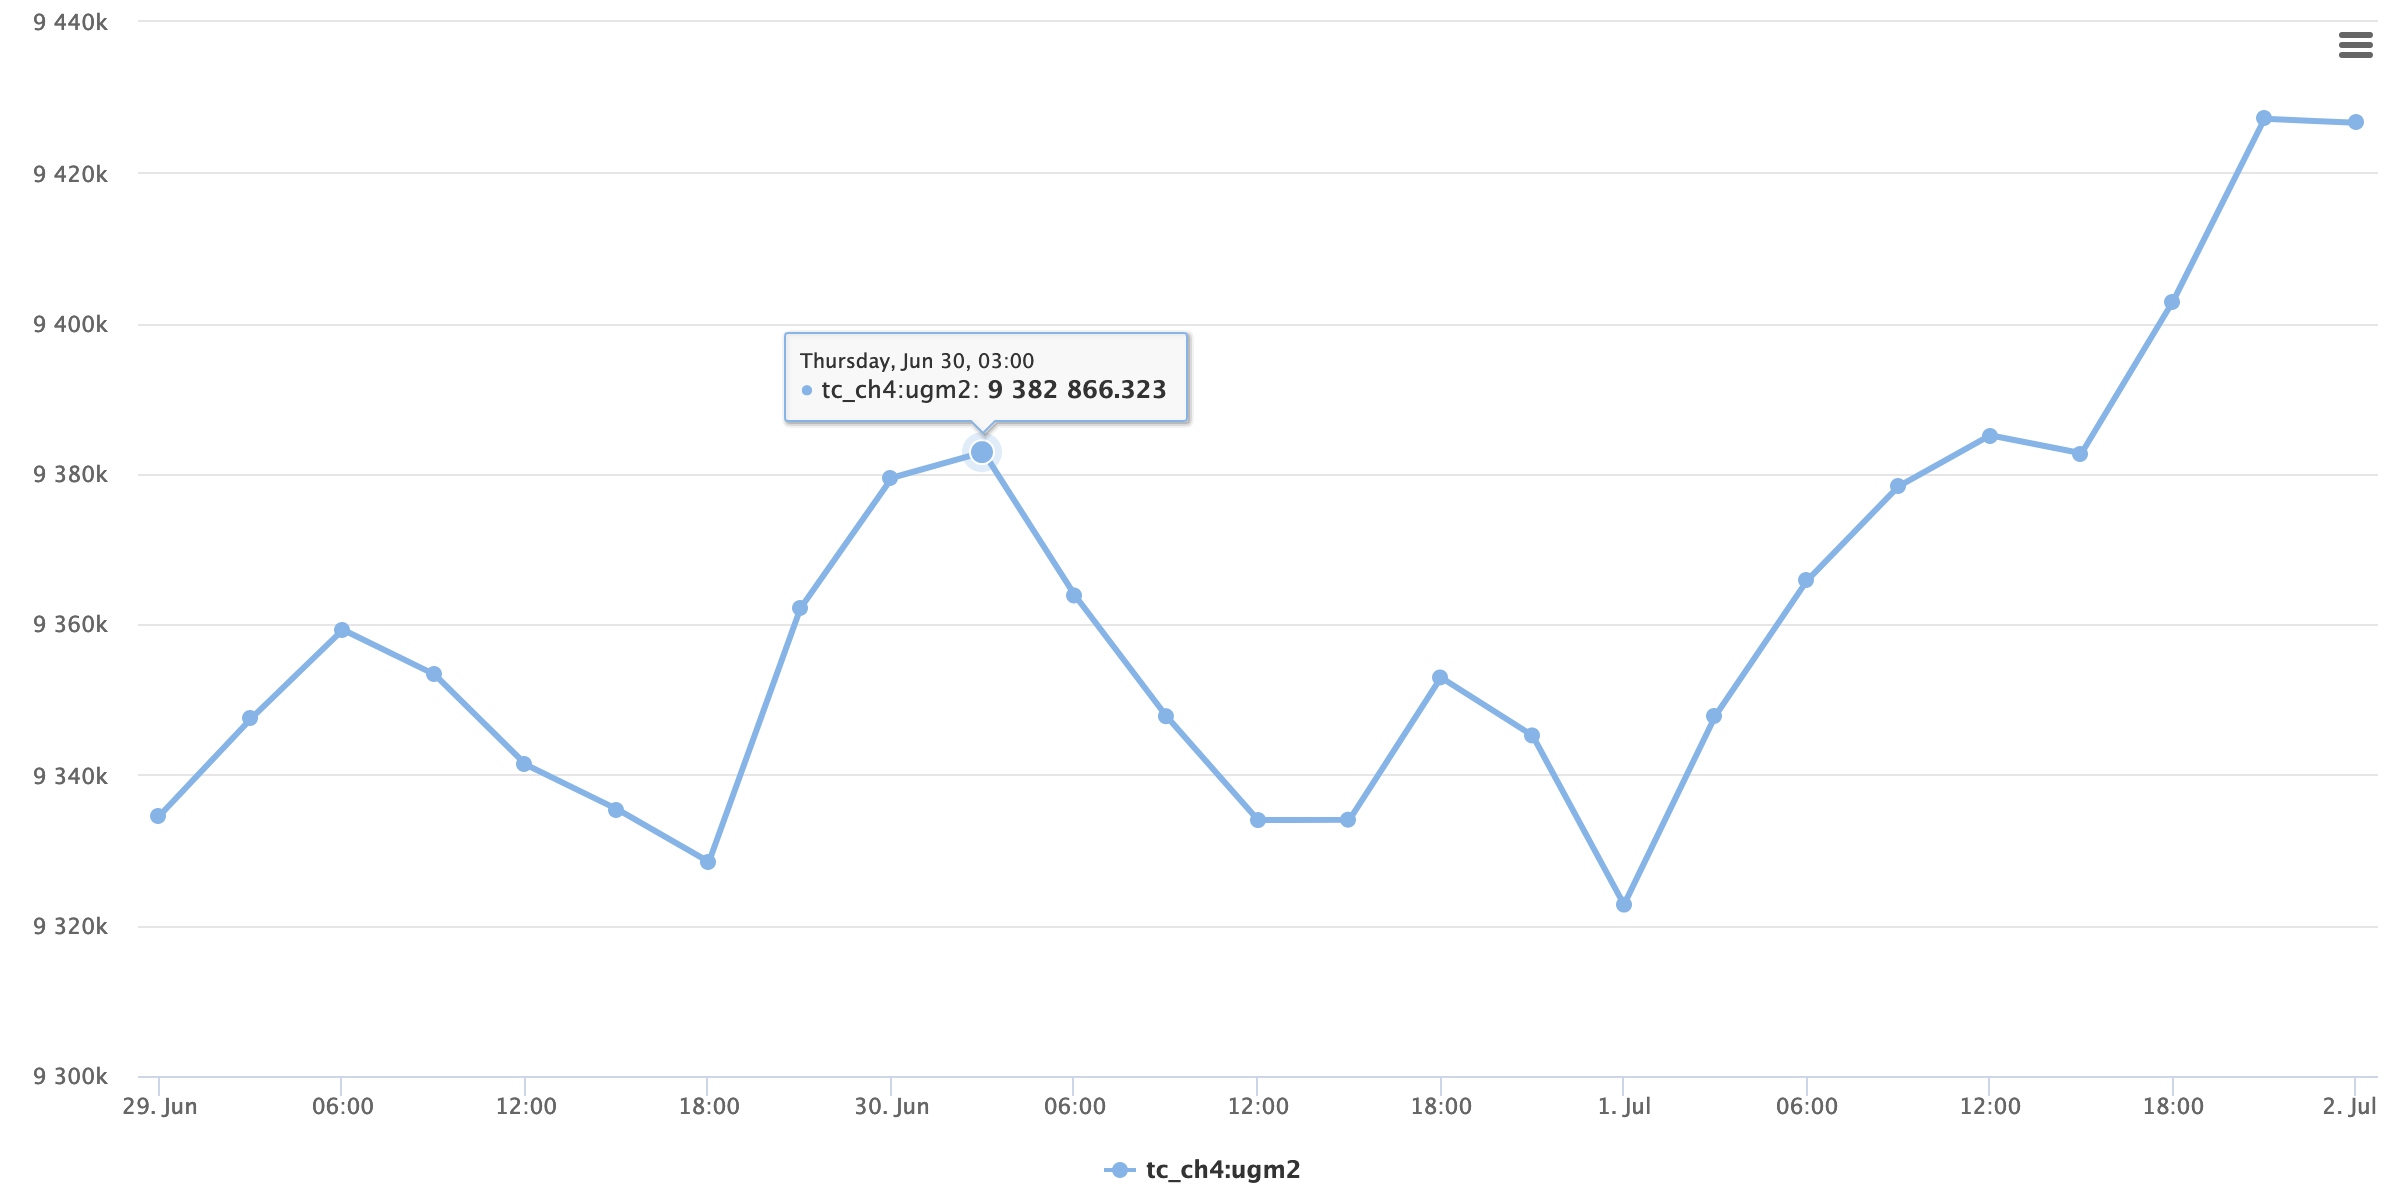
Methane
Total column content of methane in units of [μg/m2].
tc_ch4:ugm2Examples
-
https://api.meteomatics.com/2025-07-03T00:00:00Z/tc_ch4:ugm2/90,-180_-90,180:1000x600/html
-
Show the total column content of methane for the next three days.
https://api.meteomatics.com/2025-07-03T00:00:00ZP3D:PT3H/tc_ch4:ugm2/47.412164,9.340652/html
-
https://api.meteomatics.com/2025-07-03T00:00:00ZP3D:PT3H/tc_ch4:ugm2/47.412164,9.340652/json
{"version":"3.0","user":"api-test“,“dateGenerated":"2018-02-07T13:27:03Z","status":"OK","data":
[{"parameter":"tc_ch4:ugm2","coordinates":[{"lat":47.4122,"lon":9.34065,"dates":
[{"date":"2018-02-05T00:00:00Z","value":9423599.578},{"date":"2018-02-05T03:00:00Z","value":9433316.998},
{"date":"2018-02-05T06:00:00Z","value":9434212.931},{"date":"2018-02-05T09:00:00Z","value":9438452.311},
{"date":"2018-02-05T12:00:00Z","value":9444270.283},{"date":"2018-02-05T15:00:00Z","value":9436296.299},
{"date":"2018-02-05T18:00:00Z","value":9429648.519},{"date":"2018-02-05T21:00:00Z","value":9417010.471},
{"date":"2018-02-06T00:00:00Z","value":9406719.357}]}]}]}


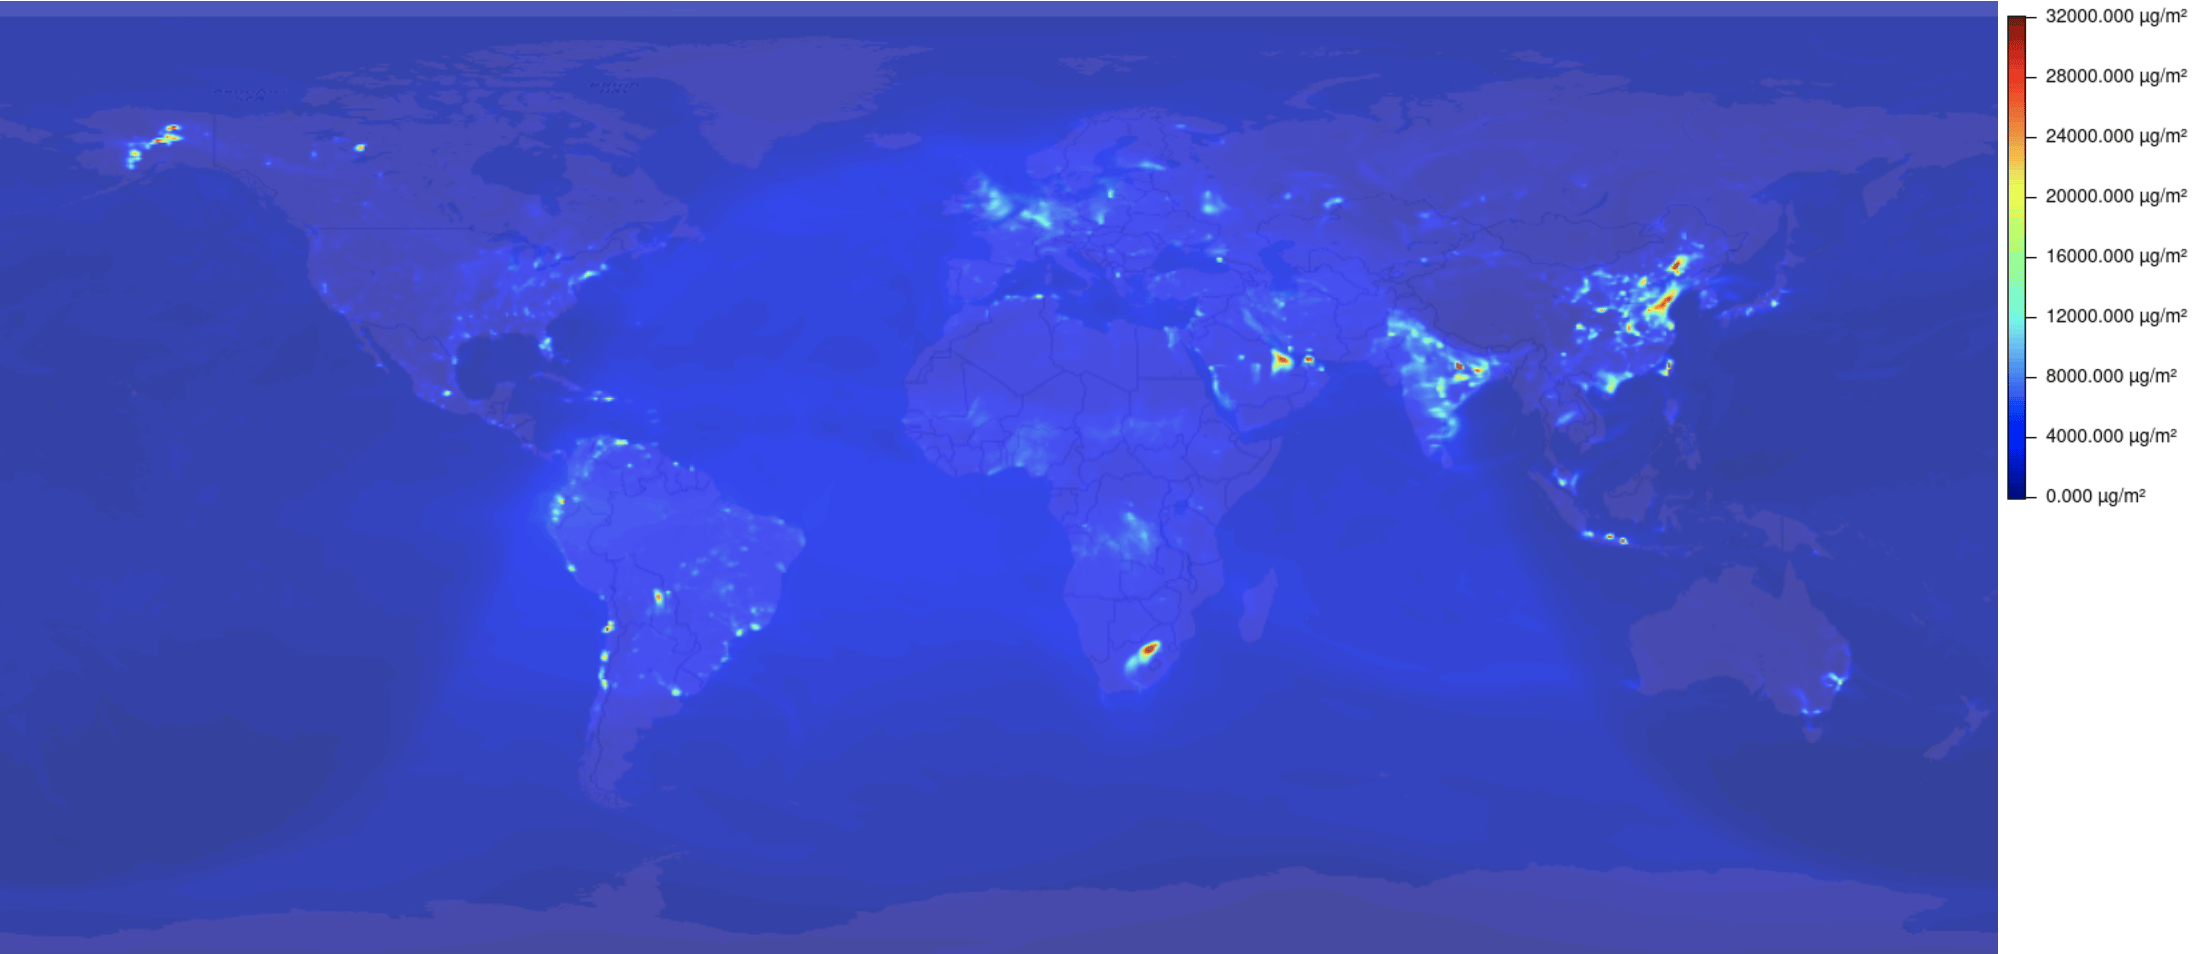
Nitrogen Dioxide
Total column content of nitrogen dioxide in units of [μg/m2].
tc_no2:ugm2Examples
-
https://api.meteomatics.com/2025-07-03T00:00:00Z/tc_no2:ugm2/90,-180_-90,180:1000x600/html_map
-
https://api.meteomatics.com/2025-07-03T00:00:00Z/tc_no2:ugm2/90,-180_-90,180:6x6/csv
validdate;2018-02-21 00:00:00
parameter;tc_no2:ugm2
data;-180;-108;-36;36;108;180
90;186.573;186.573;186.573;186.573;186.573;186.573
54;680.858;1006.574;897.965;3722.696;1251.57;680.858
18;352.654;460.062;1150.776;989.766;507.661;352.654
-18;287.731;378.084;704.229;1154.283;391.457;287.731
-54;149.961;243.268;440.992;353.717;137.089;149.961
-90;121.082;121.082;121.082;121.082;121.082;121.082

Nitrogen Monoxide
Total column content of nitrogen monoxide in units of [μg/m2].
tc_no:ugm2Examples

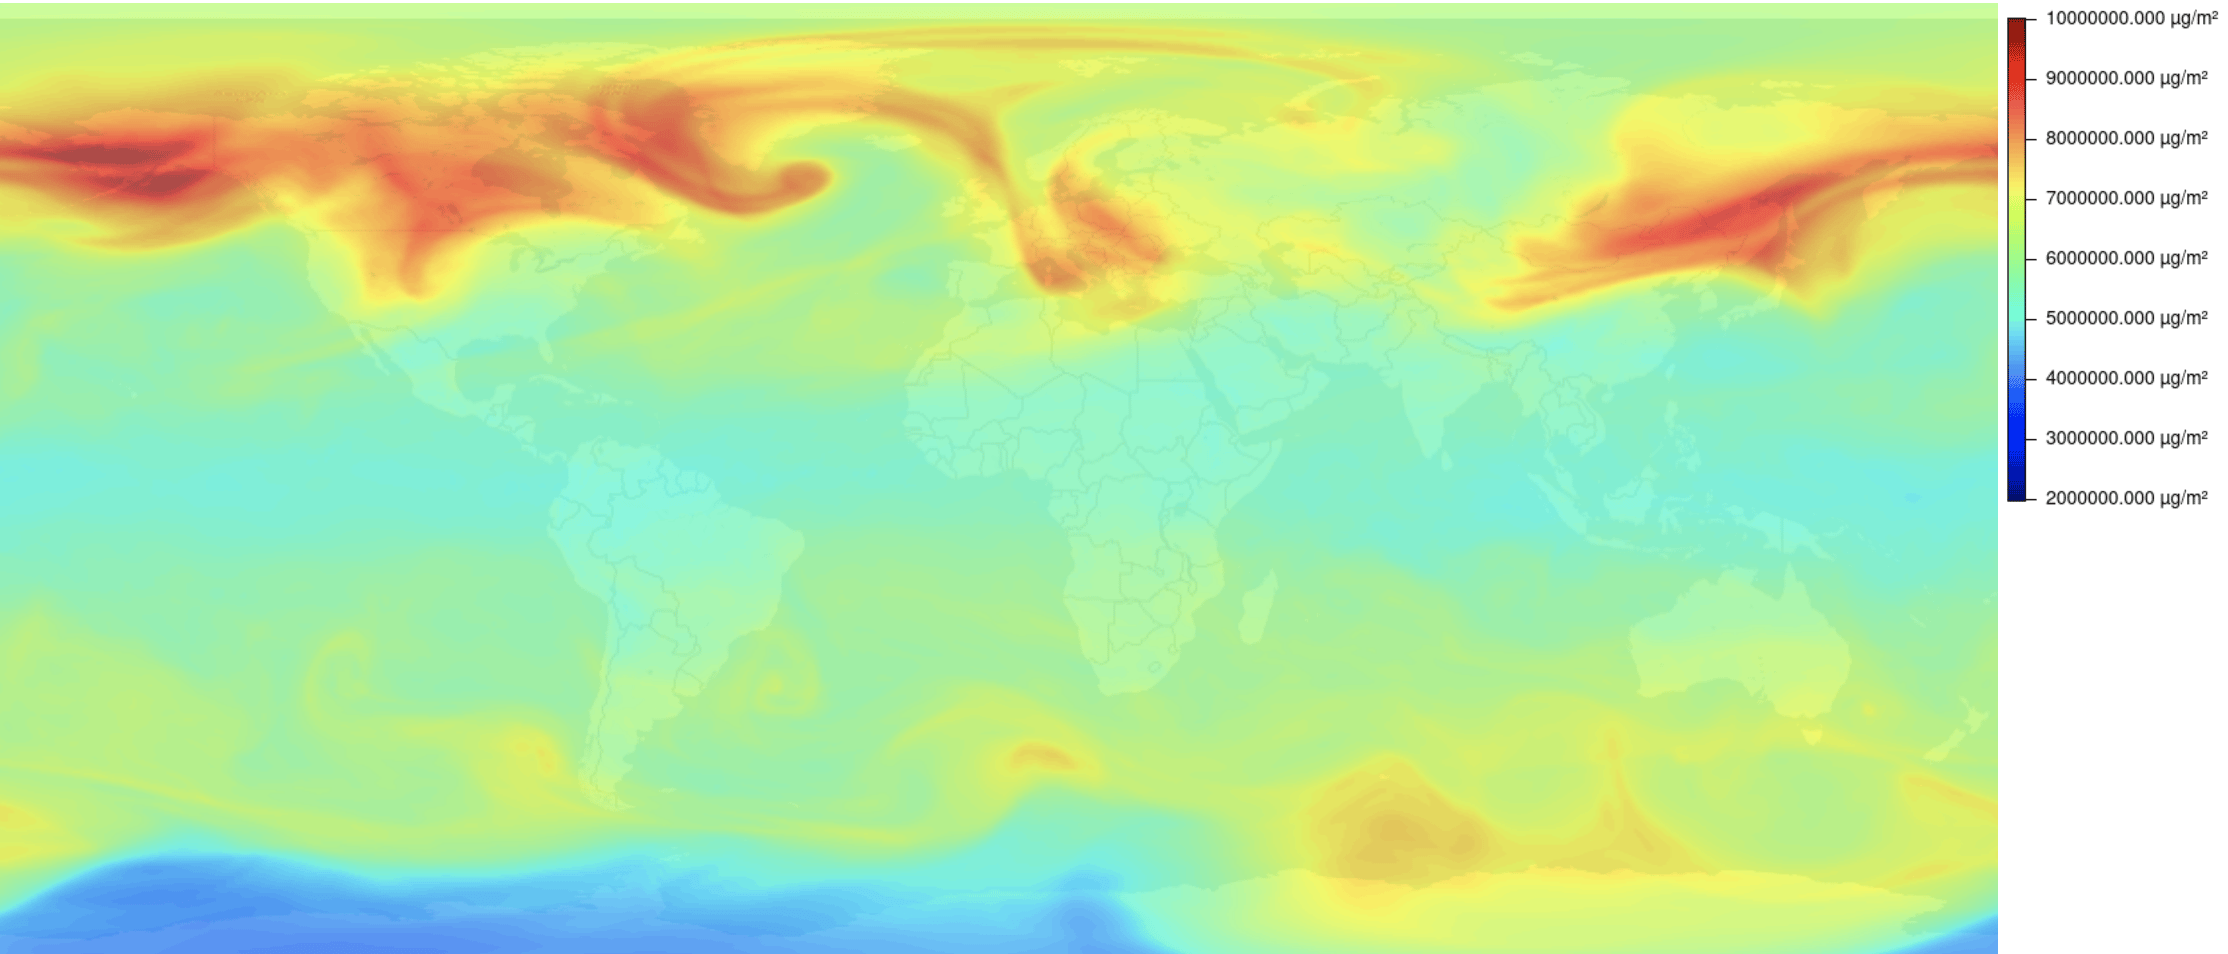
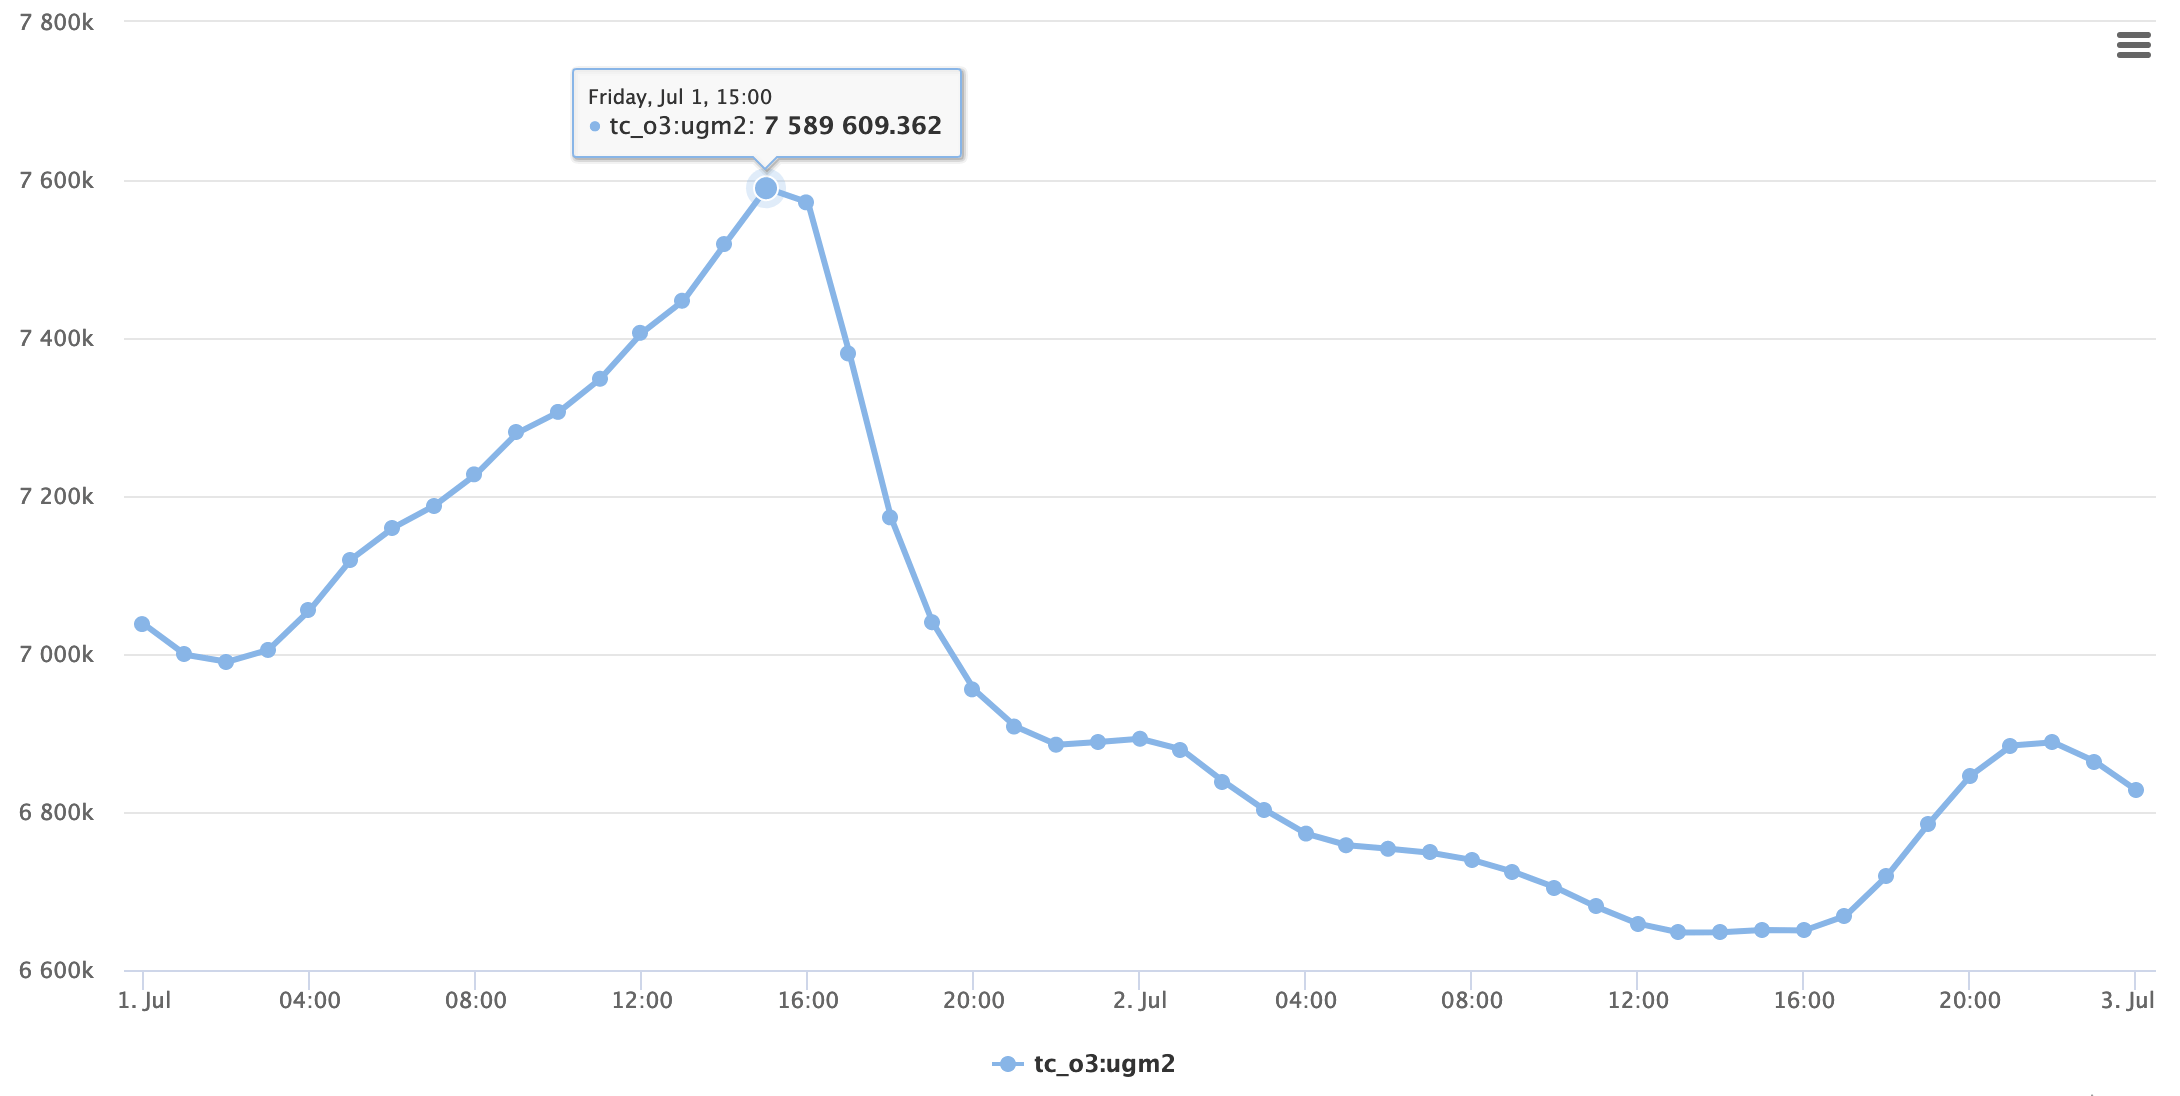
Ozone
Total column content of ozone in units of [μg/m2].
tc_o3:ugm2Examples
-
https://api.meteomatics.com/2025-07-03T00:00:00Z/tc_o3:ugm2/90,-180_-90,180:1000x600/html_map
-
Show the evolution of the total ozone column content for two days.
https://api.meteomatics.com/2025-07-03T00:00:00ZP2D:PT1H/tc_o3:ugm2/47.412164,9.340652/html
-
https://api.meteomatics.com/2025-07-03T00:00:00ZP1D:PT3H/tc_o3:ugm2/47.412164,9.340652/csv
validdate;tc_o3:ugm2
2018-02-05T00:00:00Z;8101143.874
2018-02-05T03:00:00Z;8003459.312
2018-02-05T06:00:00Z;8037665.859
2018-02-05T09:00:00Z;8127233.945
2018-02-05T12:00:00Z;8203518.577
2018-02-05T15:00:00Z;8325079.456
2018-02-05T18:00:00Z;8360913.023
2018-02-05T21:00:00Z;8431591.094
2018-02-06T00:00:00Z;8447664.79


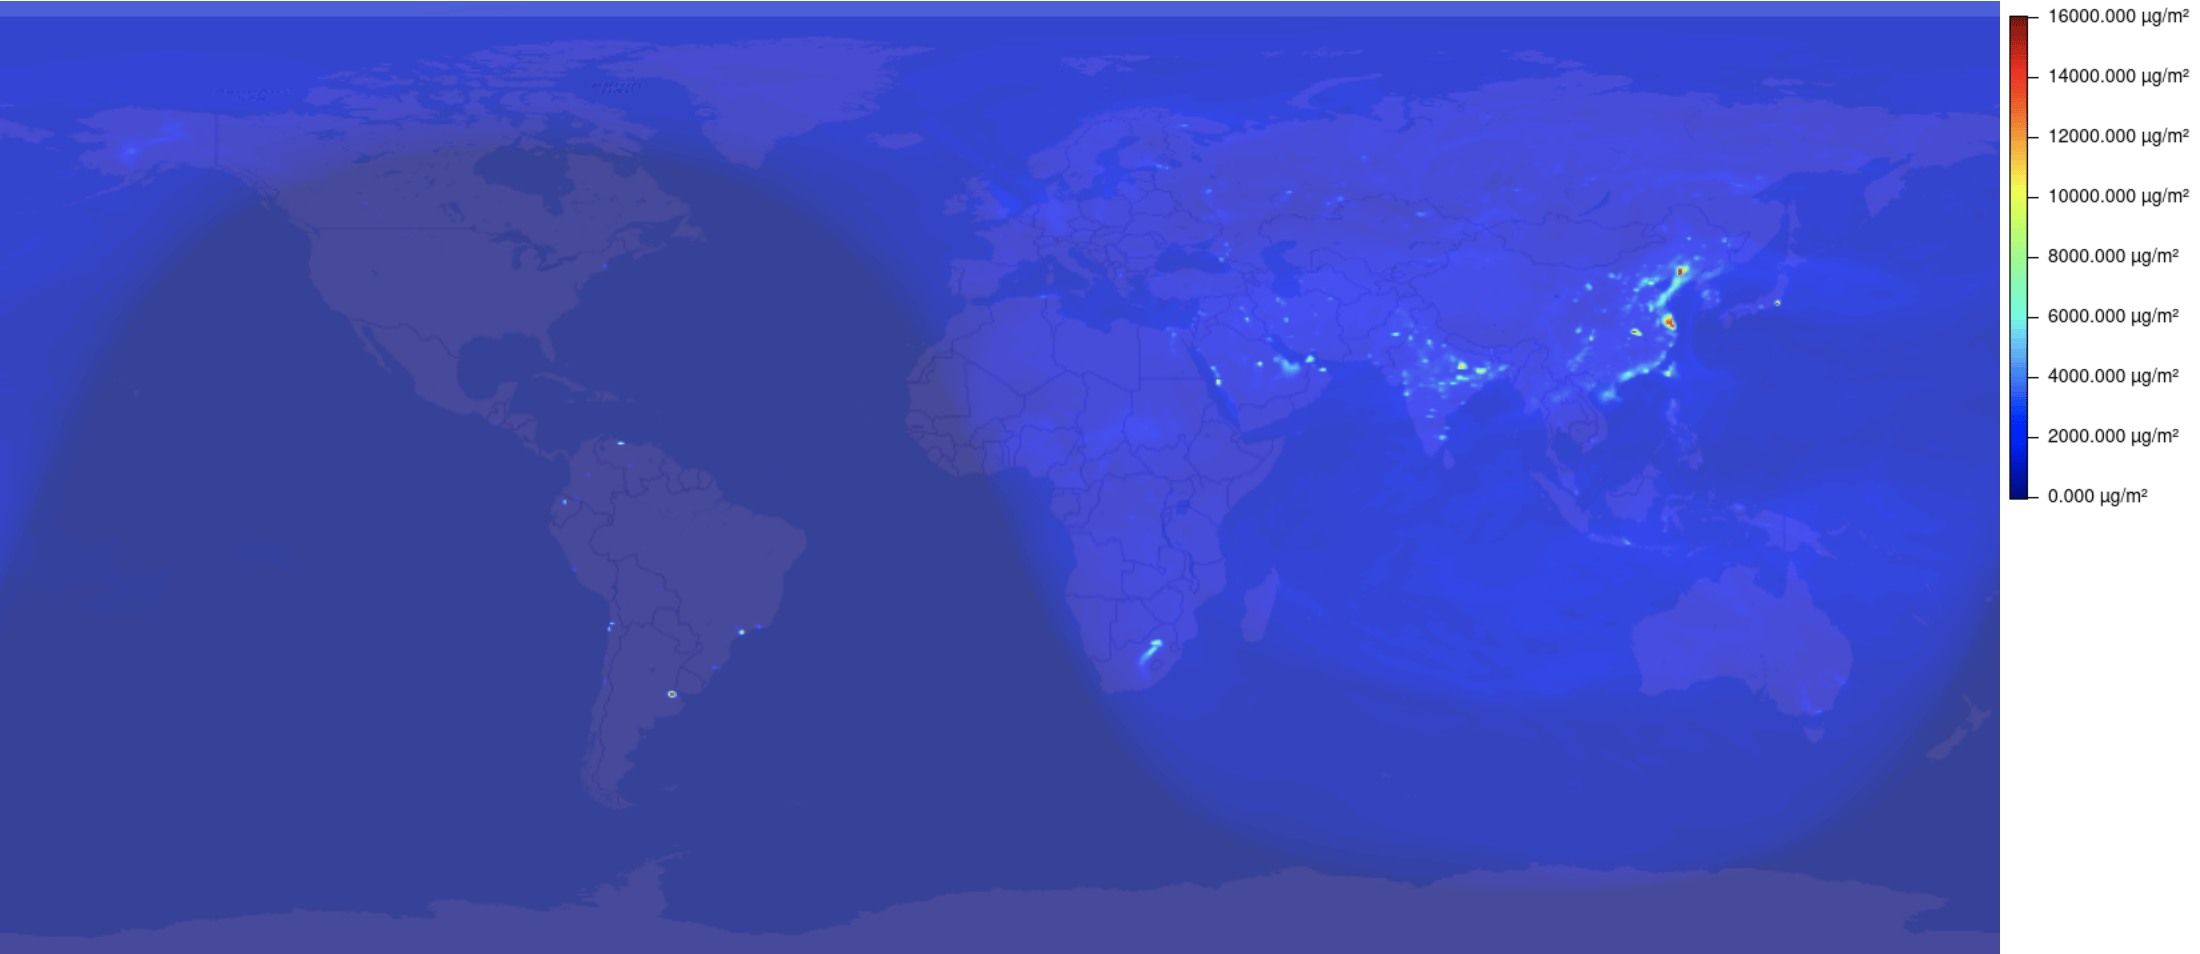
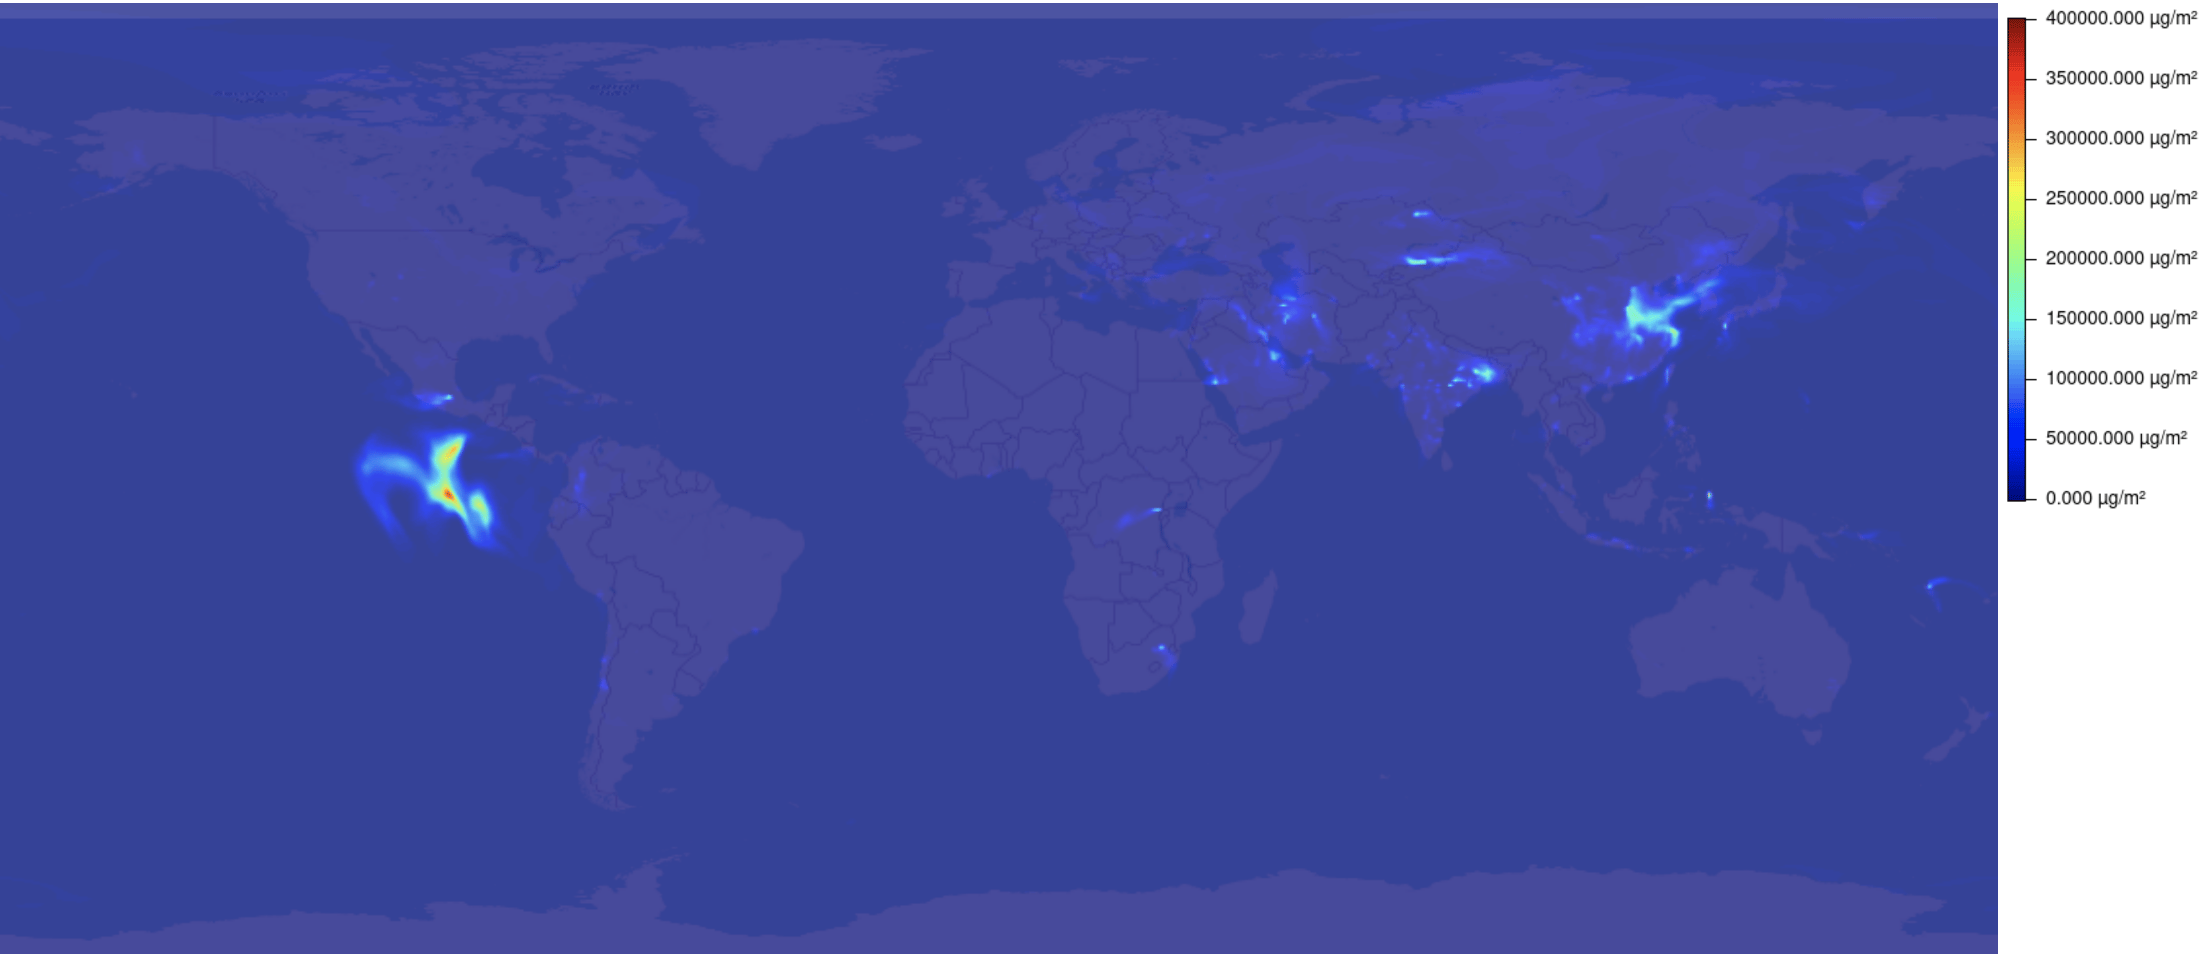
Sulfur Dioxide
Total column content of sulfur dioxide in units of [μg/m2].
tc_so2:ugm2Examples
-
https://api.meteomatics.com/2025-07-03T00:00:00Z/tc_so2:ugm2/90,-180_-90,180:1000x600/html_map
-
Get the total column content of sulfur dioxide for the next day in three hour steps in the json format.
https://api.meteomatics.com/2025-07-03T00:00:00ZP1D:PT3H/tc_so2:ugm2/47.412164,9.340652/json
{"version":"3.0","user":"api-test","dateGenerated":"2017-08-25T09:03:43Z","status":"OK","data":
[{"parameter":"tc_so2:ugm2","coordinates":[{"lat":47.4122,"lon":9.34065,"dates":
[{"date":"2017-08-25T00:00:00Z","value":629.487},{"date":"2017-08-25T03:00:00Z","value":579.359},
{"date":"2017-08-25T06:00:00Z","value":606.636},{"date":"2017-08-25T09:00:00Z","value":687.316},
{"date":"2017-08-25T12:00:00Z","value":708.604},{"date":"2017-08-25T15:00:00Z","value":640.072},
{"date":"2017-08-25T18:00:00Z","value":617.721},{"date":"2017-08-25T21:00:00Z","value":726.931},
{"date":"2017-08-26T00:00:00Z","value":960.146}]}]}]}

Trace Gas Air Quality
Air quality indices for trace gases. The index returns an integer from 0 (Good) to 5 (Extremely Poor).
air_quality_no2:idx
air_quality_o3:idx
air_quality_so2:idx
The index is defined using concentration thresholds from the European Environment Agency. The concentrations are given in [μg/m3].
| Good [0] | Fair [1] | Moderate [2] | Poor [3] | Very Poor [4] | Extremely Poor [5] | |
|---|---|---|---|---|---|---|
| NO2 | 0-40 | 40-90 | 90-120 | 120-230 | 230-340 | 340-1000 |
| O3 | 0-50 | 50-100 | 100-130 | 130-240 | 240-380 | 380-800 |
| SO2 | 0-100 | 100-200 | 200-350 | 350-500 | 500-750 | 750-1250 |
Total Air Quality
The total air quality accounts for the particulate matter and trace gas concentration. It returns the maximum of air_quality_pm2p:idx, air_quality_pm10:idx, air_quality_no2:idx, air_quality_o3:idx and air_quality_so2:idx.
air_quality:idx