General Weather State
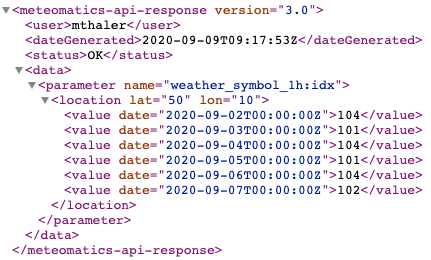
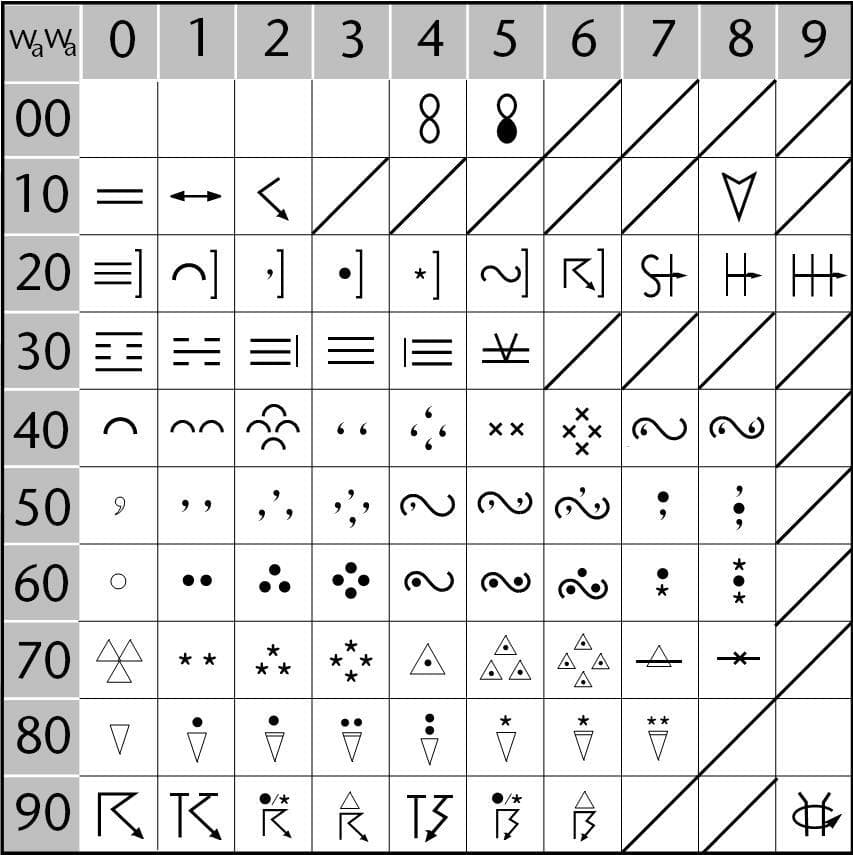
Weather Symbol | Weather Code | Weather Text | Visibility | Runway Visual Range | Dew or Rime | Fog | Icing Potential Aviation | Interval Values of Icing Potential for Aviation | Icing Warnings (Energy) | High Ice Water Content| Slippery Road | Planetary Boundary Layer Height | Tropopause Height| Snow Line | Freezing Level | Stratospheric Polar Vortex | Power Line Oscillation Warning | Soaring Index | Leisure Indices | Laundry Index | Cold Index | Probability for Snow Cover | Windshield Icing | Aerodrome Approach IndexWeather symbol
The weather symbol is the easiest way to query an overview of the weather state.
weather_symbol_<interval>:idxAvailable intervals: 20min, 30min, 1h, 3h, 6h, 12h, 24h
Example:
Show the weather symbols for the next 5 days. A table with the different symbols and their meaning can be viewed below:
https://api.meteomatics.com/2026-07-24T00:00:00Z--2026-07-29T00:00:00Z:PT1H/weather_symbol_1h:idx/50,10/xml

| Symbol Id (Day) | Symbol Id (Night) | Description |
|---|---|---|
0
 | 0
| A weather symbol could not be determined |
1
 | 101
| Clear sky |
2
 | 102
 | Light clouds |
3
 | 103
 | Partly cloudy |
4
 | 104
 | Cloudy |
5
 | 105
 | Rain |
6
 | 106
 | Rain and snow |
7
 | 107
 | Snow |
8
 | 108
 | Rain shower |
9
 | 109
 | Snow shower |
10
 | 110
 | Rain and snow shower |
11
 | 111
 | Light Fog |
12
 | 112
 | Dense Fog |
13
 | 113
 | Freezing rain |
14
 | 114
 | Thunderstorms |
15
 | 115
 | Drizzle |
16
 | 116
 | Sandstorm |
An archive containing all weather symbols above can be found here.
Weather Code
Weather code according to the present weather code 4677 of the international WMO Standard1 (mean for 1h, 3h, 6h, 12h, 24h)
weather_code_<interval>:idxAvailable intervals: 1h, 3h, 6h, 12h, 24h
- Meaning of Code: 00 - 19, 20 - 29, 30 - 39, 40 - 49, 50 - 59, 60 - 69, 70 - 79, 80 - 99
Code Meaning Additional Information 00 - 19 No precipitation, fog, ice fog (except for 11 and 12), duststorm, sandstorm, drifting or blowing snow 00 Cloud development not observed or not observable Characteristic change of the state of sky during the past hour 01 Clouds generally dissolving or becoming less developed Characteristic change of the state of sky during the past hour 02 State of sky on the whole unchanged Characteristic change of the state of sky during the past hour 03 Clouds generally forming or developing Characteristic change of the state of sky during the past hour 04 Visibility reduced by smoke, e.g. veldt or forest fires, industrial smoke or volcanic ashes 05 Haze 06 Widespread dust in suspension in the air, not raised by wind at or near the station at the time of observation 07 Dust or sand raised by wind at or near the station at the time of observation, but no well developed dust whirl(s) or sand whirl(s), and no duststorm or sandstorm seen 08 Well developed dust whirl(s) or sand whirl(s) seen at or near the station during the preceding hour or at the time ot observation, but no duststorm or sandstorm 09 Duststorm or sandstorm within sight at the time of observation, or at the station during the preceding hour 10 Mist 11 Patches Shallow fog or ice fog at the station, whether on land or sea, not deeper than about 2 metres on land or 10 metres at sea 12 More or less continuous Shallow fog or ice fog at the station, whether on land or sea, not deeper than about 2 metres on land or 10 metres at sea 13 Lightning visible, no thunder heard 14 Precipitation within sight, not reaching the ground or the surface of the sea 15 Precipitation within sight, reaching the ground or the surface of the sea, but distant, i.e. estimated to be more than 5 km from the station 16 Precipitation within sight, reaching the ground or the surface of the sea, near to, but not at the station 17 Thunderstorm, but no precipitation at the time of observation 18 Squalls At or within sight of the station during the preceding hour or at the time of observation 19 Funnel cloud(s) At or within sight of the station during the preceding hour or at the time of observation 20 - 29 Precipitation, fog, ice fog or thunderstorm at the station during the preceding hour 20 Drizzle (not freezing) or snow grains Not falling as shower(s) 21 Rain (not freezing) Not falling as shower(s) 22 Snow Not falling as shower(s) 23 Rain and snow or ice pellets Not falling as shower(s) 24 Freezing drizzle or freezing rain Not falling as shower(s) 25 Shower(s) of rain 26 Shower(s) of snow, or of rain and snow 27 Shower(s) of hail, or of rain and hail 28 Fog or ice fog 29 Thunderstorm (with or without precipitation) 30 - 39 Duststorm, sandstorm, drifting or blowing snow 30 Slight or moderate duststorm or sandstorm Has decreased during the preceding hour 31 Slight or moderate duststorm or sandstorm No appreciable change during the preceding hour 32 Slight or moderate duststorm or sandstorm Has begun or has increased during the preceding hour 33 Severe duststorm or sandstorm Has decreased during the preceding hour 34 Severe duststorm or sandstorm No appreciable change during the preceding hour 35 Severe duststorm or sandstorm Has begun or has increased during the preceding hour 36 Slight or moderate blowing snow Generally low (below eye level) 37 Heavy drifting snow Generally low (below eye level) 38 Slight or moderate blowing snow Generally high (above eye level) 39 Heavy drifting snow Generally high (above eye level) 40 - 49 Fog or ice fog at the time of observation 40 Fog or ice fog at a distance at the time of observation, but not at the station during the preceding hour, the fog or ice fog extending to a level above that of the observer 41 Fog or ice fog in patches 42 Fog or ice fog, sky visible Has become thinner during the preceding hour 43 Fog or ice fog, sky invisible Has become thinner during the preceding hour 44 Fog or ice fog, sky visible No appreciable change during the preceding hour 45 Fog or ice fog, sky invisible No appreciable change during the preceding hour 46 Fog or ice fog, sky visible Has begun or has become thicker during the preceding hour 47 Fog or ice fog, sky invisible Has begun or has become thicker during the preceding hour 48 Fog, depositing rime, sky visible 49 Fog, depositing rime, sky invisible 50 - 59 Drizzle at the station at the time of observation 50 Drizzle, not freezing, intermittent Slight at time of observation 51 Drizzle, not freezing, continuous Slight at time of observation 52 Drizzle, not freezing, intermittent Moderate at time of observation 53 Drizzle, not freezing, continuous Moderate at time of observation 54 Drizzle, not freezing, intermittent Heavy (dense) at time of observation 55 Drizzle, not freezing, continuous Heavy (dense) at time of observation 56 Drizzle, freezing, slight 57 Drizzle, freezing, moderate or heavy (dence) 58 Drizzle and rain, slight 59 Drizzle and rain, moderate or heavy 60 - 69 Rain at the station at the time of observation 60 Rain, not freezing, intermittent Slight at time of observation 61 Rain, not freezing, continuous Slight at time of observation 62 Rain, not freezing, intermittent Moderate at time of observation 63 Rain, not freezing, continuous Moderate at time of observation 64 Rain, not freezing, intermittent Heavy at time of observation 65 Rain, not freezing, continuous Heavy at time of observation 66 Rain, freezing, slight 67 Rain, freezing, moderate or heavy (dence) 68 Rain or drizzle and snow, slight 69 Rain or drizzle and snow, moderate or heavy 70 - 79 Solid precipitation not in showers at the station at the time of observation 70 Intermittent fall of snowflakes Slight at time of observation 71 Continuous fall of snowflakes Slight at time of observation 72 Intermittent fall of snowflakes Moderate at time of observation 73 Continuous fall of snowflakes Moderate at time of observation 74 Intermittent fall of snowflakes Heavy at time of observation 75 Continuous fall of snowflakes Heavy at time of observation 76 Diamond dust (with or without fog) 77 Snow grains (with or without fog) 78 Isolated star-like snow crystals (with or without fog) 79 Ice pellets 80 - 99 Showery precipitation, or precipitation with current or recent thunderstorm at the station at the time of observation 80 Rain shower(s), slight 81 Rain shower(s), moderate or heavy 82 Rain shower(s), violent 83 Shower(s) of rain and snow mixed, slight 84 Shower(s) of rain and snow mixed, moderate or heavy 85 Snow shower(s), slight 86 Snow shower(s), moderate or heavy 87 Shower(s) of snow pellets or small hail, with or without rain or rain and snow mixed Slight 88 Shower(s) of snow pellets or small hail, with or without rain or rain and snow mixed Moderate or heavy 89 Shower(s) of hail, with or without rain or rain and snow mixed, not associated with thunder Slight 90 Shower(s) of hail, with or without rain or rain and snow mixed, not associated with thunder Moderate or heavy 91 Slight rain at time of observation Thunderstorm during the preceding hour but not at time of observation 92 Moderate or heavy rain at time of observation Thunderstorm during the preceding hour but not at time of observation 93 Slight snow, or rain and snow mixed or hail at time of observation Thunderstorm during the preceding hour but not at time of observation 94 Moderate or heavy snow, or rain and snow mixed or hail at time of observation Thunderstorm during the preceding hour but not at time of observation 95 Thunderstorm, slight or moderate, without hail but with rain and/or snow at time of observation Thunderstorm at time of observation 96 Thunderstorm, slight or moderate, with hail at time of observation Thunderstorm at time of observation 97 Thunderstorm, heavy, without hail but with rain and/or snow at time of observation Thunderstorm at time of observation 98 Thunderstorm combined with duststorm or sandstorm at time of observation Thunderstorm at time of observation 99 Thunderstorm, heavy, with hail at time of observation Thunderstorm at time of observation - Corresponding symbols to weather codes:

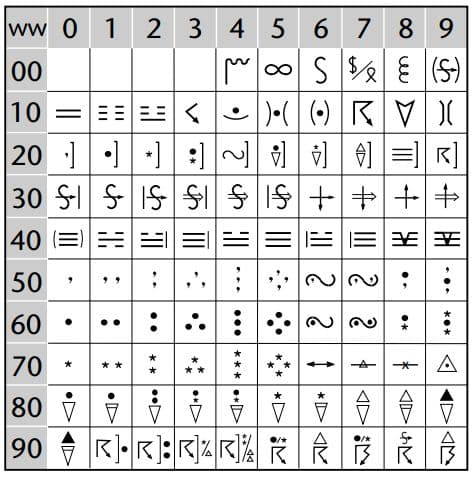
Weather codes from 100 - 199 correspond to the weather codes 00 - 99 of the code 4680 of the international WMO Standard for present weather reported from an automatic weather station (mean for 1h, 3h, 6h, 12h, 24h).
Meaning of Code: 100 - 119, 120 - 129, 130 - 139, 140 - 149, 150 - 159, 160 - 169, 170 - 179, 180 - 189, 190 - 199
Code Meaning Additional Information 100 - 119 No precipitation, clouds, haze, smoke, dust, mist 100 No significant weather observed 101 Clouds generally dissolving or becoming less developed Characteristic change of the state of sky during the past hour 102 State of sky on the whole unchanged Characteristic change of the state of sky during the past hour 103 Clouds generally forming or developing Characteristic change of the state of sky during the past hour 104 Haze or smoke, or dust in suspension in the air, visibility >= 1 km 105 Haze or smoke, or dust in suspension in the air, visibility < 1 km 106 - 109 Reserved 110 Mist 111 Diamond dust 112 Distant lightning 113 - 117 Reserved 118 Squalls 119 Reserved 120 - 129 Precipitation, fog or thunderstorm at the station during the preceding hour 120 Fog Reported at the station during the preceding hour but not at the time of observation 121 PRECIPITATION Reported at the station during the preceding hour but not at the time of observation 122 Drizzle (not freezing) or snow grains Reported at the station during the preceding hour but not at the time of observation 123 Rain (not freezing) Reported at the station during the preceding hour but not at the time of observation 124 Snow Reported at the station during the preceding hour but not at the time of observation 125 Freezing drizzle or freezing rain Reported at the station during the preceding hour but not at the time of observation 126 Thunderstorm (with or without precipitation) Reported at the station during the preceding hour but not at the time of observation 127 BLOWING OR DRIFTING SNOW OR SAND 128 Blowing or drifting snow or sand, visibility >= 1 km 129 Blowing or drifting snow or sand, visibility < 1 km 130 - 139 Fog or ice fog 130 FOG 131 Fog or ice fog In patches 132 Fog or ice fog Has become thinner during the past hour 133 Fog or ice fog No appreciable change during the past hour 134 Fog or ice fog Has begun or become thicker during the past hour 135 Fog, depositing rime 136 - 139 Reserved 140 - 149 Precipitation 140 PRECIPITATION 141 Precipitation Slight or moderate 142 Precipitation Heavy 143 Liquid precipitation Slight or moderate 144 Liquid precipitation Heavy 145 Solid precipitation Slight or moderate 146 Solid precipitation Heavy 147 Freezing precipitation Slight or moderate 148 Freezing precipitation Heavy 149 Reserved 150 - 159 Drizzle at the station at the time of observation 150 DRIZZLE 151 Drizzle, not freezing Slight 152 Drizzle, not freezing Moderate 153 Drizzle, not freezing Heavy 154 Drizzle, freezing Slight 155 Drizzle, freezing Moderate 156 Drizzle, freezing Heavy 157 Drizzle and rain Slight 158 Drizzle and rain Moderate or heavy 159 Reserved 160 - 169 Rain at the station at the time of observation 160 RAIN 161 Rain, not freezing Slight 162 Rain, not freezing Moderate 163 Rain, not freezing Heavy 164 Rain, freezing Slight 165 Rain, freezing Moderate 166 Rain, freezing Heavy 167 Rain (or drizzle) and snow Slight 168 Rain (or drizzle) and snow Heavy 169 Reserved 170 - 179 Solid precipitation not in showers at the station at the time of observation 170 SNOW 171 Snow Slight 172 Snow Moderate 173 Snow Heavy 174 Ice pellets Slight 175 Ice pellets Moderate 176 Ice pellets Heavy 177 Snow grains 178 Ice crystals 179 Reserved 180 - 189 Shower(s) or intermittent precipitation at the station at the time of observation 180 SHOWER(S) OR INTERMITTENT PRECIPITATION 181 Rain shower(s) or intermittent rain Slight 182 Rain shower(s) or intermittent rain Moderate 183 Rain shower(s) or intermittent rain Heavy 184 Rain shower(s) or intermittent rain Violent 185 Snow shower(s) or intermittent snow Slight 186 Snow shower(s) or intermittent snow Moderate 187 Snow shower(s) or intermittent snow Heavy 188 Reserved 189 Hail 190 - 199 Current or recent thunderstorm at the station at the time of observation 190 THUNDERSTORM 191 Thunderstorm, slight or moderate With no precipitation 192 Thunderstorm, slight or moderate With rain showers and/or snow showers 193 Thunderstorm, slight or moderate With hail 194 Thunderstorm, heavy With no precipitation 195 Thunderstorm, heavy With rain showers and/or snow showers 196 Thunderstorm, heavy With hail 197 - 198 Reserved 199 Tornado Generic terms for weather (e.g. fog, drizzle) are intended for stations capable of determining types of weather but no other information. These generic terms are included in the table with capital letters.
- Corresponding symbols to weather codes (codes 00 - 99 in this table correspond to codes 100 - 199):

Examples:
-
Query the weather codes for Europe today (could take some seconds to load):
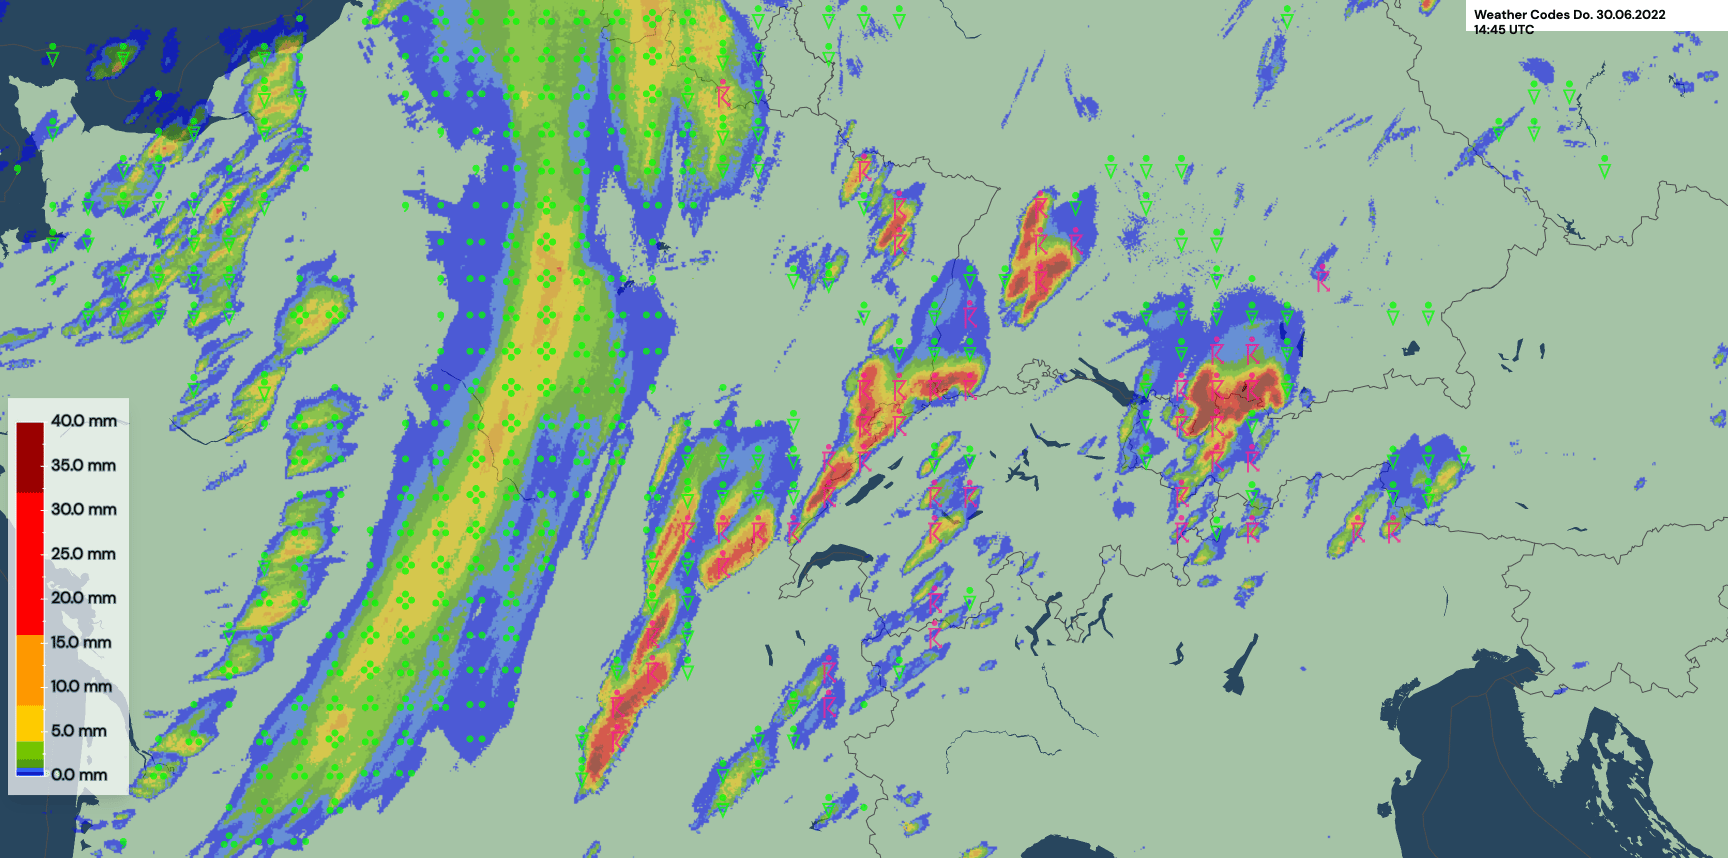
https://api.meteomatics.com/2026-07-24T00:00:00Z/weather_code_1h:idx/europe:0.05,0.05/html - Example for visualized weather codes on a precipitation chart for June 30th, 2022:

Weather Text
This parameter provides an automated text snipped describing the general weather state of the queried day. It is currently available in English, German, French and Italian.
The weather text always refers to a specific day. Therefore, only the date specification is relevant in the query, the time can be set to 00 UTC.
weather_text_de:str
weather_text_en:str
weather_text_fr:str
weather_text_it:str
Weather texts are currently available for a single coordinate and a single parameter in the same request and available in the CSV format only.
Example
- Show the weather text for today:
https://api.meteomatics.com/2026-07-24T00:00:00Z/weather_text_en:str/50,10/csv
validdate;weather_text_en:str
2019-04-08T00:00:00Z;Today after sunrise the sky will be overcast.
In the afternoon it will be mostly sunny. About 4 hours of sunshine are predicted.
It stays very balmy with temperatures between 9°C and 16°C.
After daybreak there is a slight northeasterly wind which shifts afterwards to a slight southerly wind.
In the late evening the sky is partly cloudy, in the second half of the night dense mist may appear.
Visibility
This parameter returns the visibility in kilometers. Fog conditions occur if the visibility is less than 1km.
visibility:<unit>Available units: m, km, ft, mi, nmi
Examples:
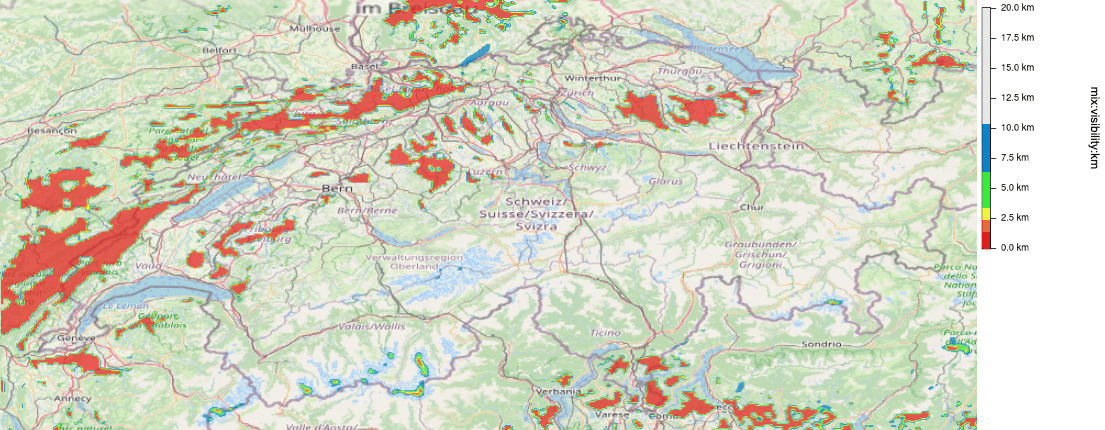
- Show the visibility for Switzerland:
https://api.meteomatics.com/2026-07-24T00:00:00Z/visibility:km/Switzerland:0.005,0.005/html_map
- To obtain the data in a different output format, just replace the format parameter in the URL with one of the following:
csv, json, xml, png, html, netcdf.
Here is an example for the xml format:


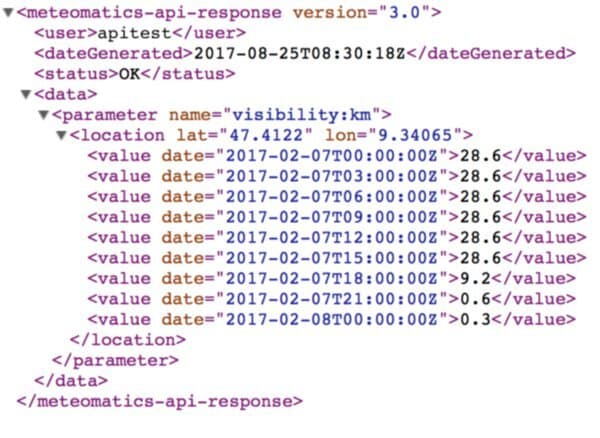
Runway Visual Range
This parameter returns the distance over which a pilot is able to see the runway surface markings at the runway margin. This parameter is used for assessing the conditions for landing and takeoff.
runway_visual_range:m
runway_visual_range:ft
Examples:
-
The evolution of the runway visual range from 2018/12/10 to 2018/12/20:

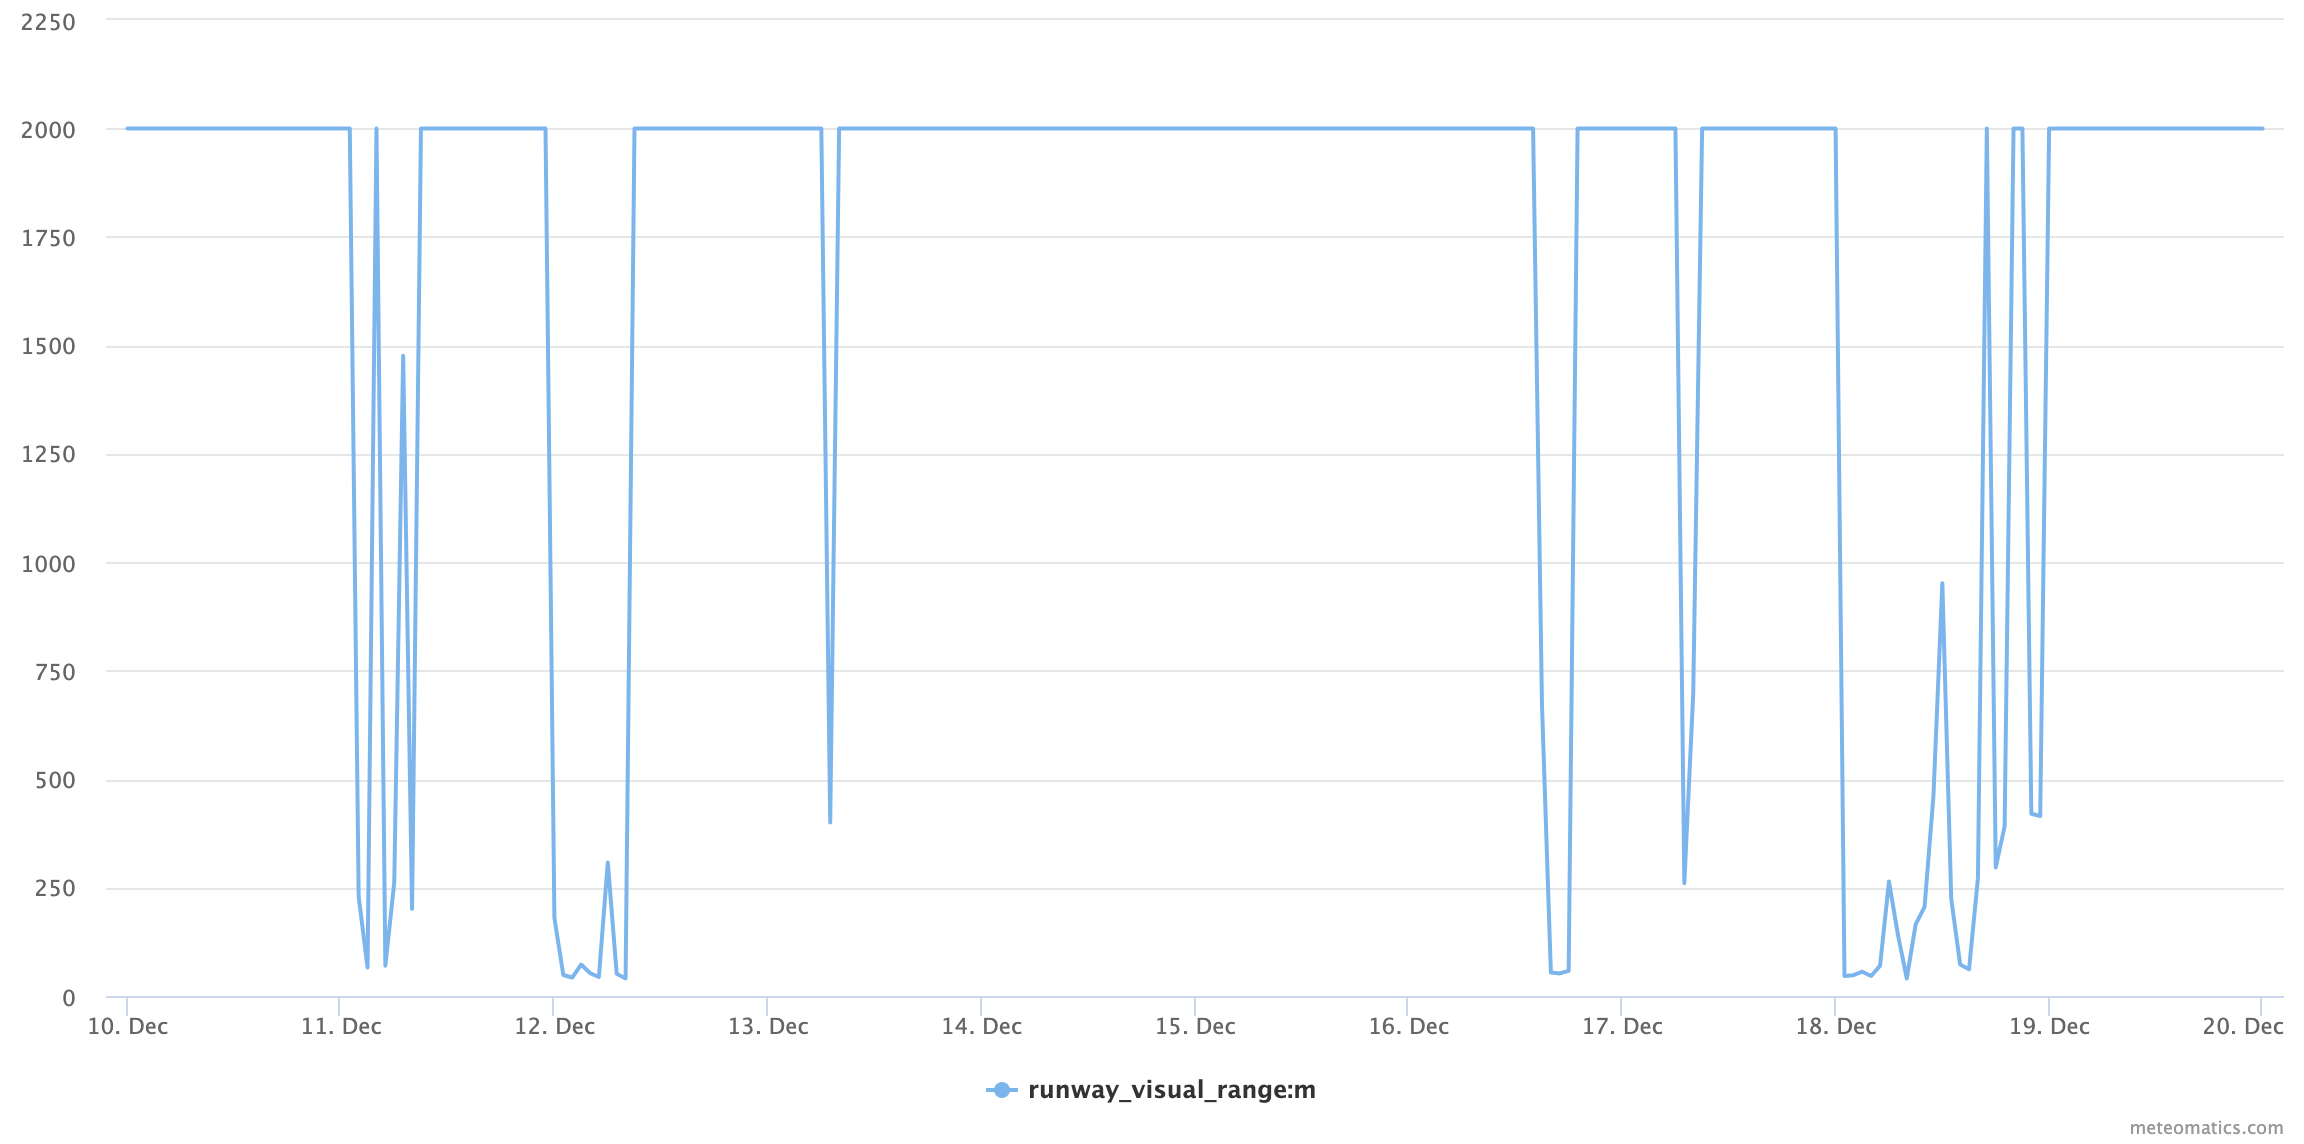
Current situation:
https://api.meteomatics.com/2026-07-24T00:00:00Z--2026-07-27T00:00:00Z:PT1H/runway_visual_range:m/47.467205,8.541801/html?source=mix
Dew or Rime
This index gives you an idea whether dew or rime will occur. Dew or rime forms if the surface cools down quicker than the surrounding air, which causes condensation onto the surface at high relative humidities. Dew and rime are very sensitive to solar radiation and disappear quickly as the surface warms. Rime is the frozen version of dew.
0: neither dew nor rime, 1: dew, -1: rime
dew_or_rime:idxExamples:
-
Temperature and dew or rime evolution from 2020/01/10 to 2020/01/15:
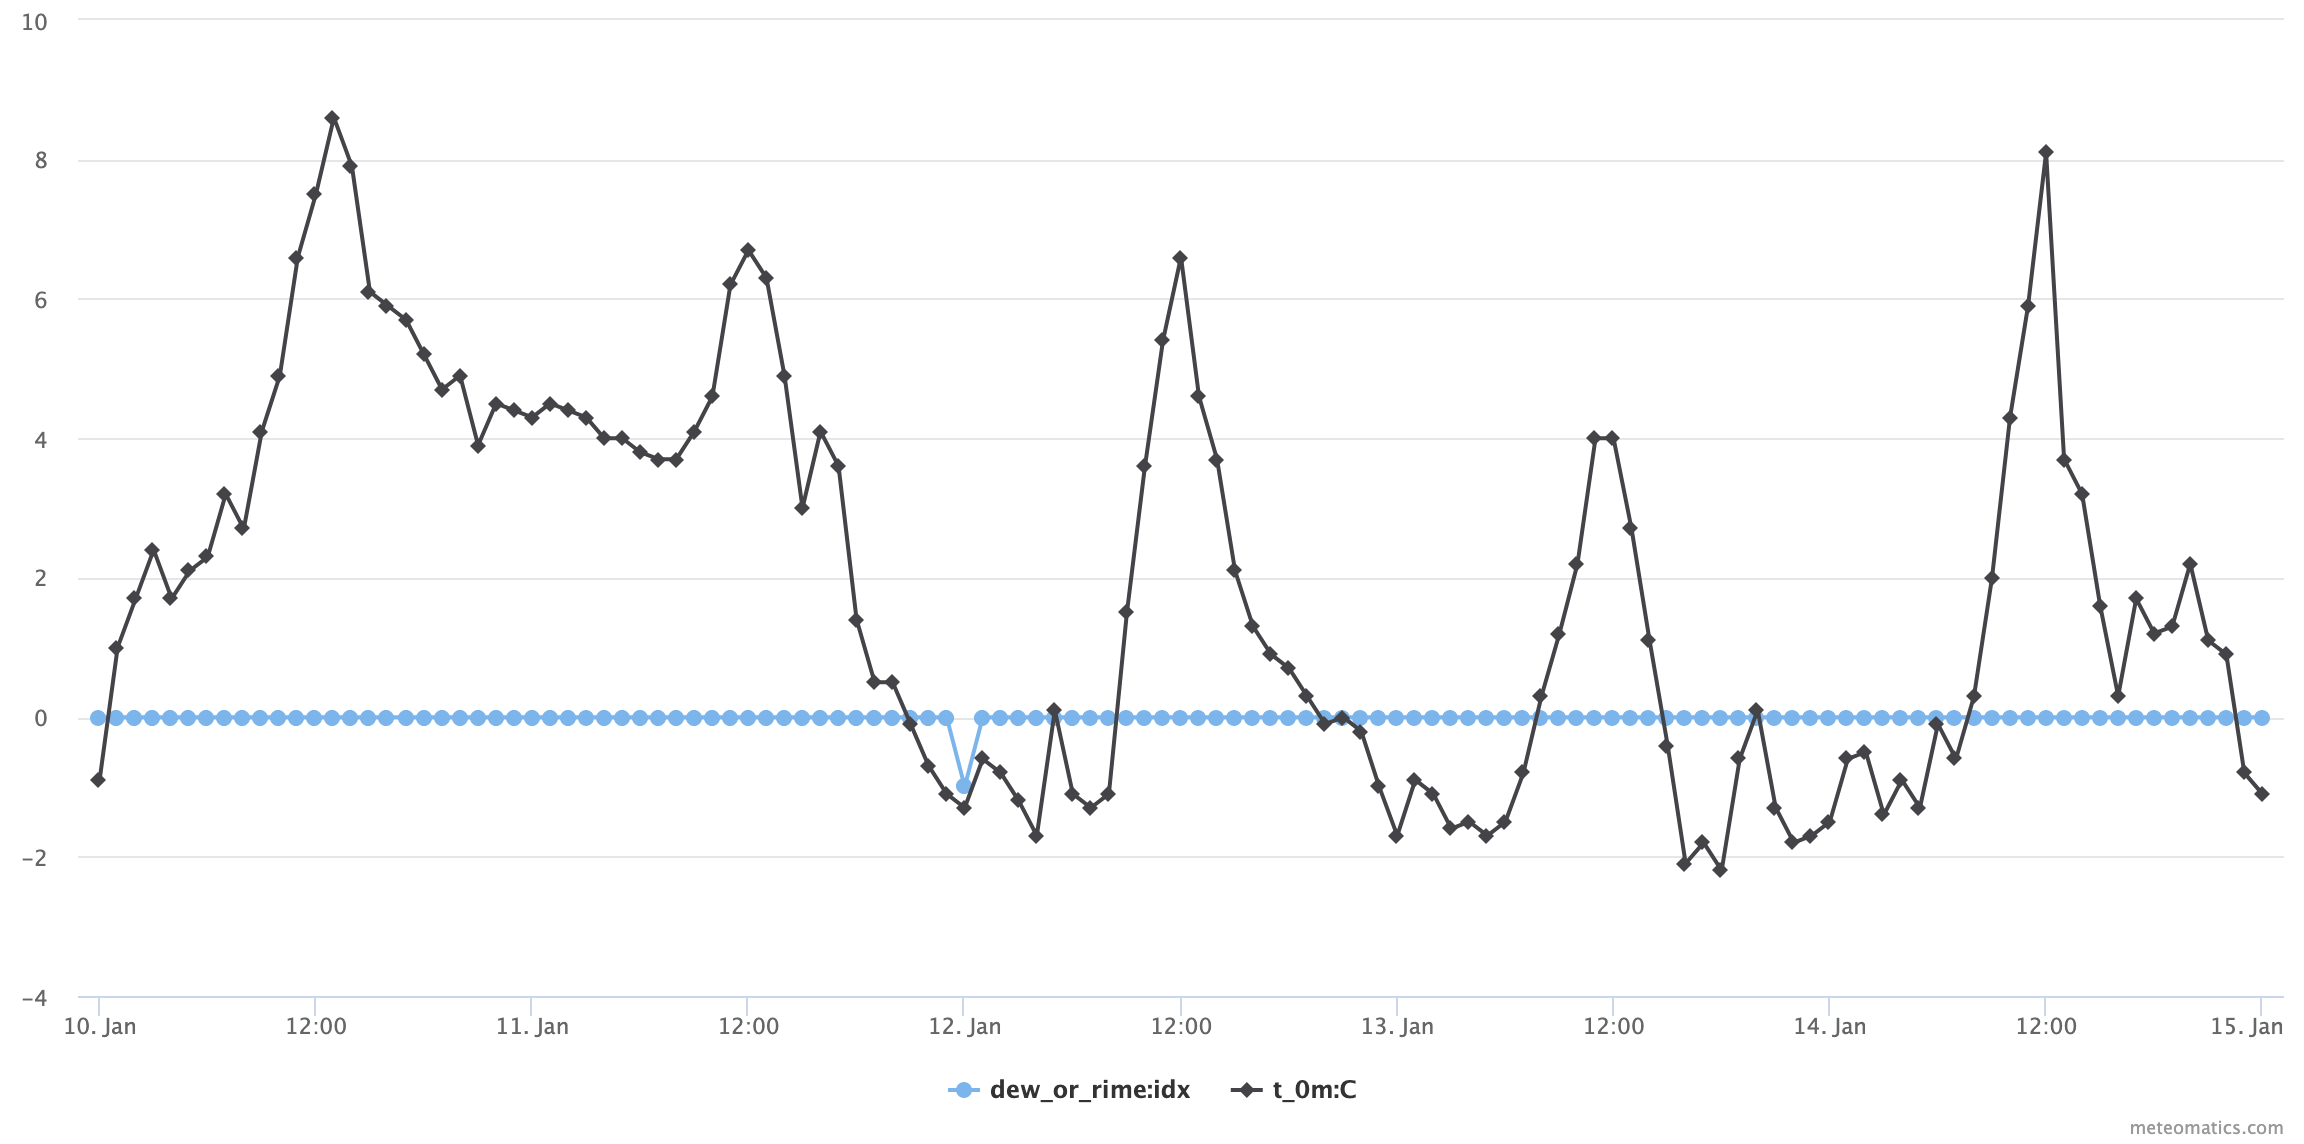
Current situation:
https://api.meteomatics.com/2026-07-24T00:00:00Z--2026-07-29T00:00:00Z:PT1H/dew_or_rime:idx,t_0m:C/47.412164,9.340652/html
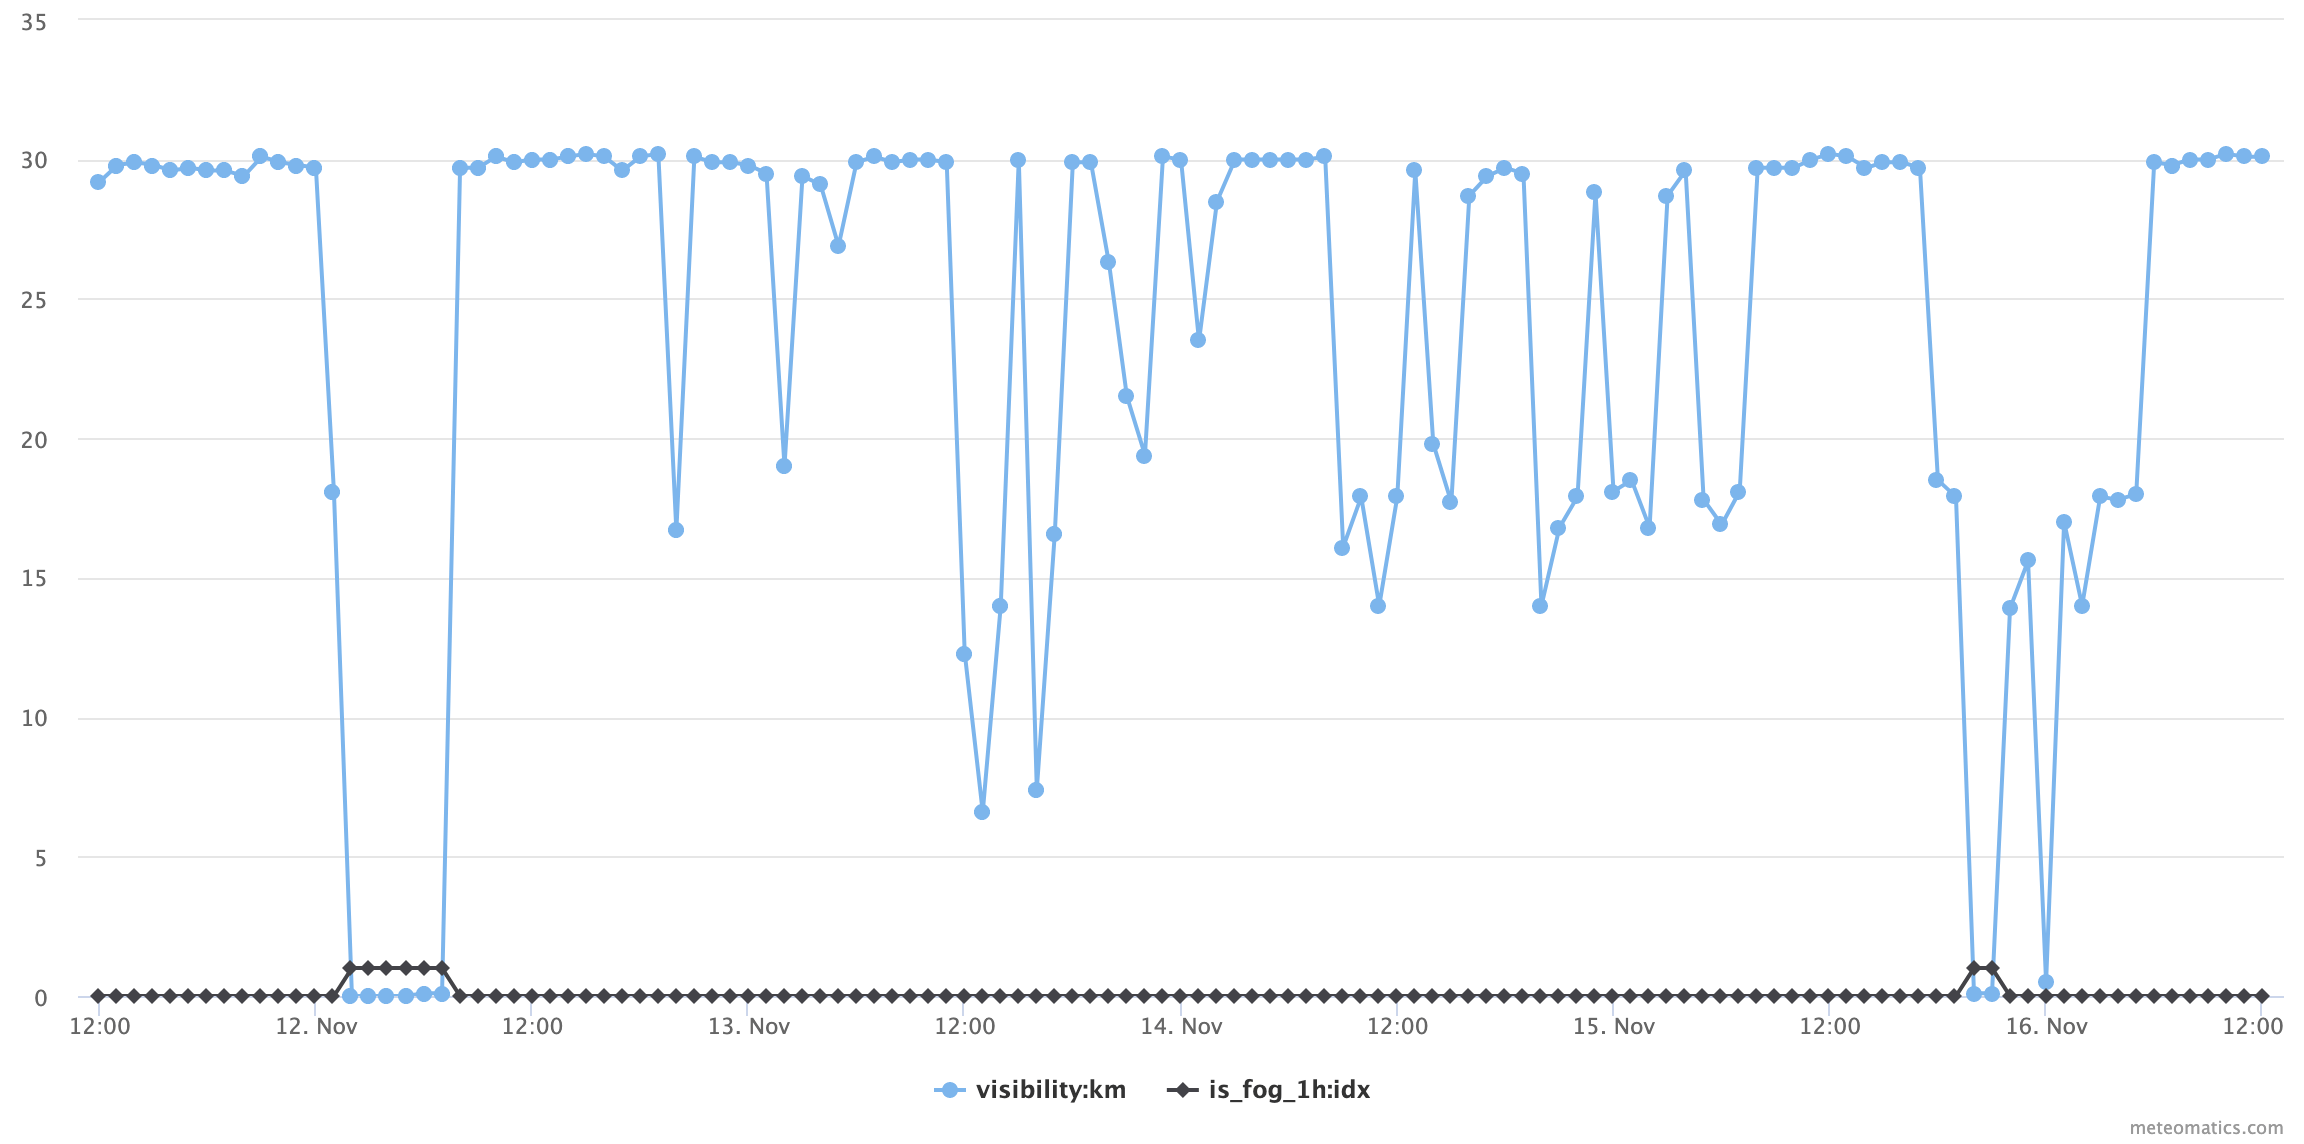
Fog
Check if there was any fog within the last hour or 30 minutes.
0: no fog, 1: fog event
is_fog_<interval>:idxAvailable intervals: 30min, 1h
Examples:
-
Show if there is any fog expected during the next four days. The visibility is also shown as the two parameters contain similar information:
https://api.meteomatics.com/2026-07-24T00:00:00Z--2026-07-29T00:00:00Z:PT1H/visibility:km,is_fog_1h:idx/47.412164,9.340652/html -
Another example as a json output for fog expectation during the next six hours:
https://api.meteomatics.com/2026-07-24T00:00:00ZPT6H:PT1H/visibility:km,is_fog_1h:idx/47.412164,9.340652/json{"version":"3.0","user":"api-test","dateGenerated":"2018-02-07T16:10:49Z","status":"OK","data": [{"parameter":"visibility:km","coordinates":[{"lat":47.4122,"lon":9.34065,"dates": [{"date":"2017-02-07T00:00:00Z","value":20},{"date":"2017-02-07T01:00:00Z","value":20}, {"date":"2017-02-07T02:00:00Z","value":20},{"date":"2017-02-07T03:00:00Z","value":20}, {"date":"2017-02-07T04:00:00Z","value":20},{"date":"2017-02-07T05:00:00Z","value":20}, {"date":"2017-02-07T06:00:00Z","value":20}]}]}, {"parameter":"is_fog_1h:idx","coordinates":[{"lat":47.4122,"lon":9.34065,"dates": [{"date":"2017-02-07T00:00:00Z","value":0},{"date":"2017-02-07T01:00:00Z","value":0}, {"date":"2017-02-07T02:00:00Z","value":0},{"date":"2017-02-07T03:00:00Z","value":0}, {"date":"2017-02-07T04:00:00Z","value":0},{"date":"2017-02-07T05:00:00Z","value":0}, {"date":"2017-02-07T06:00:00Z","value":0}]}]}]}
Icing Potential Aviation
Icing is absolutely critical in aviation and in-flight icing on planes are the cause of multiple near-accidents or even crashes. Consequently, it is crucial for aviation to have reliable icing forecasts predicting the expected occurrence of icing on different altitudes and allowing for early circumnavigation.
icing_potential_<level>:idxAvailable pressure levels: 1000hPa, 975hPa, 950hPa, 925hPa, 900hPa, 875hPa, 850hPa, 825hPa, 800hPa, 775hPa, 750hPa, 700hPa, 650hPa, 600hPa, 550hPa, 500hPa, 450hPa, 400hPa, 350hPa, 300hPa
Available flight levels: FL10 - FL605 (continuously)
Available meter levels: 2-20000m (continuously)
| Index | Description |
| 0.0-0.2 | No Icing |
| 0.2-0.4 | Traces |
| 0.4-0.6 | Light |
| 0.6-0.8 | Moderate |
| 0.8-1.0 | Heavy |
Examples:
-
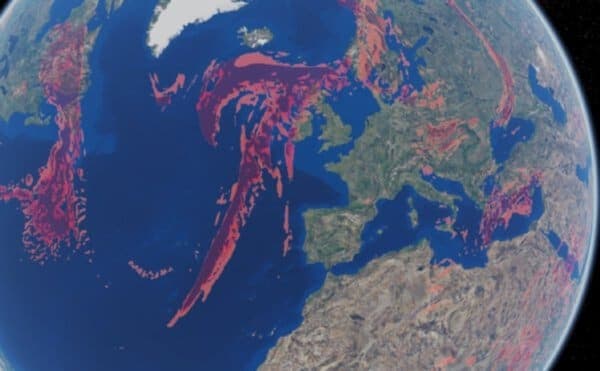
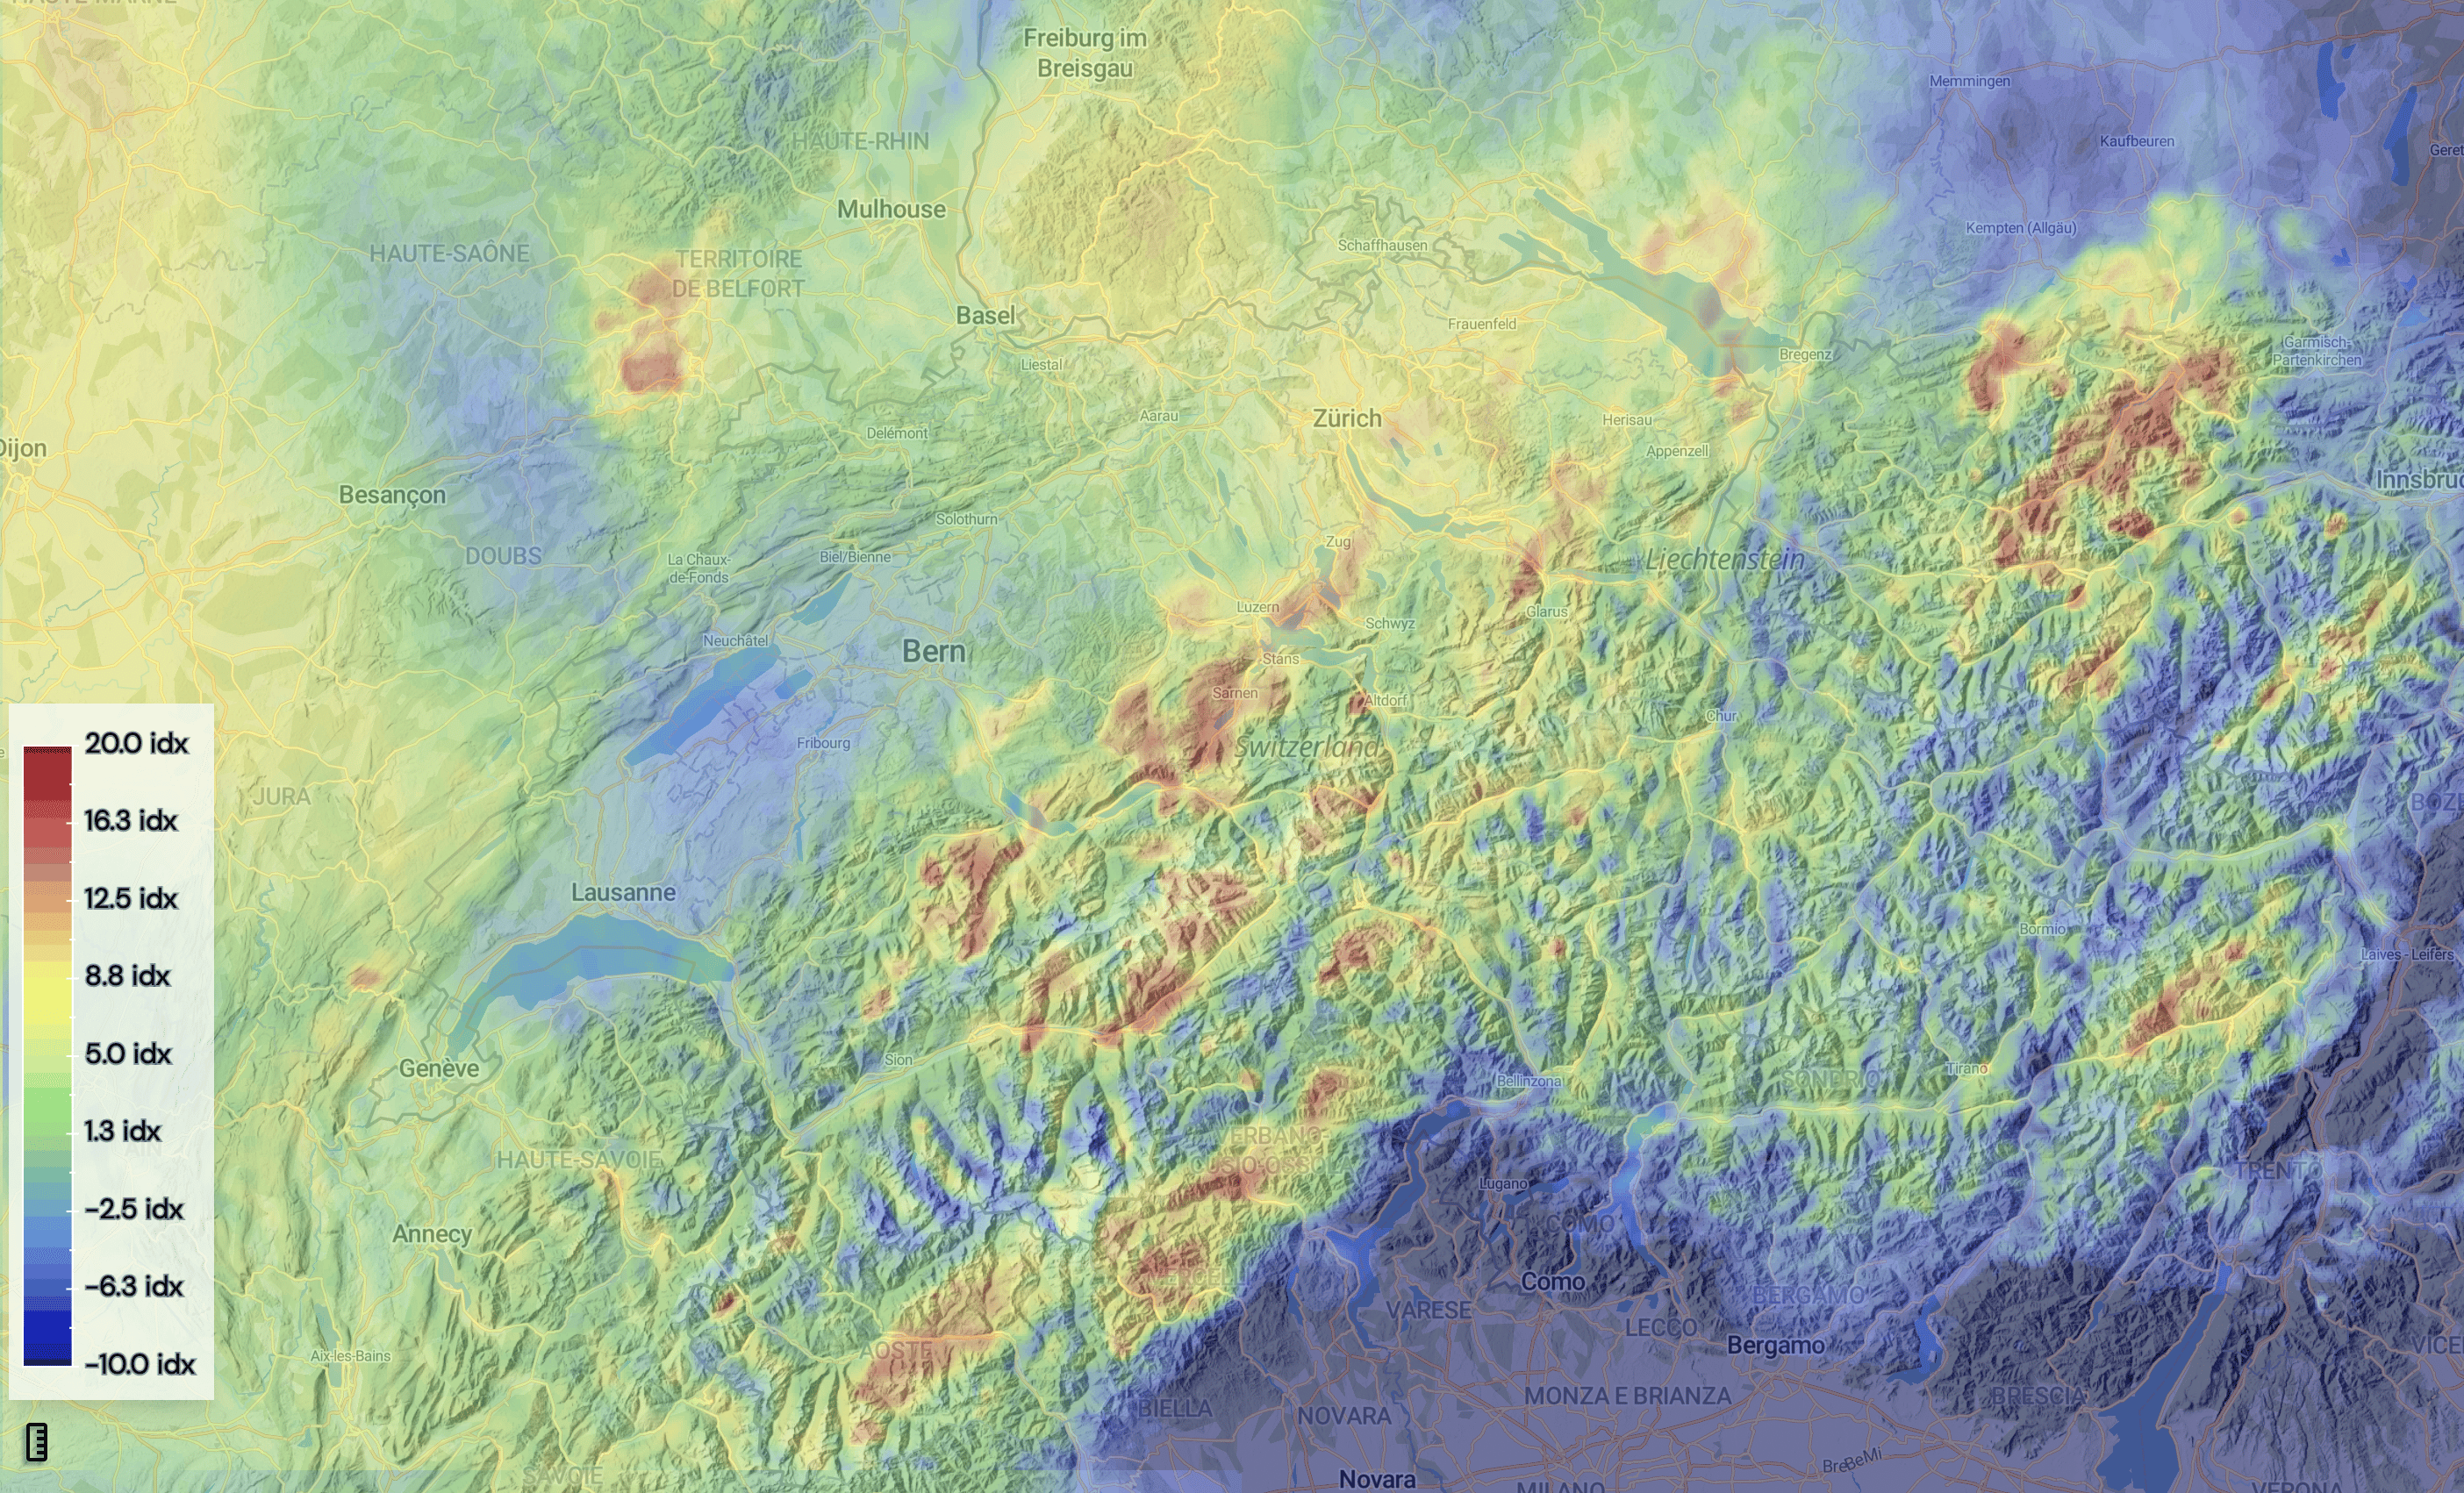
Below showing an example screenshot of the icing potential at 500hPa displayed via the powerful Meteomatics WMS interface. Very well visible is the icing potential along the cold front associated with the strong low pressure system West of Ireland.

-
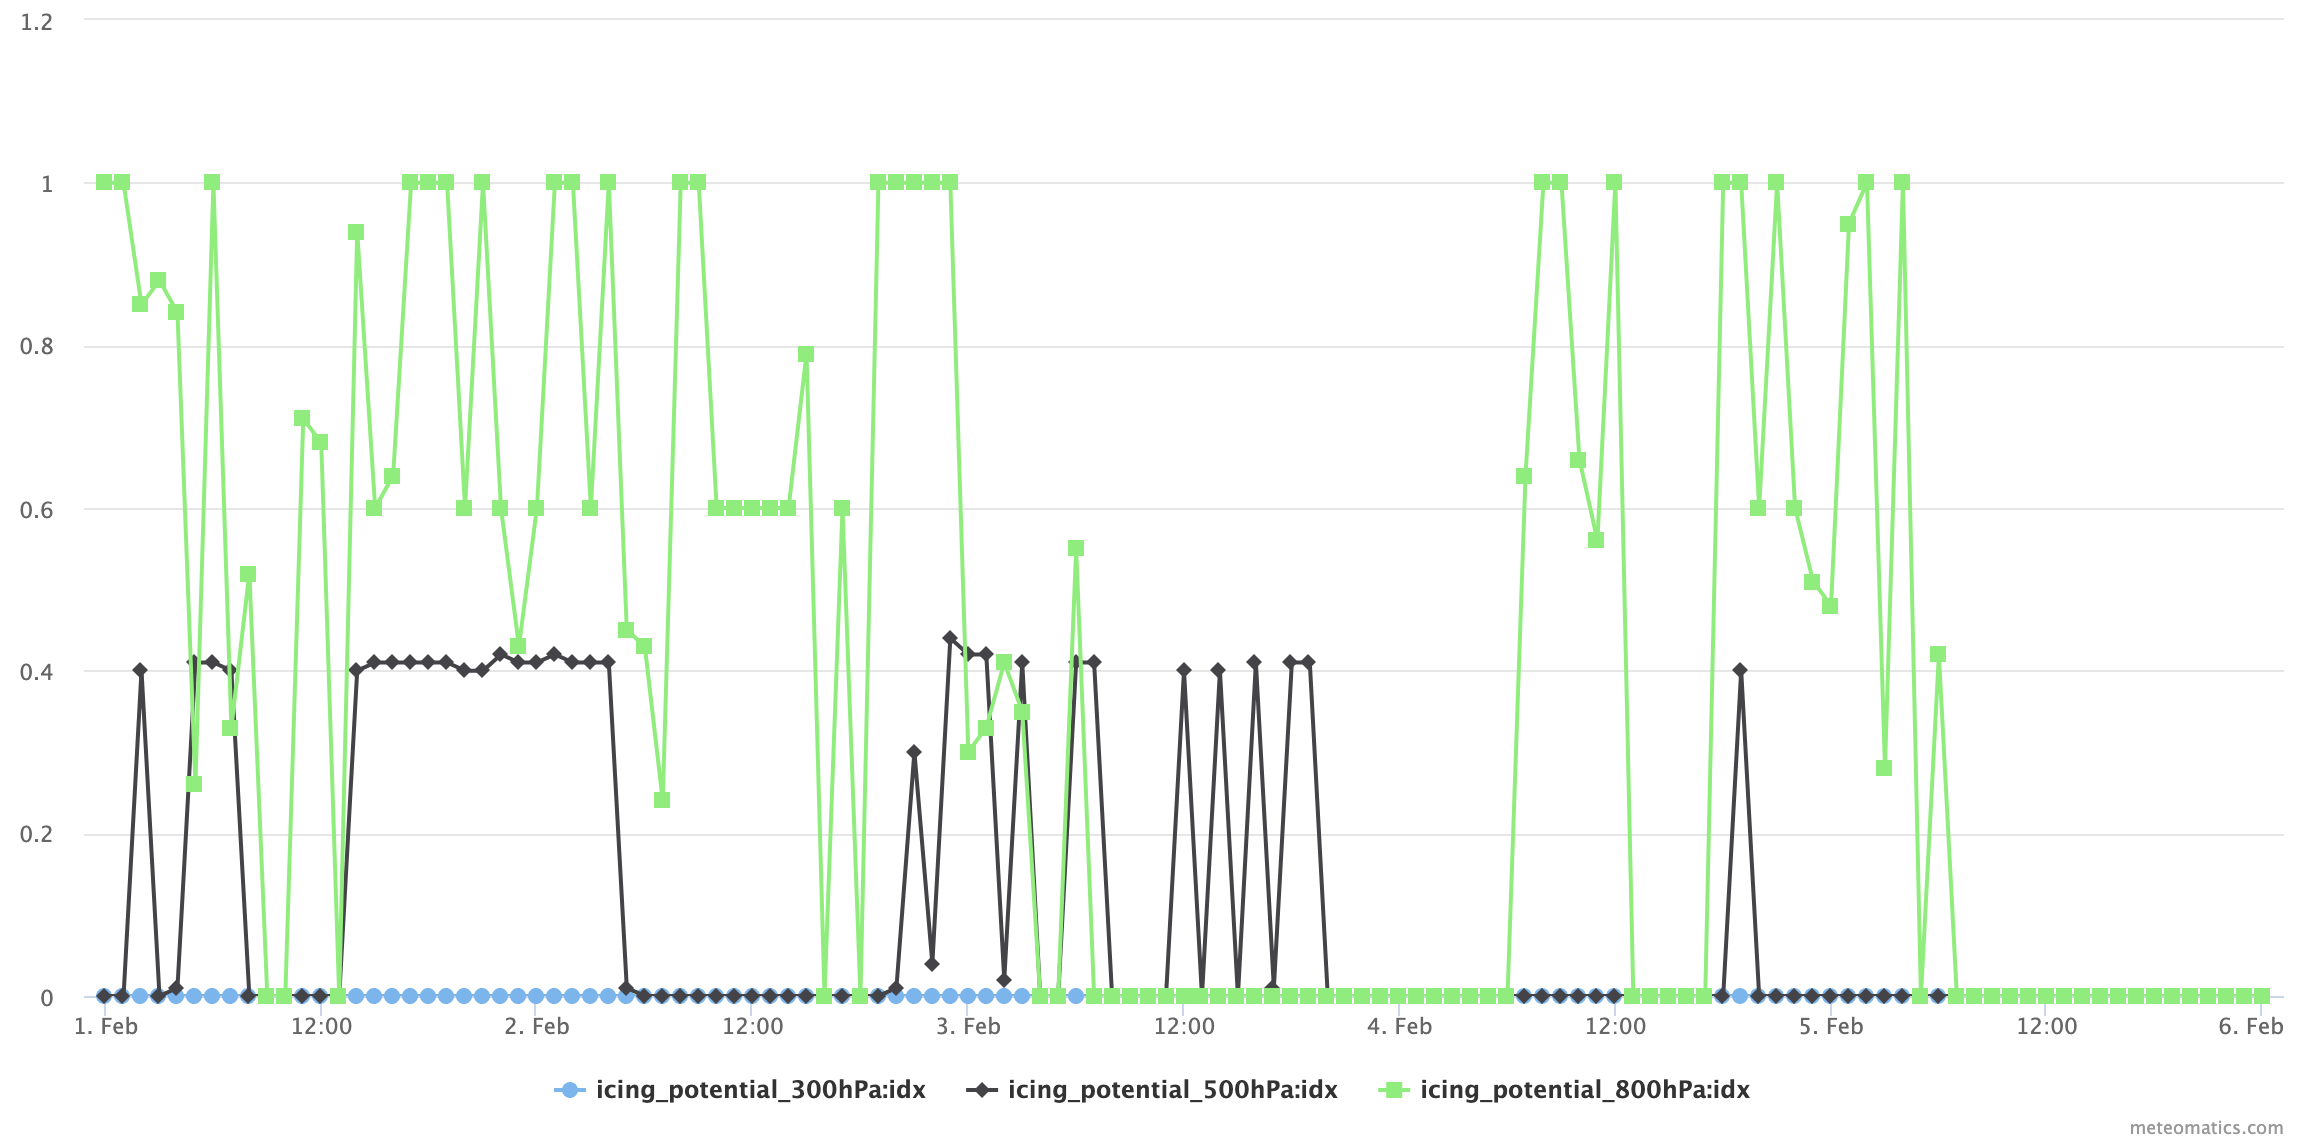
Hourly icing forecast on several layers for the next 5 days in one location:
https://api.meteomatics.com/2026-07-24T00:00:00ZP5D:PT1H/icing_potential_300hPa:idx,icing_potential_500hPa:idx,icing_potential_800hPa:idx/47.457625,8.555272/html
Interval Values of Icing Potential for Aviation
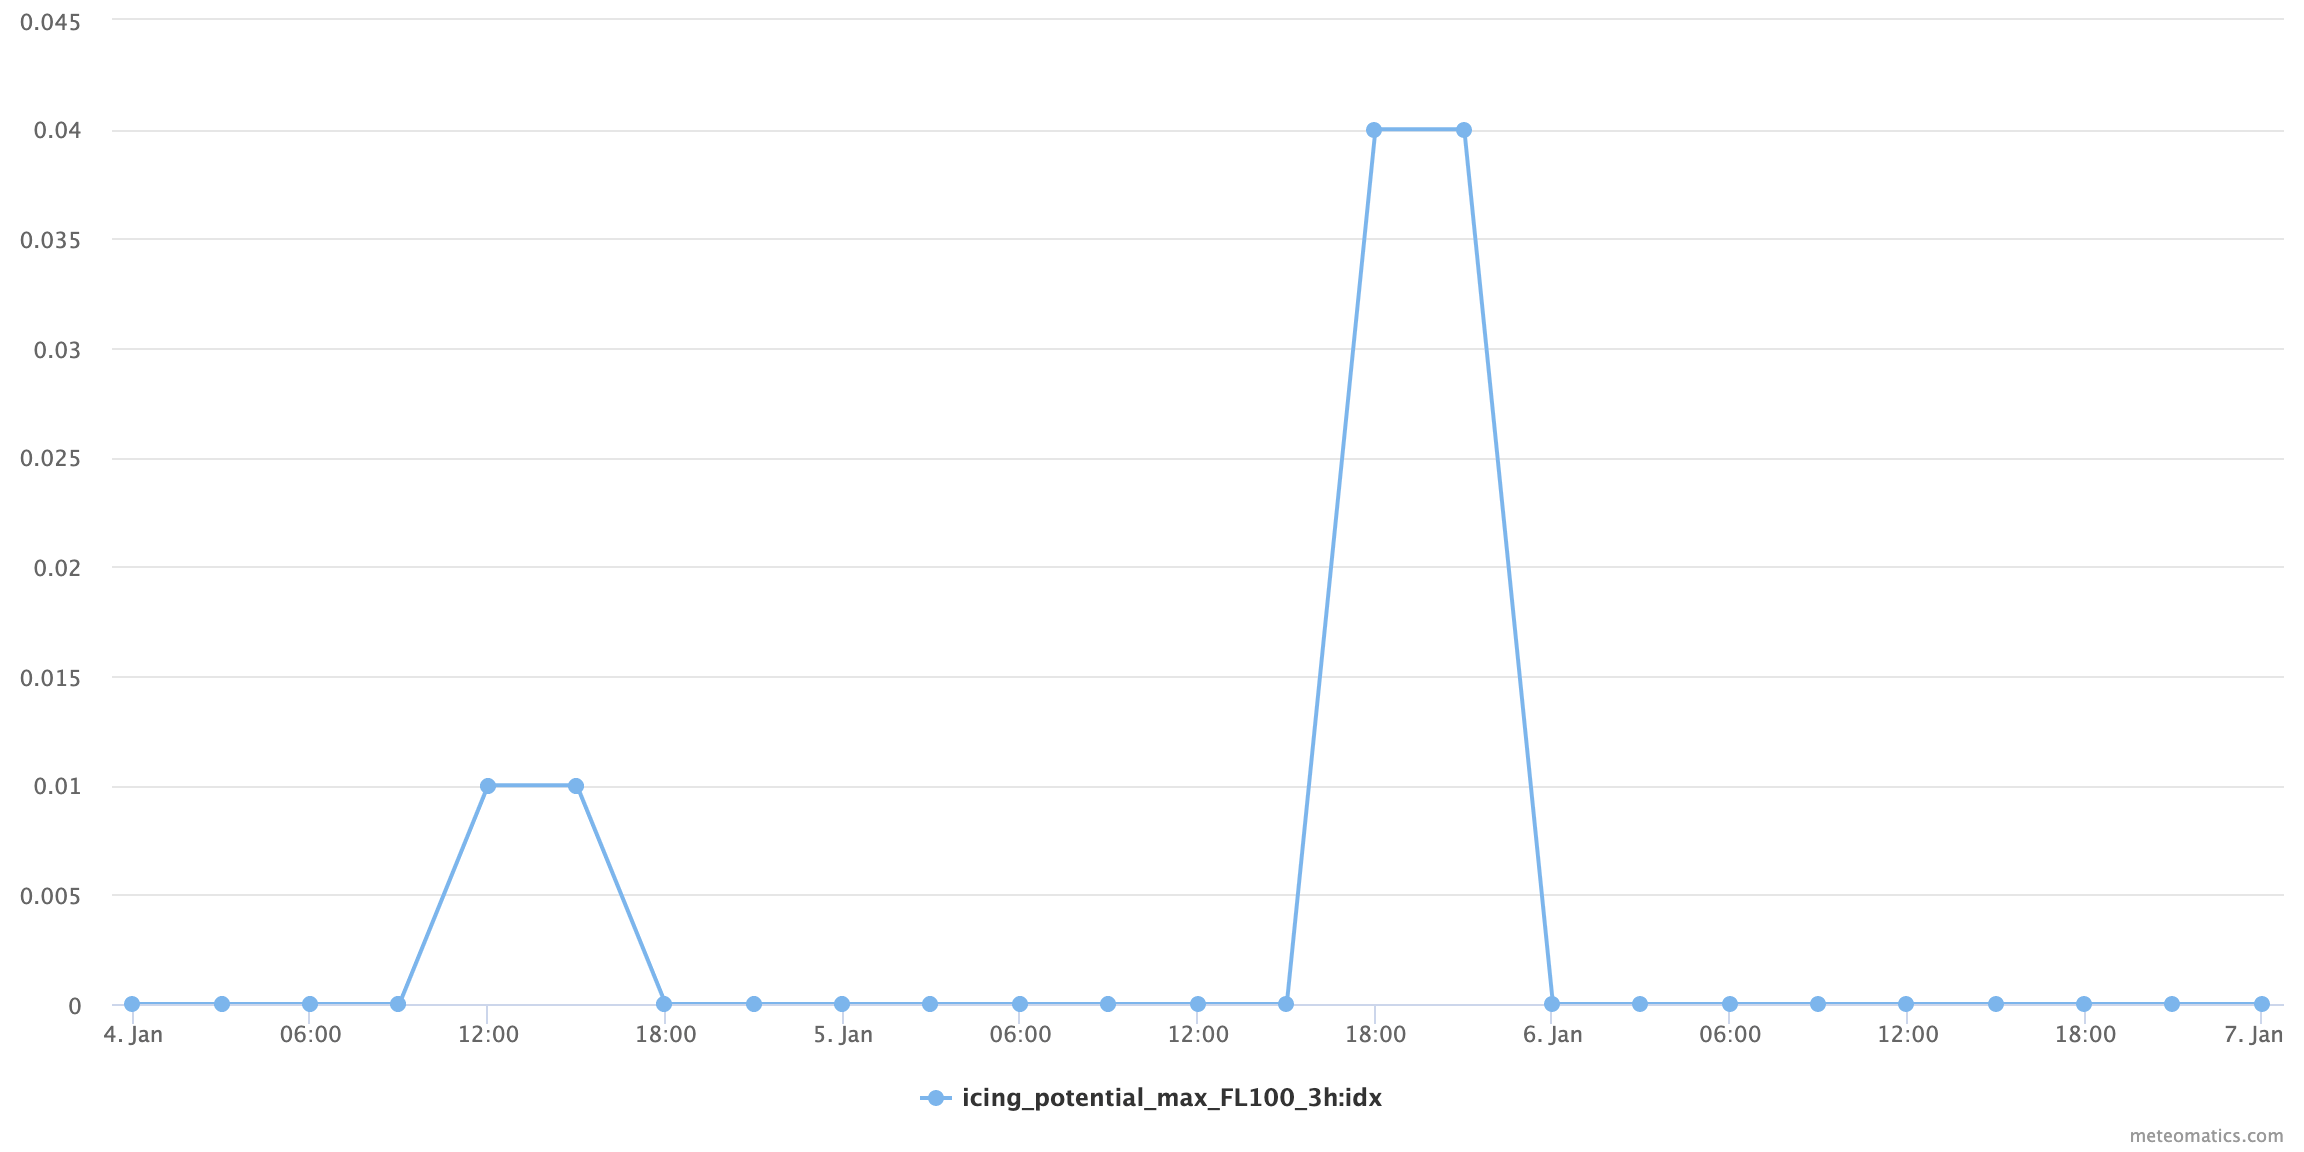
Gives the mean, maximum or minimum icing potential at the indicated flight level over the indicated duration.
icing_potential_<measure>_<level>_<interval>:idxAvailable flight levels: FL10 - FL605 (continuously)
Available meter levels: 2-20000m (continuously)
Available measures: mean, min, max
Available intervals: 1h, 3h, 6h, 12h, 24h
Examples
-
Create a time series for the maximum icing potential at FL100 for Los Angeles using 3 hour intervals.
-
Current situation:
https://api.meteomatics.com/2026-07-24T00:00:00Z--2026-07-27T00:00:00Z:PT3H/icing_potential_max_FL100_3h:idx/34.0522,118.2437/html?source=mix

Icing Warning (Energy)
Icing at lower altitudes is critical for infrastructure damages and safety around infrastructure like wind power turbines and power lines. This parameter provides an icing forecast from the surface to 400m height. It sorts the probability of occurrence of icing in 4 categories ranging from 0 (conditions unfavorable for icing) to 3 (high icing likelihood).
icing_warning_<level>:idxAvailable feet: 7-1200ft (continuously)
Available meter levels: 2-400m (continuously)
| Index | Description |
| 0 | Conditions unfavorable for icing |
| 1 | Icing possible |
| 2 | Icing likely |
| 3 | Icing highly likely |
Examples:
-
Below showing an example screenshot of the icing warning at 2m height displayed with MetX.


-
Hourly icing warning forecast on several heights for 5 days in January 2026 in one location:
https://api.meteomatics.com/2026-01-01T15:00:00.000ZP5D:PT1H/icing_warning_2m:idx,icing_warning_50m:idx,icing_warning_100m:idx/78.22,15.65/html?model=mix


High Ice Water Content (HIWC)
High Ice Water Content (HIWC) potential highlights regions with high concentrations of ice crystals that can accrete in turbine engines and cause sudden loss of engine thrust. Unlike classical supercooled-liquid icing (see icing_potential), HIWC hazards are typically linked to deep convection and may occur outside flight conditions traditionally defined as “icing conditions”.
hiwc_potential_<measure>_<level>_<interval>:idxAvailable flight levels: FL260 - FL460 (continuously)
Available measures: mean, min, max
Available intervals: 1h, 3h, 6h, 12h, 24h
| Index | Description |
| 1 | Moderate risk |
| 2 | High risk |
Examples:
-
Below showing an example screenshot of the HIWC potential at FL300 over Southeast Asia.


-
Hourly HIWC potential forecast on several flight layers for the next 5 days in one location:
https://api.meteomatics.com/2026-07-24T00:00:00ZP5D:PT1H/hiwc_potential_FL280:idx,hiwc_potential_FL300:idx,hiwc_potential_FL440:idx/18,118/html?source=mix


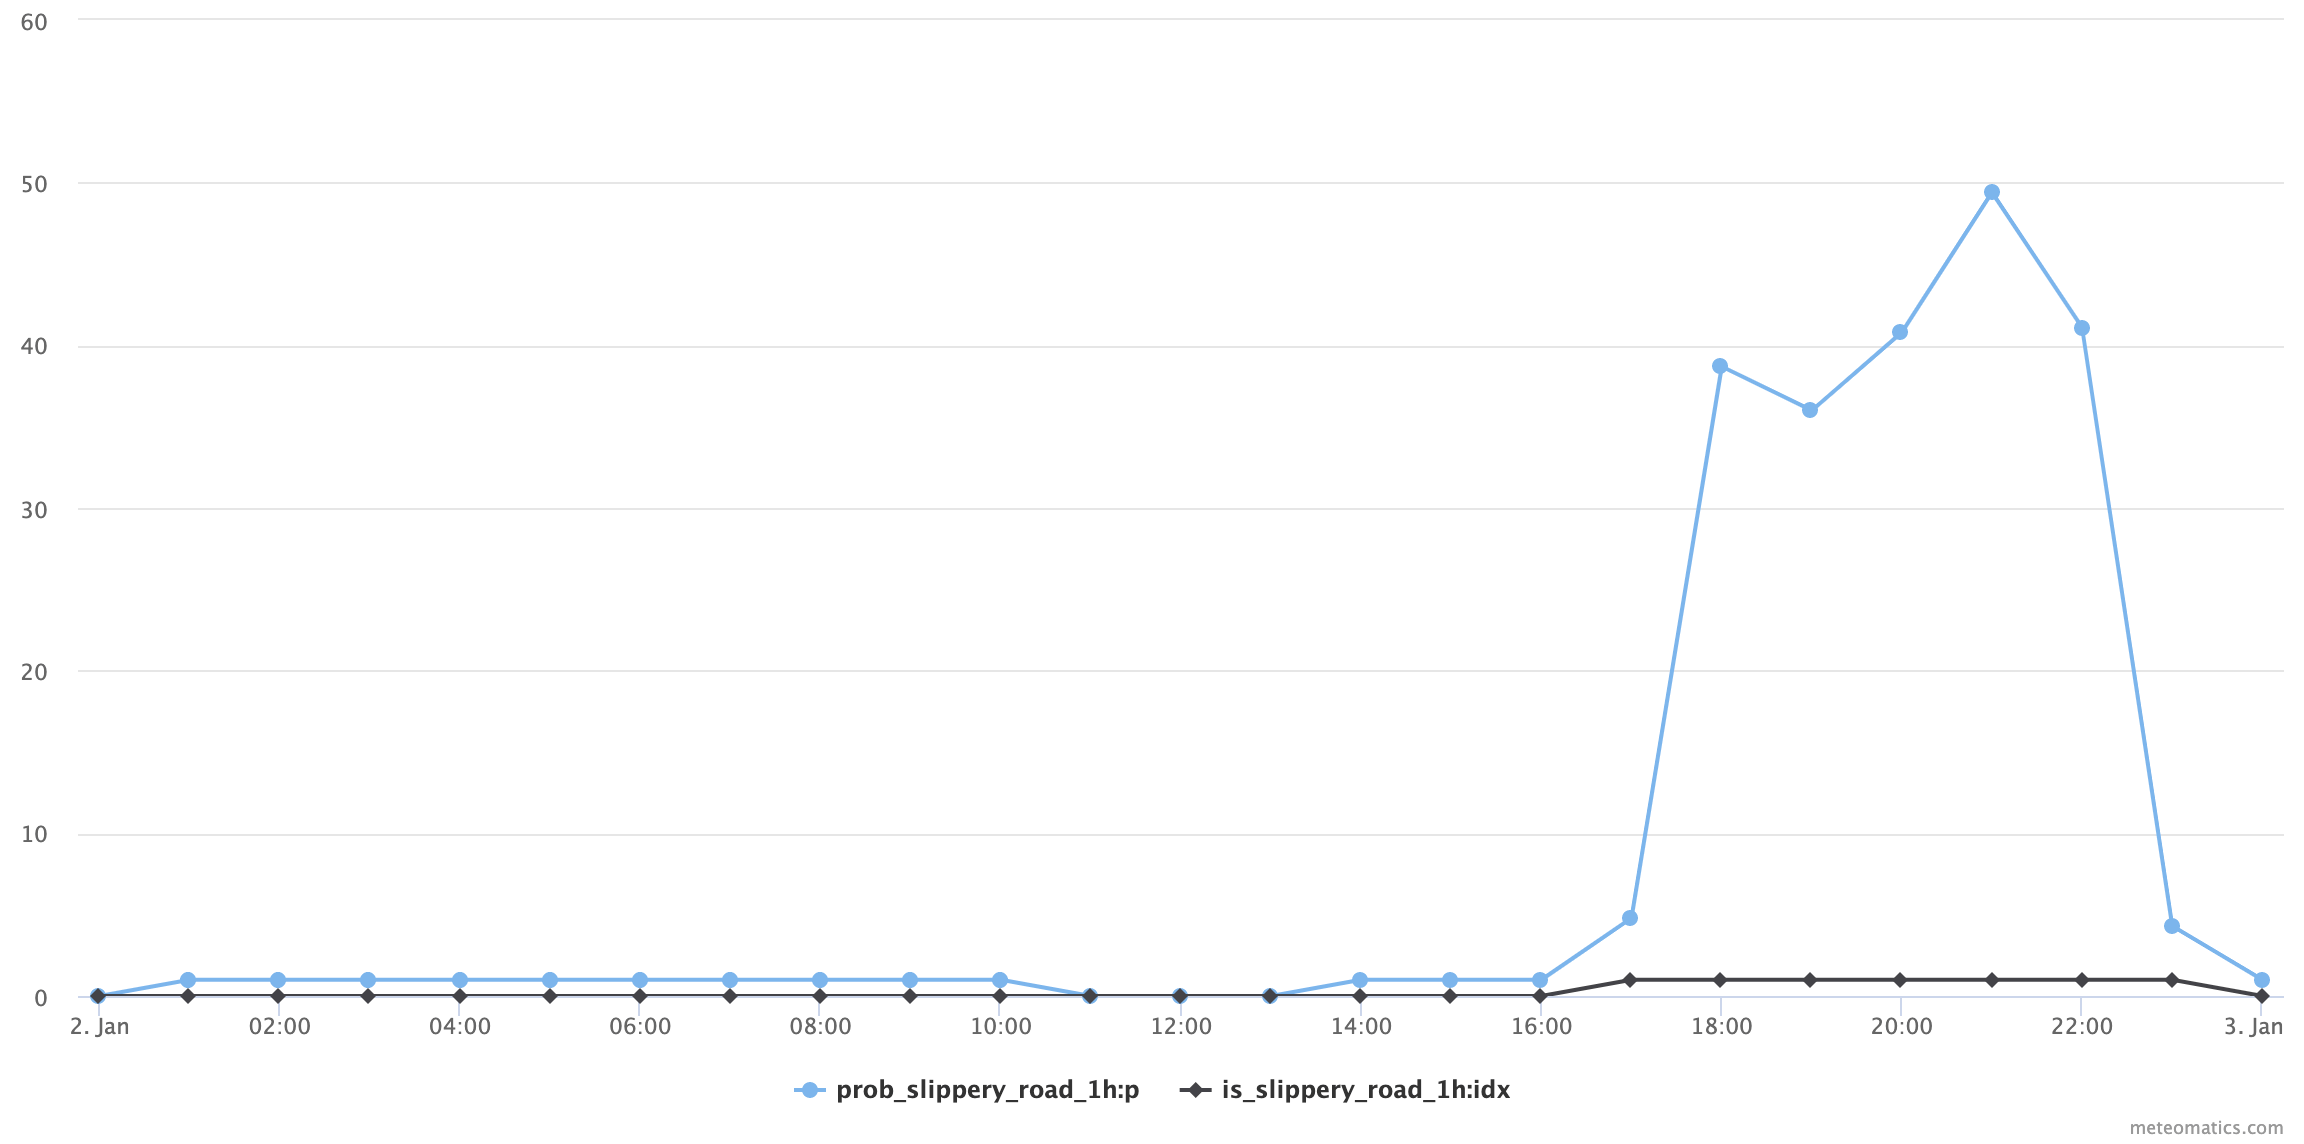
Slippery Road
Check if there is any chance for slippery roads within the given interval.
Probability:
prob_slippery_road_<interval>:pProvides the probability for slippery roads from 0-100 %.
Binary Index:
is_slippery_road_<interval>:idx0: no slippery road conditions, 1: slippery roads possible
Available intervals: 1h, 3h, 6h, 12h, 24h
Examples:
-
Check if slippery roads were probable on January 2nd, 2017:
Current situation:
https://api.meteomatics.com/2026-07-24T00:00:00Z--2026-07-29T00:00:00Z:PT1H/prob_slippery_road_1h:p,is_slippery_road_1h:idx/47.412164,9.340652/html-
The possibility of slippery roads in the next five days in 12 hours steps as a json file output:
https://api.meteomatics.com/2026-07-24T00:00:00Z--2026-07-29T00:00:00Z:PT12H/is_slippery_road_12h:idx/47.412164,9.340652/json{"version":"3.0","user":"api-test","dateGenerated":"2018-02-07T16:17:17Z","status":"OK","data": [{"parameter":"is_slippery_road_12h:idx","coordinates":[{"lat":47.4122,"lon":9.34065,"dates": [{"date":"2017-01-01T00:00:00Z","value":0},{"date":"2017-01-01T12:00:00Z","value":0}, {"date":"2017-01-02T00:00:00Z","value":0},{"date":"2017-01-02T12:00:00Z","value":0}, {"date":"2017-01-03T00:00:00Z","value":0},{"date":"2017-01-03T12:00:00Z","value":0}, {"date":"2017-01-04T00:00:00Z","value":0},{"date":"2017-01-04T12:00:00Z","value":1}, {"date":"2017-01-05T00:00:00Z","value":1},{"date":"2017-01-05T12:00:00Z","value":1}, {"date":"2017-01-06T00:00:00Z","value":0}]}]}]}
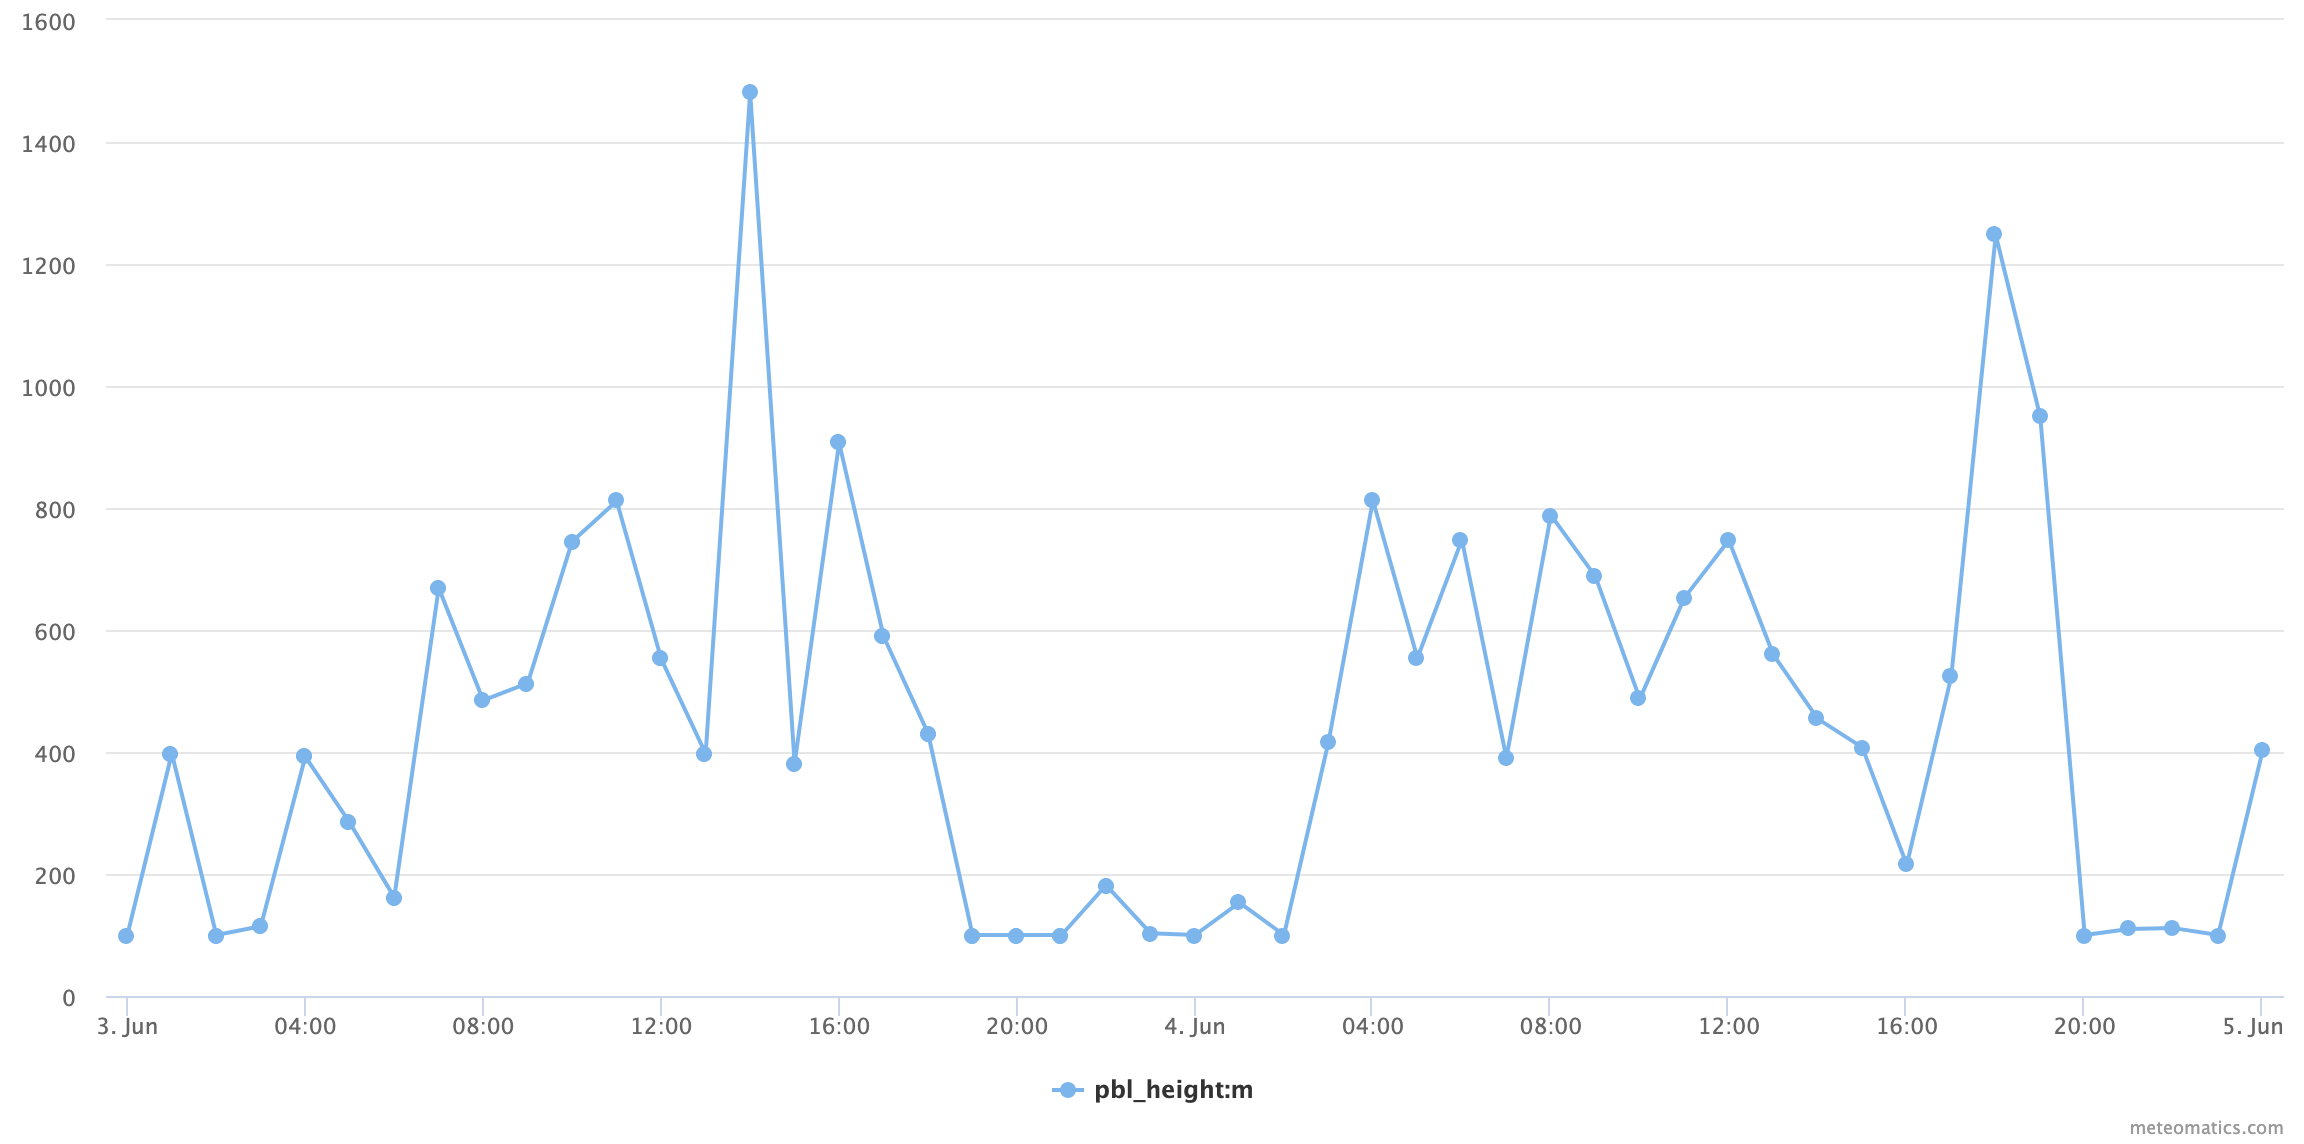
Planetary Boundary Layer Height
The planetary boundary layer (PBL) height is determined by identifying the height above ground level, where big wind direction changes, local minima of wind speed, local maxima of temperature, high temperature increases (inversion) or high potential temperature increases occur.
pbl_height:<unit>Available units: m, ft, mi
Example:
-
The PBL height until the day after tomorrow:
https://api.meteomatics.com/2026-07-24T00:00:00Z--2026-07-26T00:00:00Z:PT1H/pbl_height:m/47.412164,9.340652/html
Tropopause Height
The tropopause is the atmospheric boundary delimiting the troposphere from the stratosphere. Owing to adiabatic expansion, temperature decreases with height in the troposphere, while it increases again in the stratosphere mainly due to the absorption of UV light. The thermal tropopause marks this temperature profile inversion.
tropopause_height:<unit>Units: FL, ft, m, km, dam.
Vertical search range: FL150–FL530 (~4.6–16.1 km)
A tropopause height of FL150 should be interpreted as FL150 or lower. Correspondingly, a tropopause height of FL530 should be interpreted as FL530 or higher. When the algorithm fails to identify any line, the default value FL360 is returned (according to ICAO standard).
Examples
-
Tropopause height for Zürich for the next 5 days:
https://api.meteomatics.com/2026-07-24T00:00:00Z--2026-07-29T00:00:00Z:PT1H/tropopause_height:km/47.3769,8.5417/html -
Tropopause height over Italy:
https://api.meteomatics.com/2026-07-24T00:00:00Z/tropopause_height:FL/50,5_35,20:1,1/html_map
- Example tropopause height visualisation using MetX:


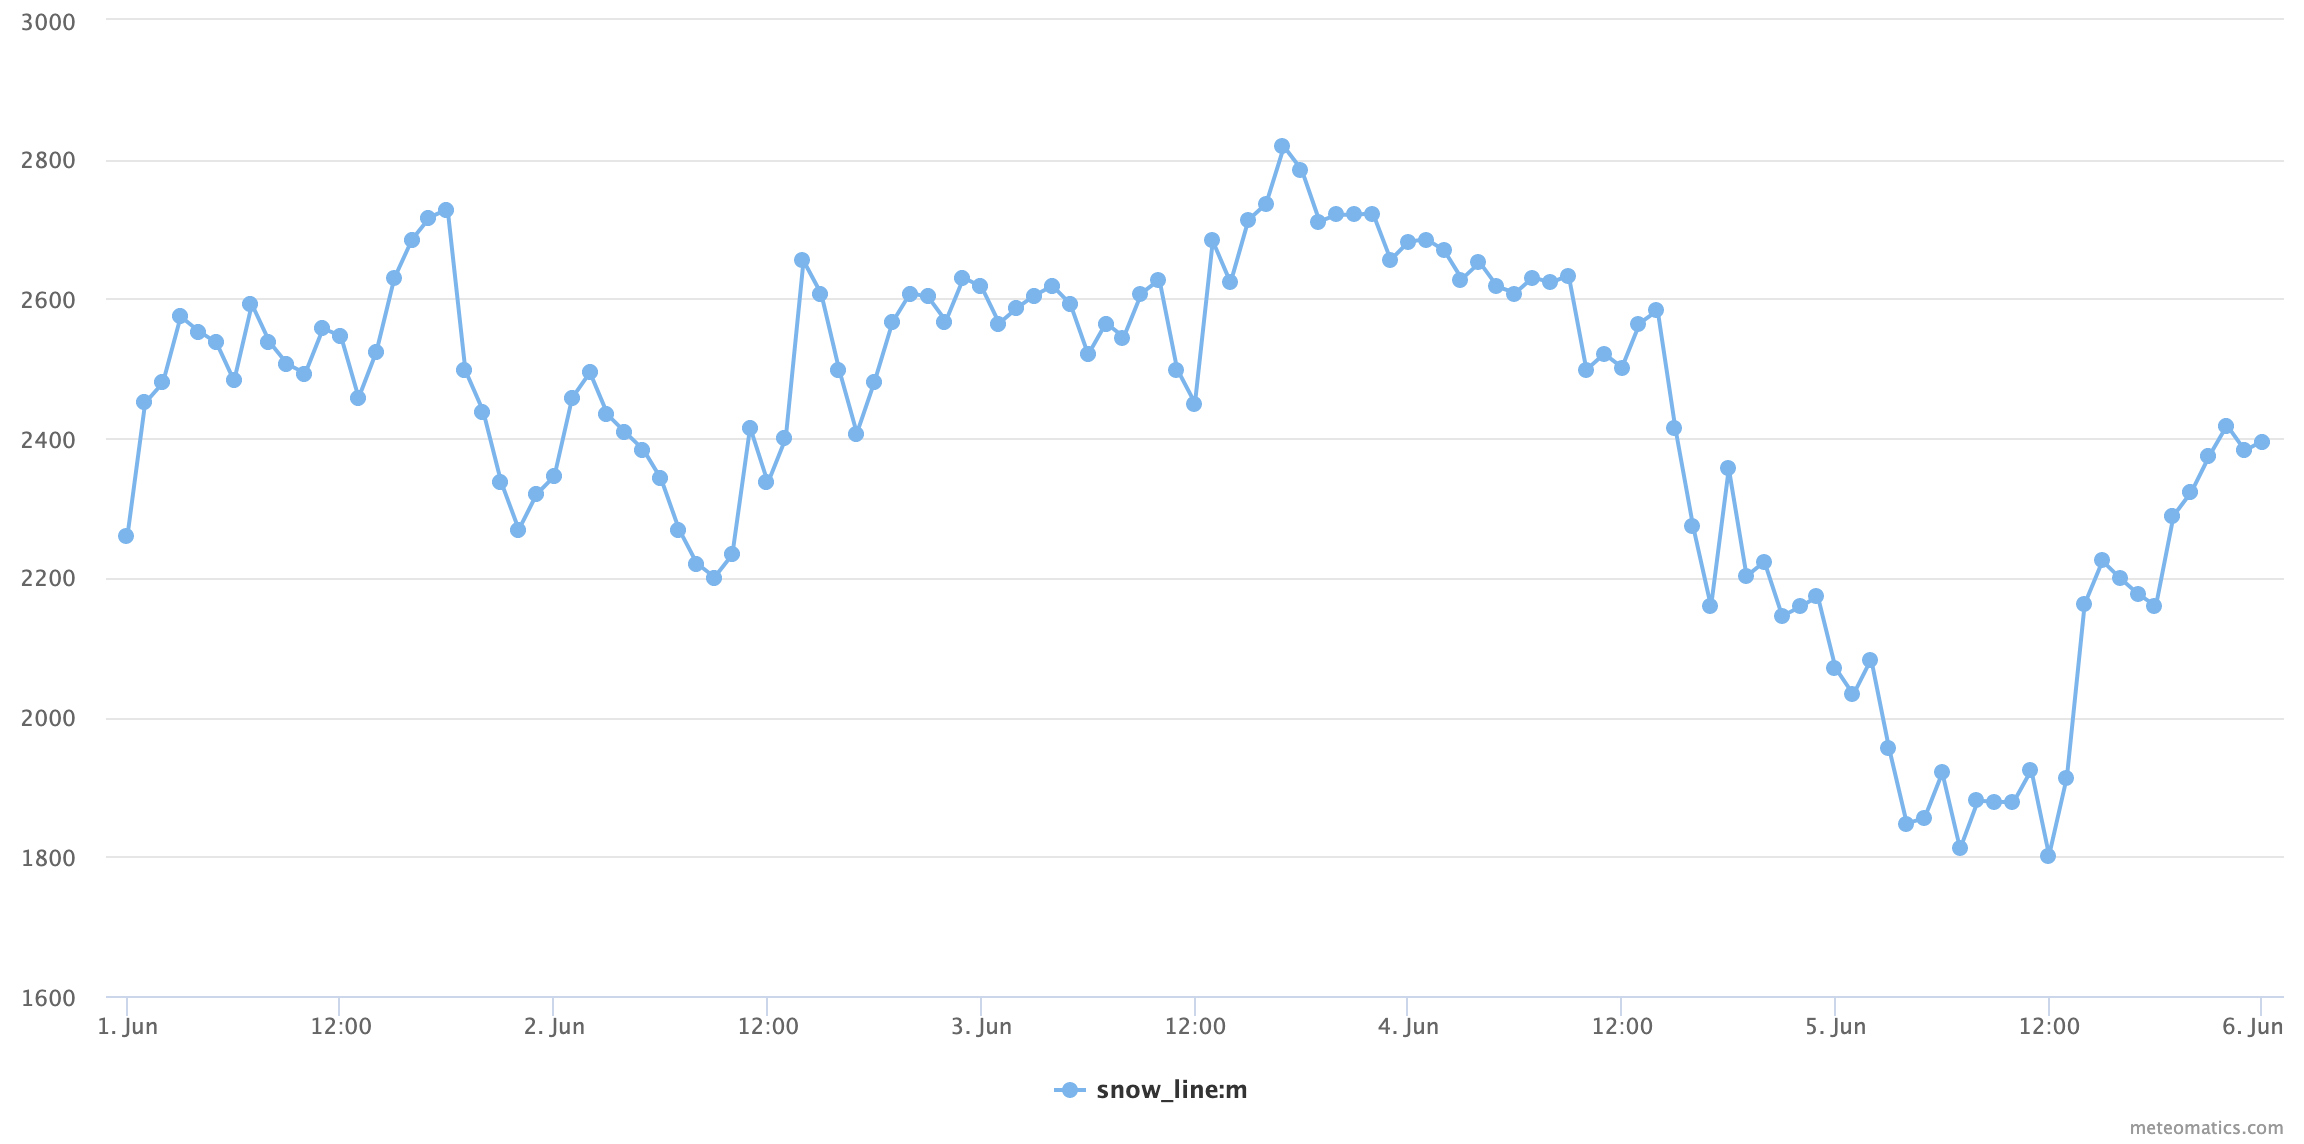
Snow Line
The snow line parameter provides the height above which precipitation occurs in the form of snow. Should it be undeterminable, for example if it is below ground level, it returns -666.
snow_line:<unit>Available units: m, ft, mi
Example:
-
The height of the snow line for the next 5 days:
https://api.meteomatics.com/2026-07-24T00:00:00Z--2026-07-29T00:00:00Z:PT1H/snow_line:m/47.412164,9.340652/html
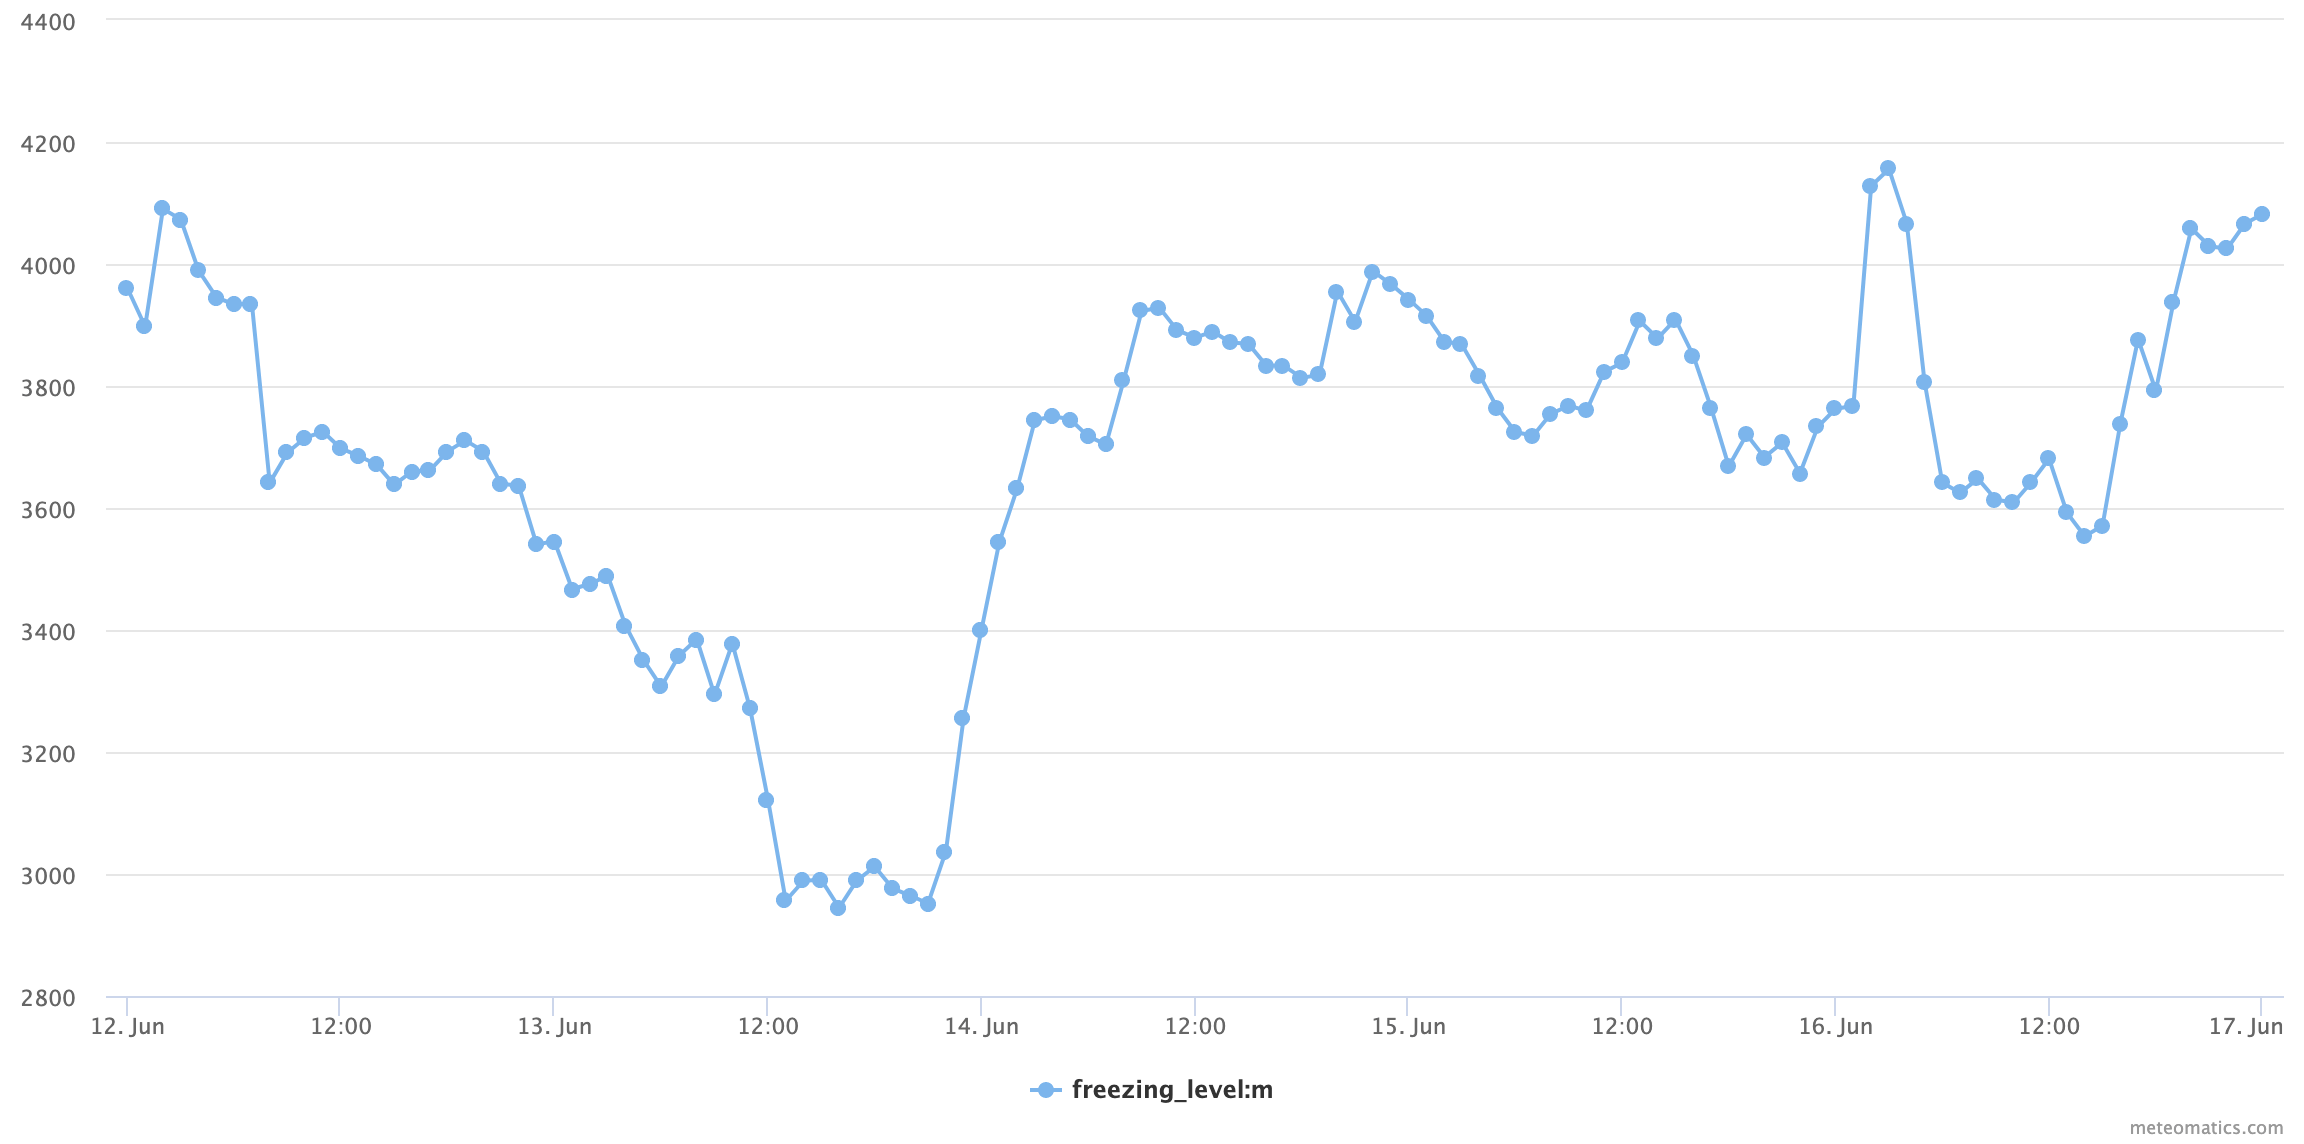
Freezing Level
The freezing level parameter provides the altitude where the temperature equals 0 °C. If the freezing level is below ground, the return value is -666. In case of strong convection, the height of the freezing level correlates with the size of hail observed at the surface, since it determines the melting area for falling hail.
freezing_level:<unit>Available units: m, ft, mi
Example:
-
The height of the freezing level for the next 5 days:
https://api.meteomatics.com/2026-07-24T00:00:00Z--2026-07-29T00:00:00Z:PT1H/freezing_level:m/47.412164,9.340652/html
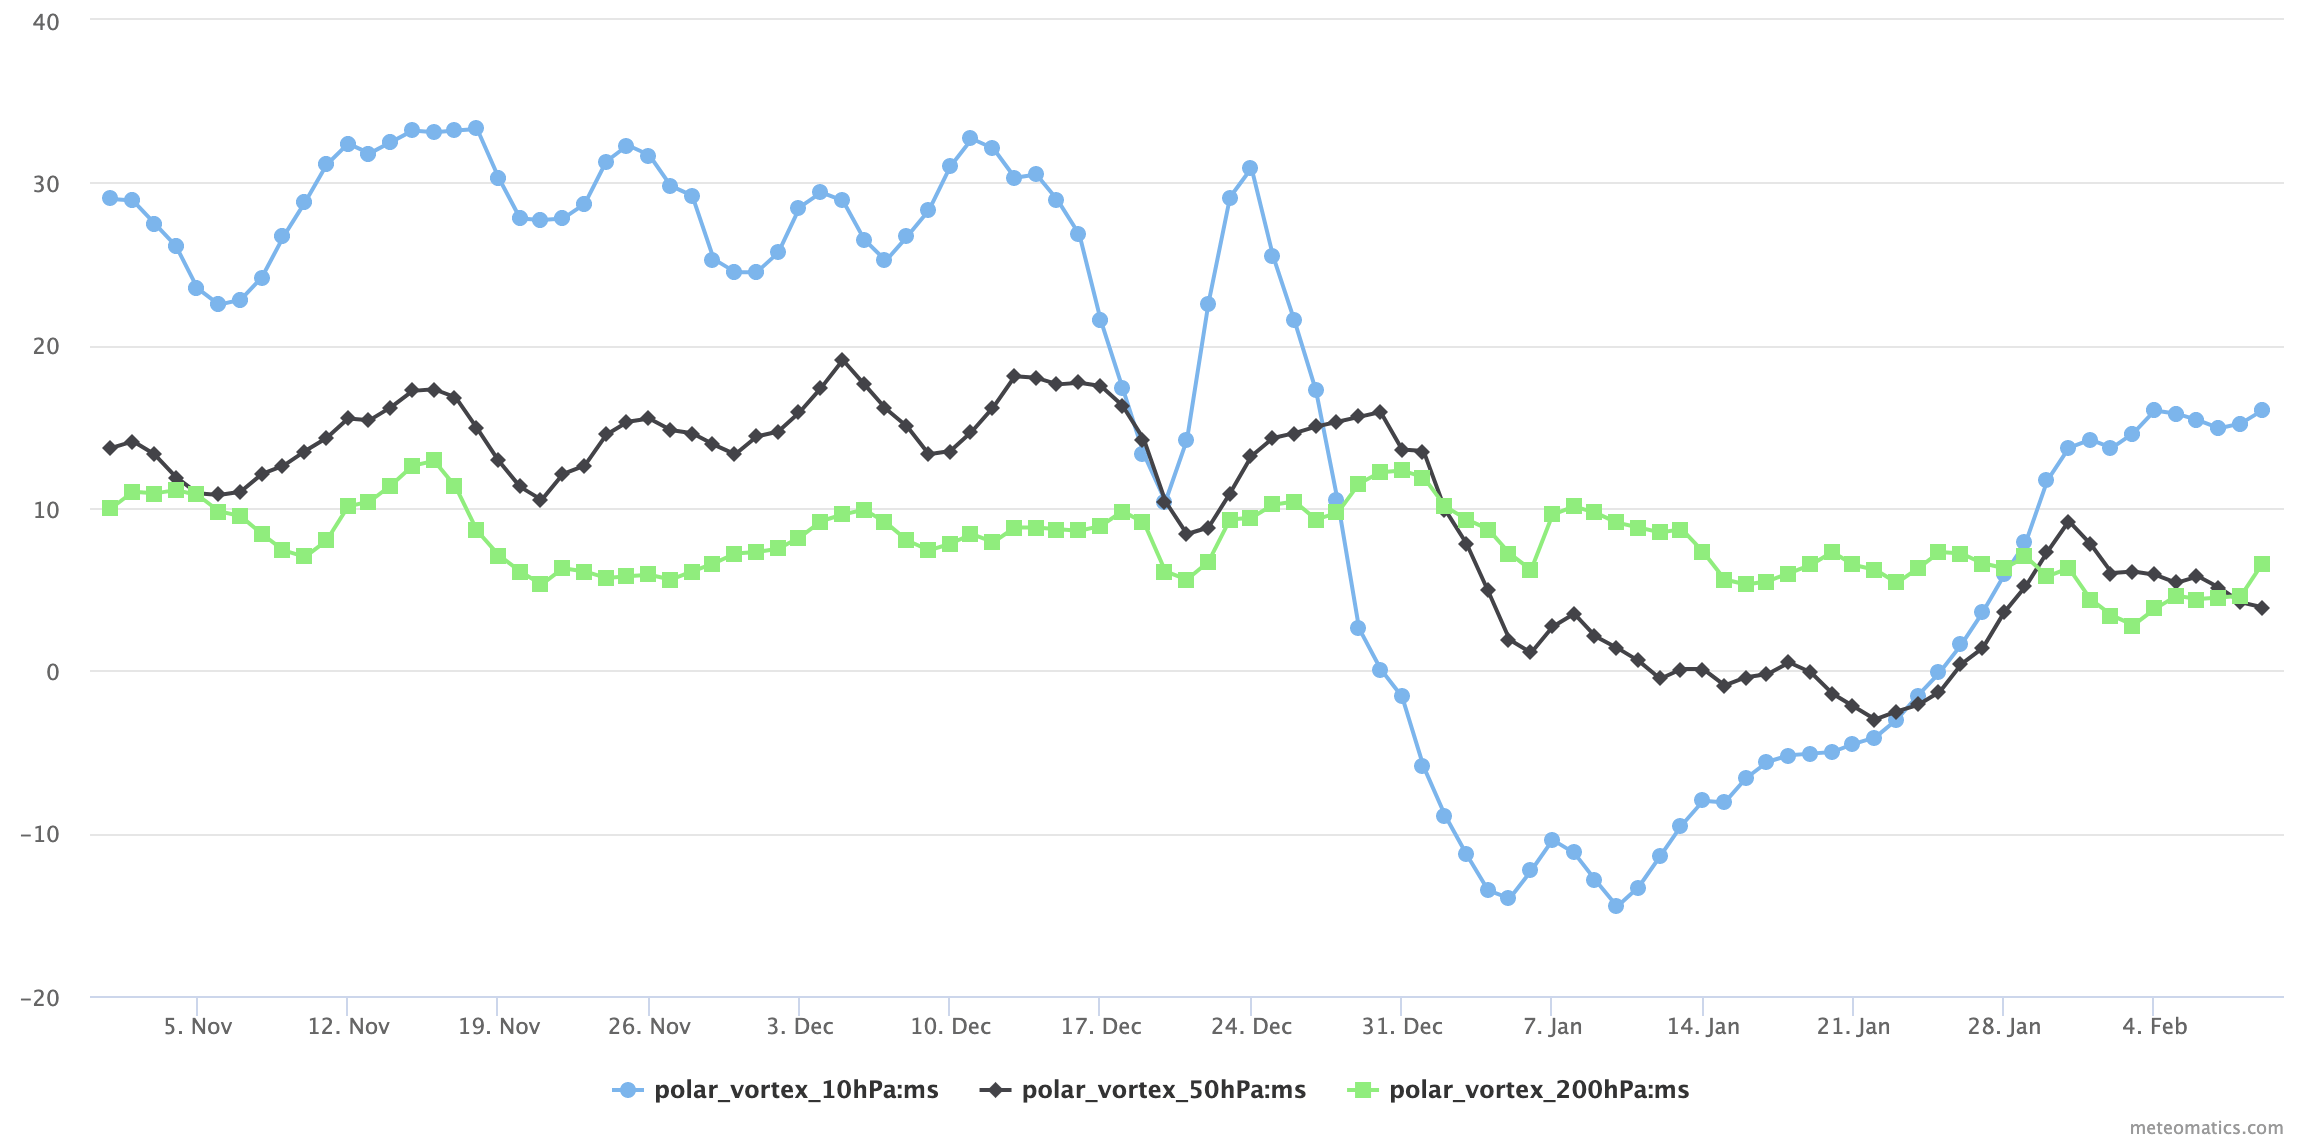
Stratospheric Polar Vortex (SPV): Wind speed
This index provides the average wind speed at 10, 50 or 200 hPa between 60 °N and 90 °N and thus indicates the strength of the stratospheric polar vortex during the polar winter.
The SPV index provides a measure of the circumpolar vortex strength and indirectly relates to a risk of cooling temperatures near the surface in the northern hemisphere, if decreasing below zero.
If the index becomes negative, the vortex disruption is such that a "split" or strong "displacement" is under way, possibly weakening the jet stream in the troposphere.
polar_vortex_<level>:<unit>Available units: ms, mph, kn
Available levels: 200hPa, 50hPa, 10hPa
Example:
-
Show the SPV strength at 10, 50 and 200 hPa for the next 100 days:
https://api.meteomatics.com/2026-07-24T00:00:00ZP100D:P1D/polar_vortex_10hPa:ms,polar_vortex_50hPa:ms,polar_vortex_200hPa:ms/50,10/html
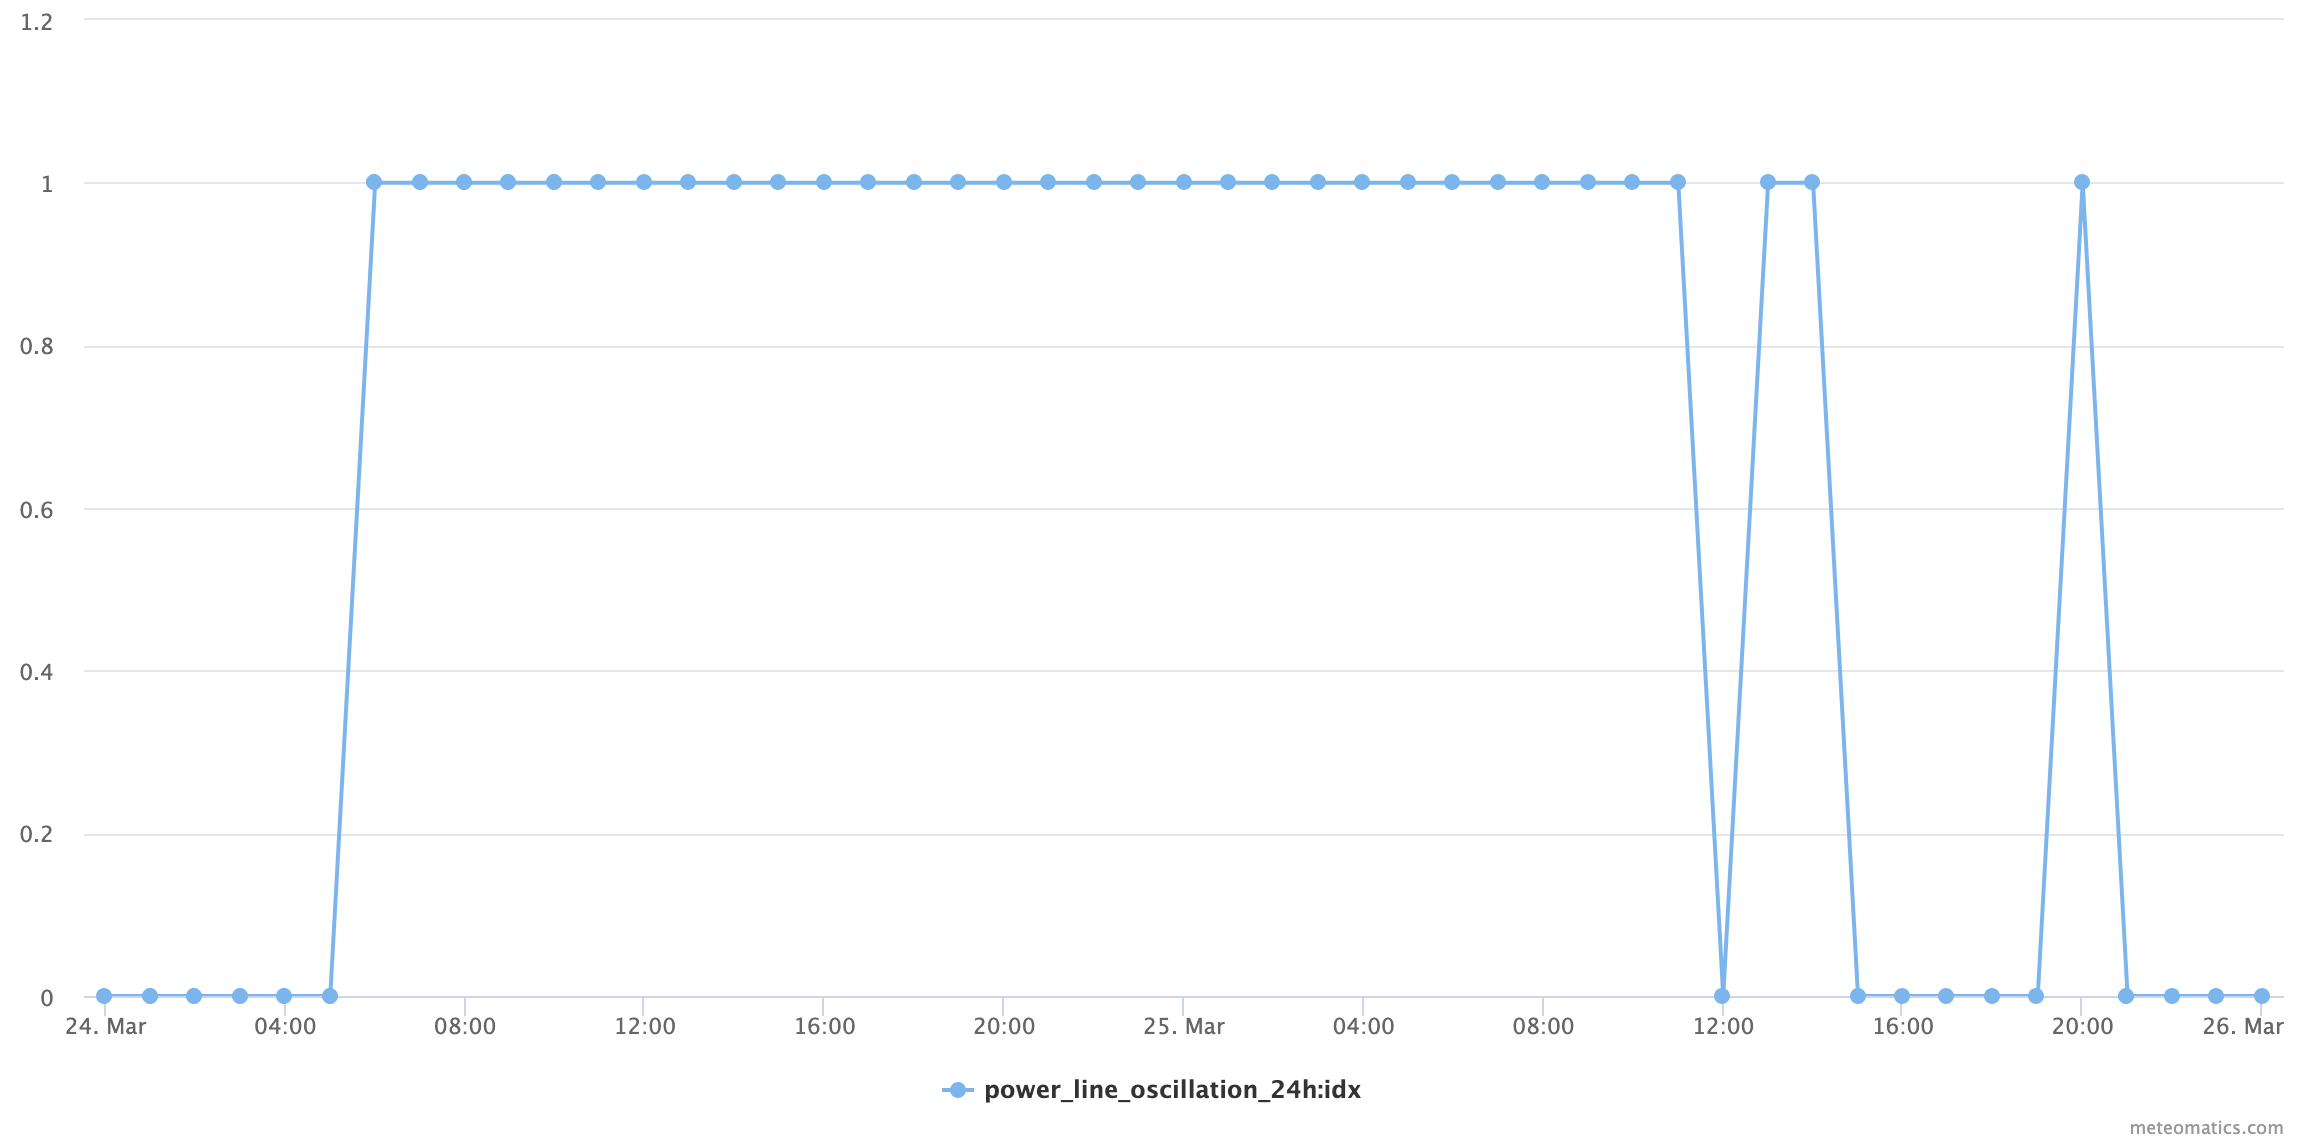
Power line oscillation warning
Precipitation in the form of freezing rain or wet snow can freeze onto overland power lines. With the increase in diameter and mass come a bigger air resistance and a lower resonance frequency. Strong wind over a sufficient amount of time could then excite the conductors to oscillate near their resonance frequency (sometimes referred to as gallop) and thereby damage the lines and masts.
A power line oscillation warning for the past 24 hours can be queried with the following parameter:
power_line_oscillation_24h:idxThe warning is binary with 1 corresponding to a warning and 0 to an all clear. Not taken into account are things like constructional details of the power lines or the Joule heat emitted by active power lines.
Example:
-
From March 24 2016 to March 26 2016 there was a power outage in Halton Hills due to galloping power lines, which is exemplified by the following time series:
Current situation:
https://api.meteomatics.com/2026-07-24T00:00:00Z--2026-07-29T00:00:00Z:PT1H/power_line_oscillation_24h:idx/43.64,-79.931944/html
Soaring Index
The soaring-index is used for an estimation of the thermal situation. It is useful for paraglider and other sport pilots. A higher soaring-index also shows a greater chance of showers and thunderstorms, as it is a measure of the lift caused by convective clouds. The soaring index is independent of altitude, as it is computed with variables in different altitudes.
| soaring conditions | soaring index range |
|---|---|
| poor | < -10 |
| moderate | -10 to 5 |
| good | 5 to 20 |
| excellent | > 20 |
soaring_index:idxExample:

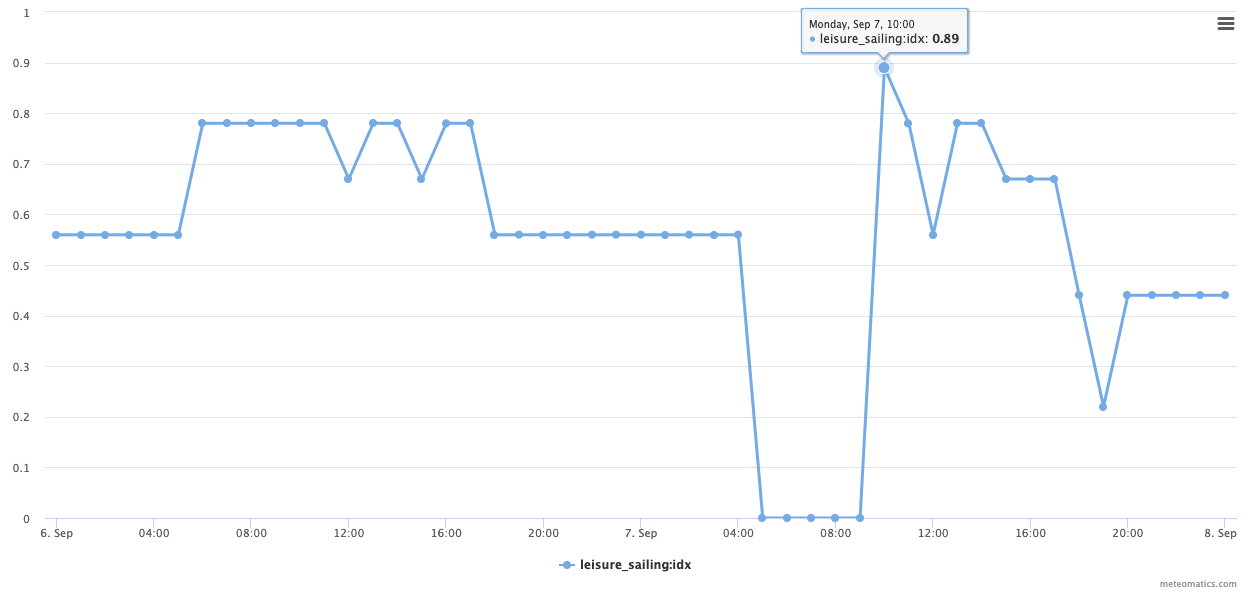
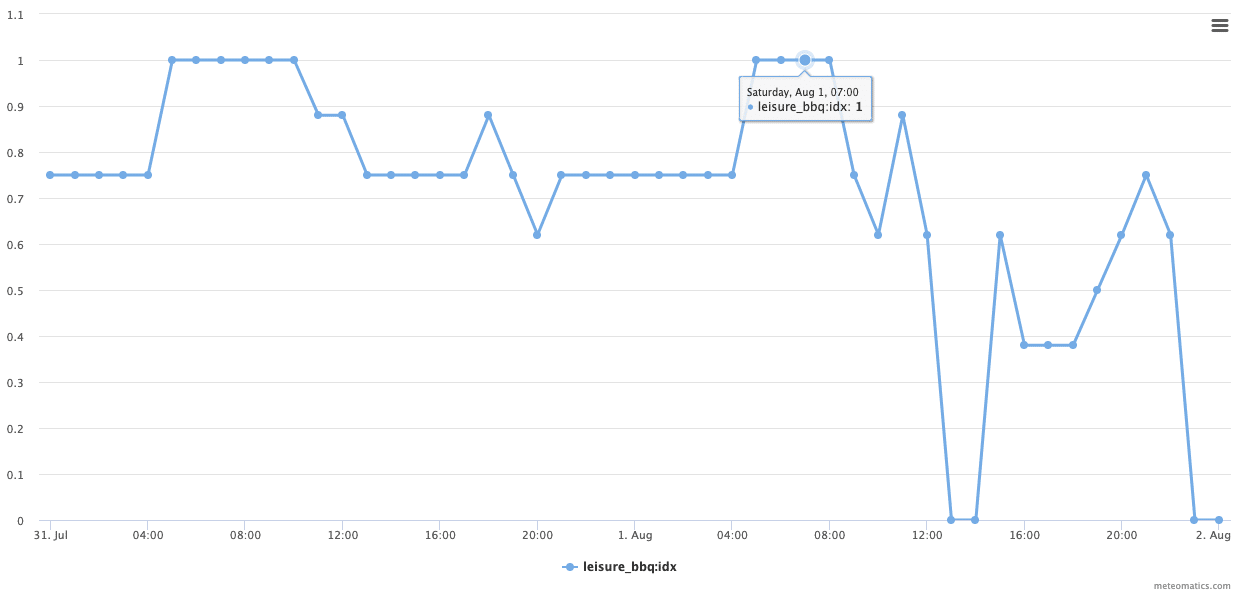
Leisure Indices
The leisure index combines different weather parameters and assesses if weather conditions are favorable for certain outdoor activities or not. The index ranges from 0 to 1, where 1 means that conditions are perfect for the queried activity at the queried point in time (i.e. the parameter is instantaneous).
The indices are based on a combination of precipitation, temperature, wind speed, wind gusts, humidity, sunshine duration, snow cover, visibility and fog.
leisure_<activity>:idxballooning, bbq, beach, biking, climbing, fishing, gardening, gliding, hiking, hunting, sailing, skiing, tv
Examples:
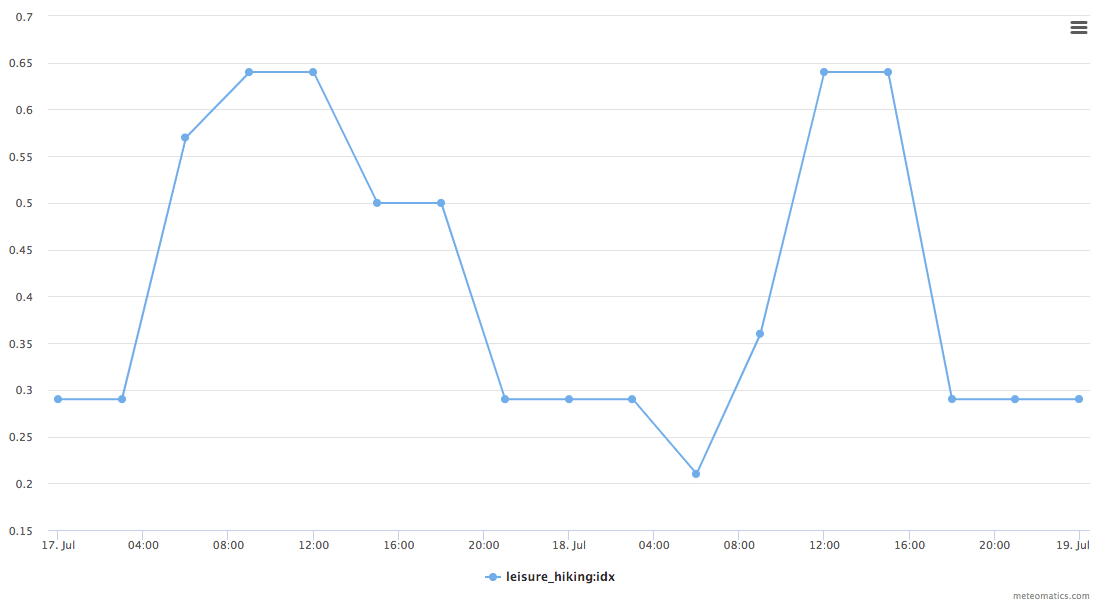
Create a time series of the leisure index for hiking on Säntis:
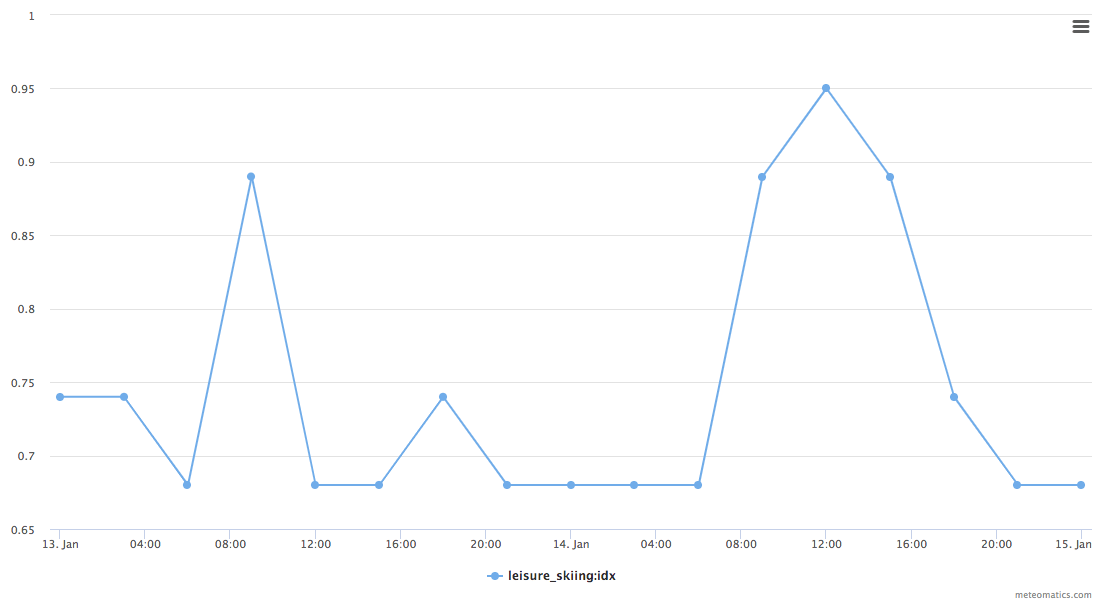
https://api.meteomatics.com/2026-07-24T00:00:00Z--2026-07-27T00:00:00Z:PT1H/leisure_hiking:idx/47.250920,9.362451/htmlCreate a time series of the leisure index for skiing in Davos:
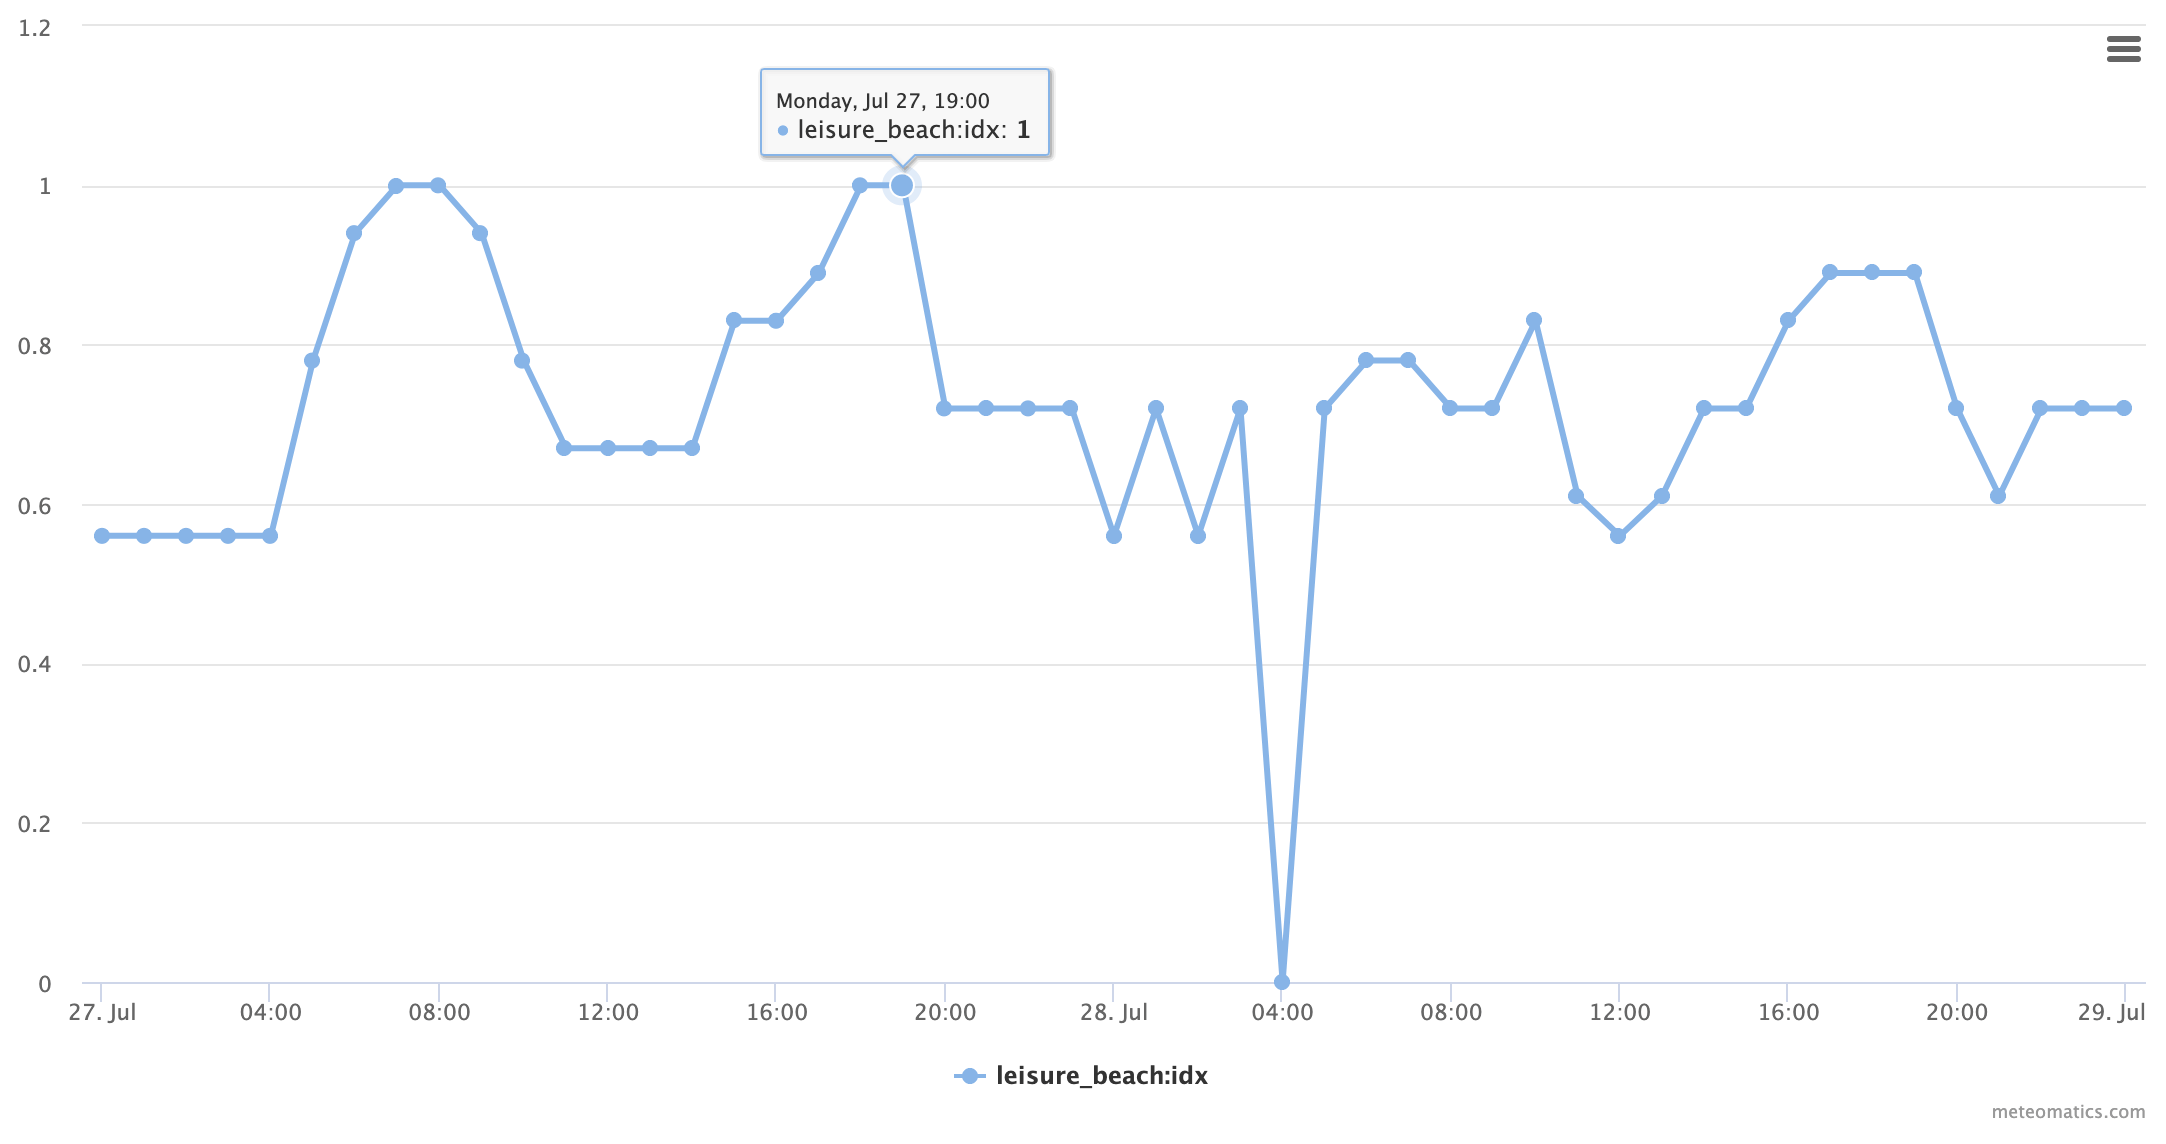
https://api.meteomatics.com/2026-07-24T00:00:00Z--2026-07-27T00:00:00Z:PT1H/leisure_skiing:idx/46.825555,9.813910/htmlCreate a time series of the leisure index for going to the beach in Barcelona:
https://api.meteomatics.com/2026-07-24T00:00:00Z--2026-07-27T00:00:00Z:PT1H/leisure_beach:idx/41.401875,2.215597/htmlCreate a time series of the leisure index for sailing in Nice at Côte D'Azur:
https://api.meteomatics.com/2026-07-24T00:00:00Z--2026-07-27T00:00:00Z:PT1H/leisure_sailing:idx/43.690649,7.264658/htmlCreate a time series of the leisure index for having a BBQ around Zurich:
https://api.meteomatics.com/2026-07-24T00:00:00Z--2026-07-27T00:00:00Z:PT1H/leisure_bbq:idx/47.358222,8.530424/html


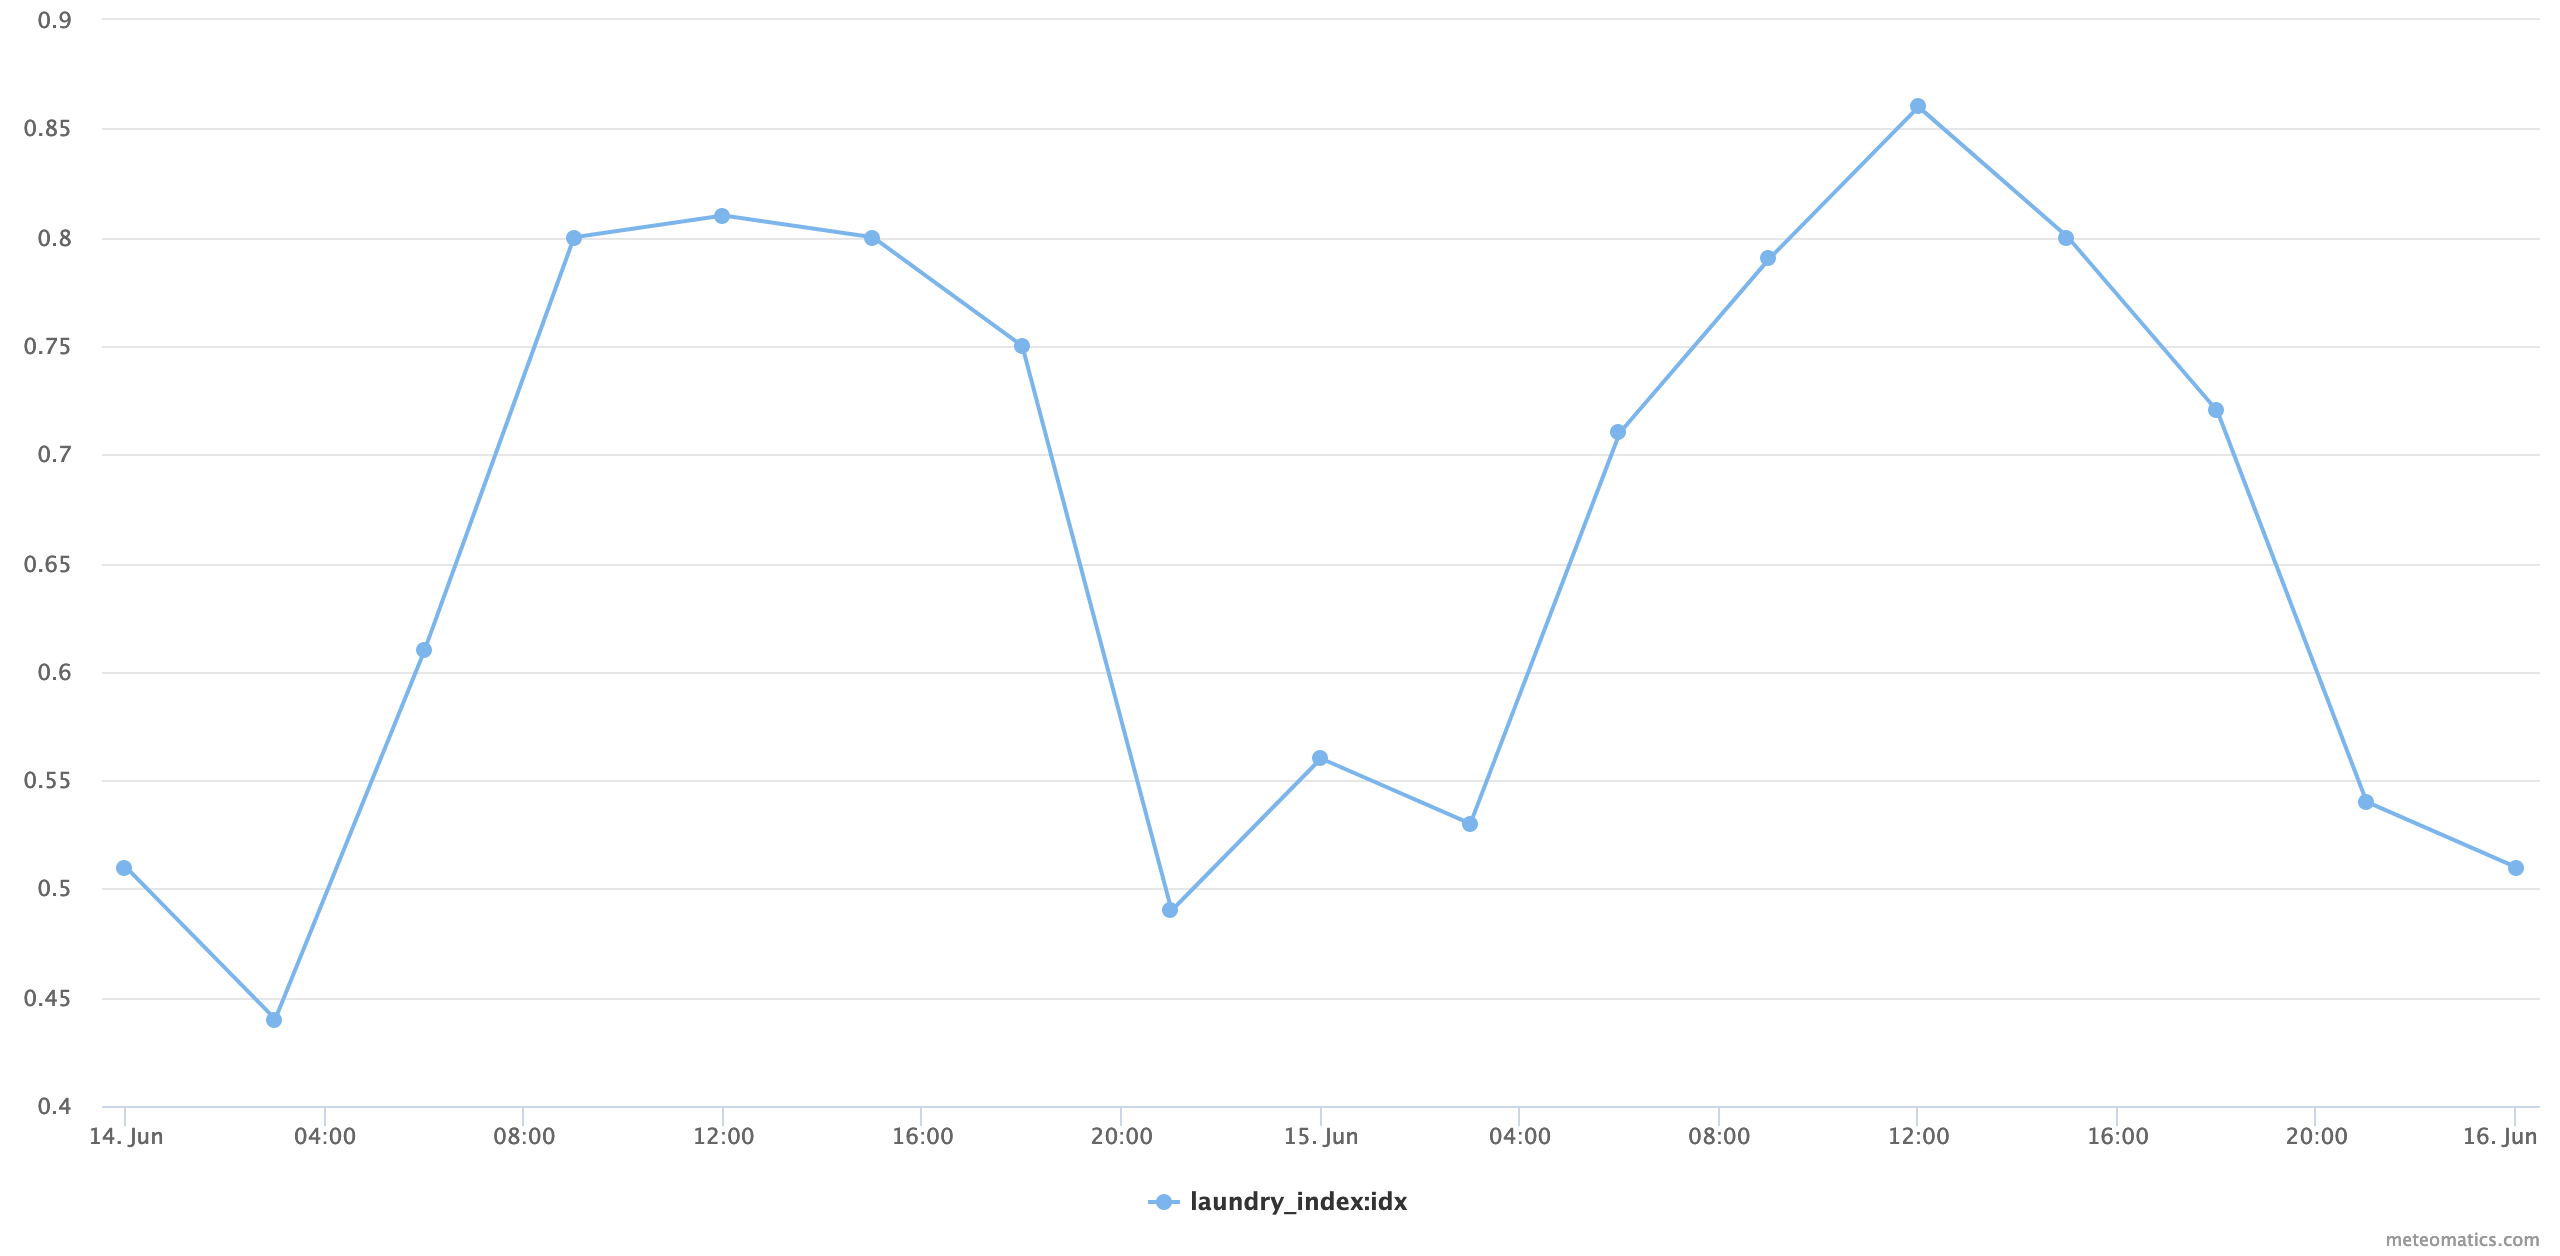
Laundry Index
The laundry index describes how well laundry dries in the air. Values closer to 1 indicate that laundry will definitely dry outside, whereas values towards 0 correspond to laundry that will remain wet.
laundry_index:idxExamples:
-
Time series showing the laundry index for St. Gallen from June 14-16, 2022:
Current time series:
https://api.meteomatics.com/2026-07-24T00:00:00Z--2026-07-26T00:00:00Z:PT3H/laundry_index:idx/47.412164,9.340652/html

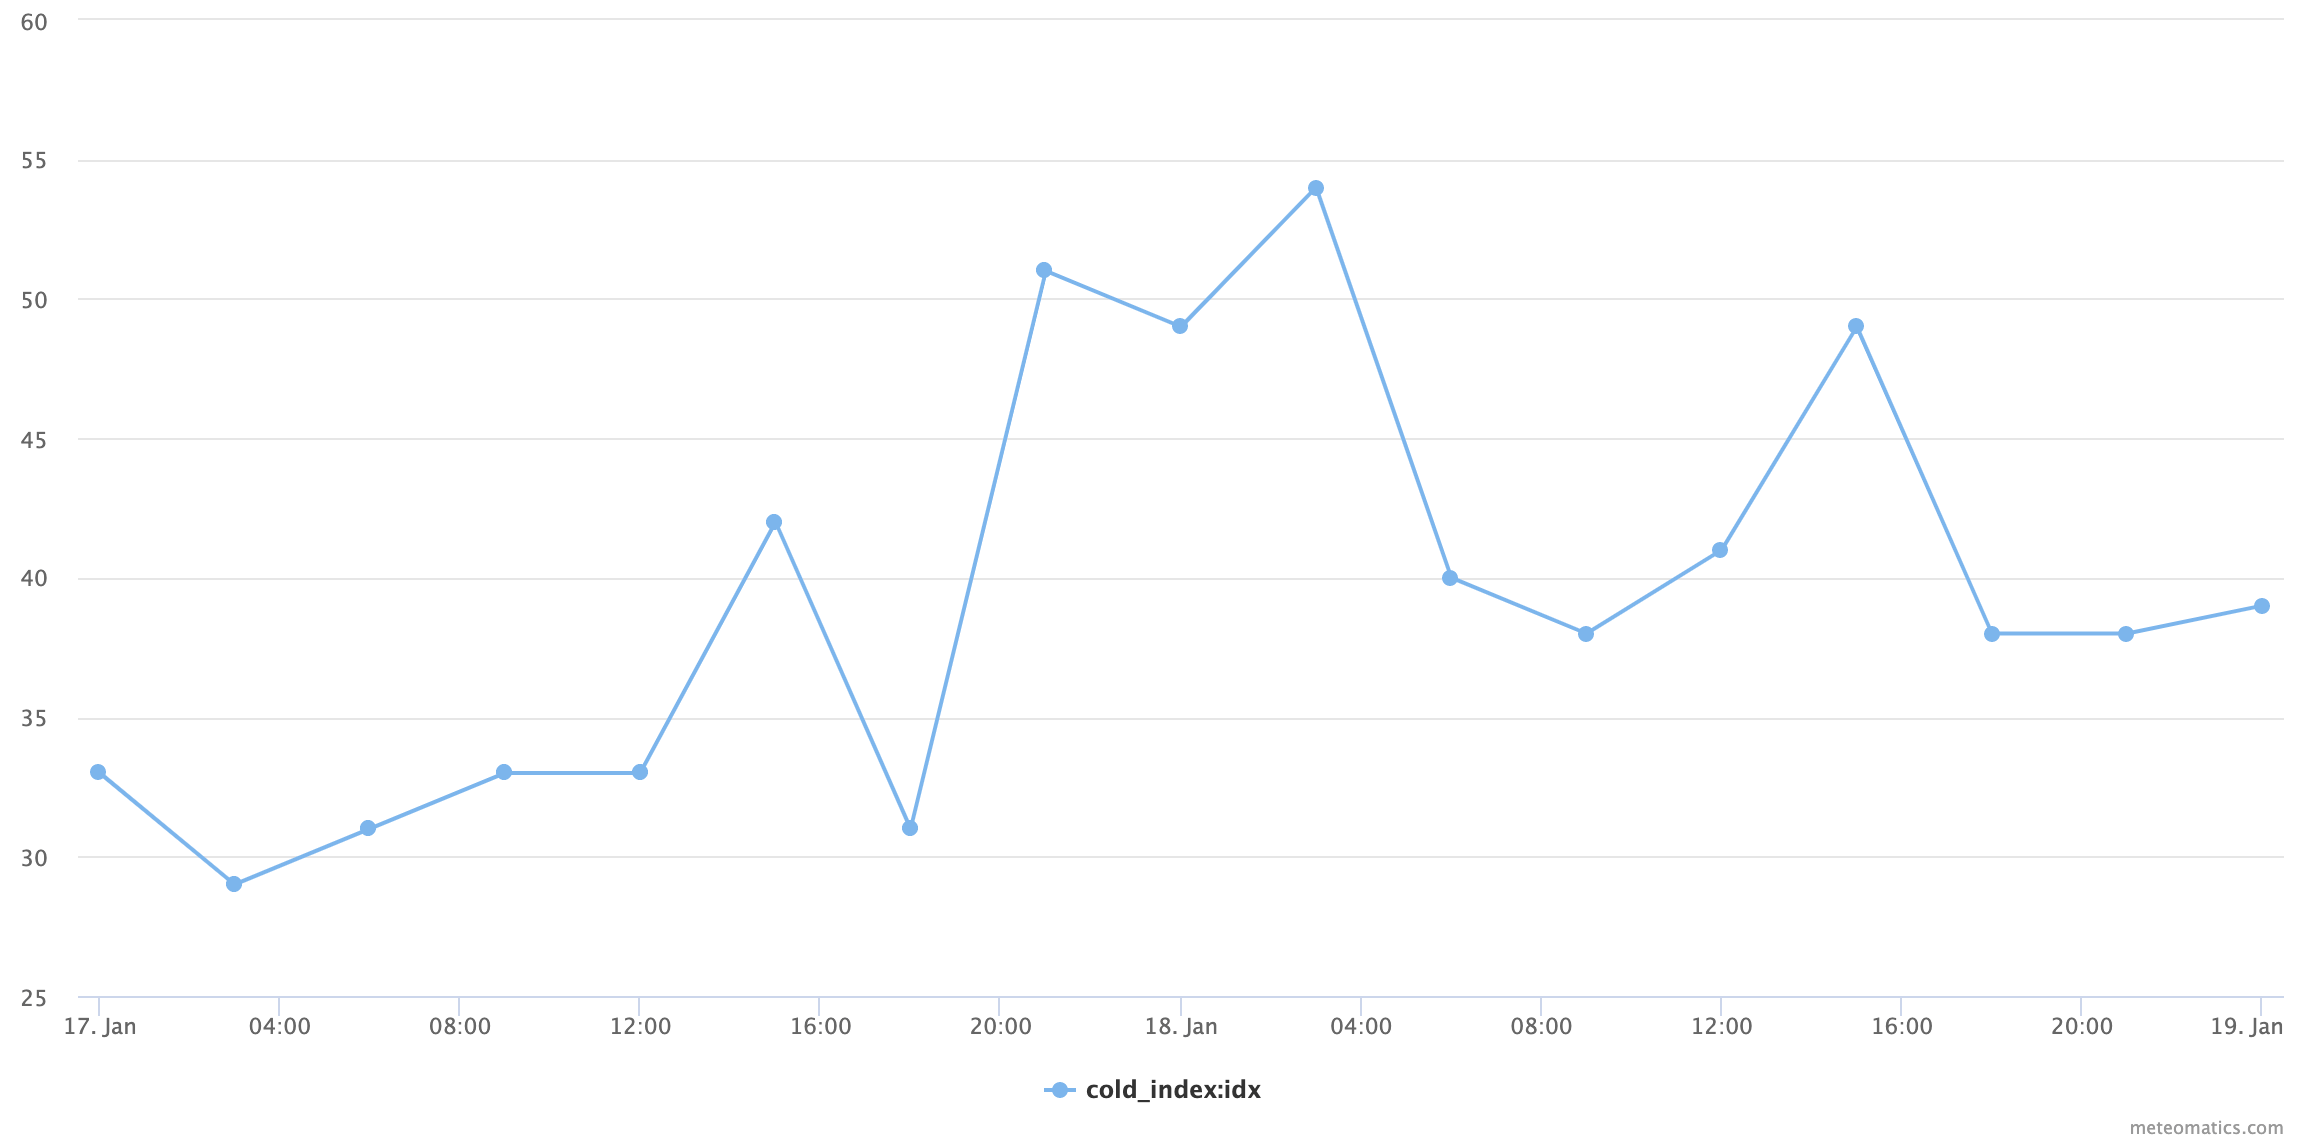
Cold Index
This index combines several weather parameters like temperature, wind speed, humidity and precipitation and assesses how favorable these weather conditions are for catching a cold. The index takes values from 1 to 100, where higher values indicate higher risks.
cold_index:idxExamples:
-
Time series showing the cold index for St. Gallen from the 17th of January 2019 to the 19th of January 2019:
Current time series:
https://api.meteomatics.com/2026-07-24T00:00:00Z--2026-07-26T00:00:00Z:PT3H/cold_index:idx/47.412164,9.340652/html
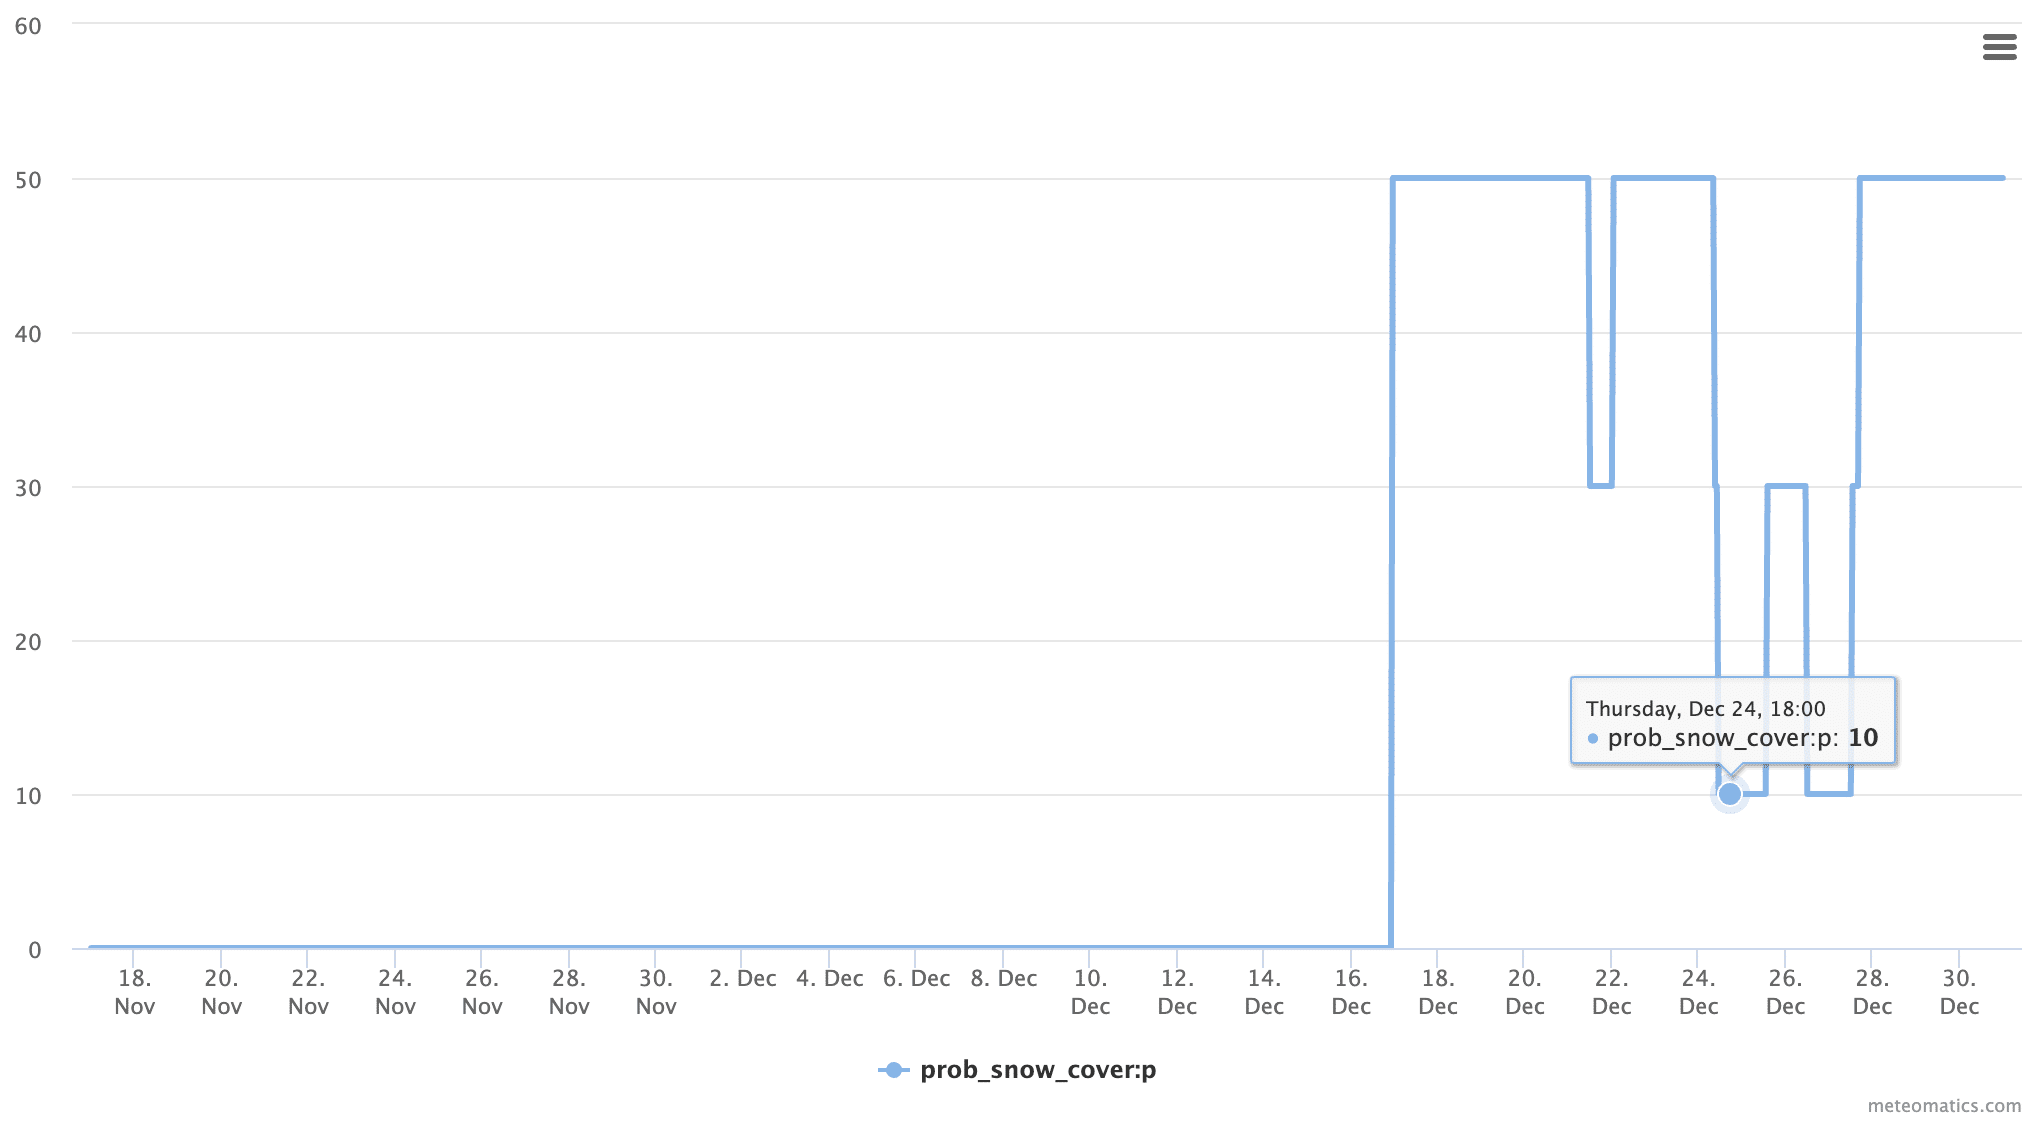
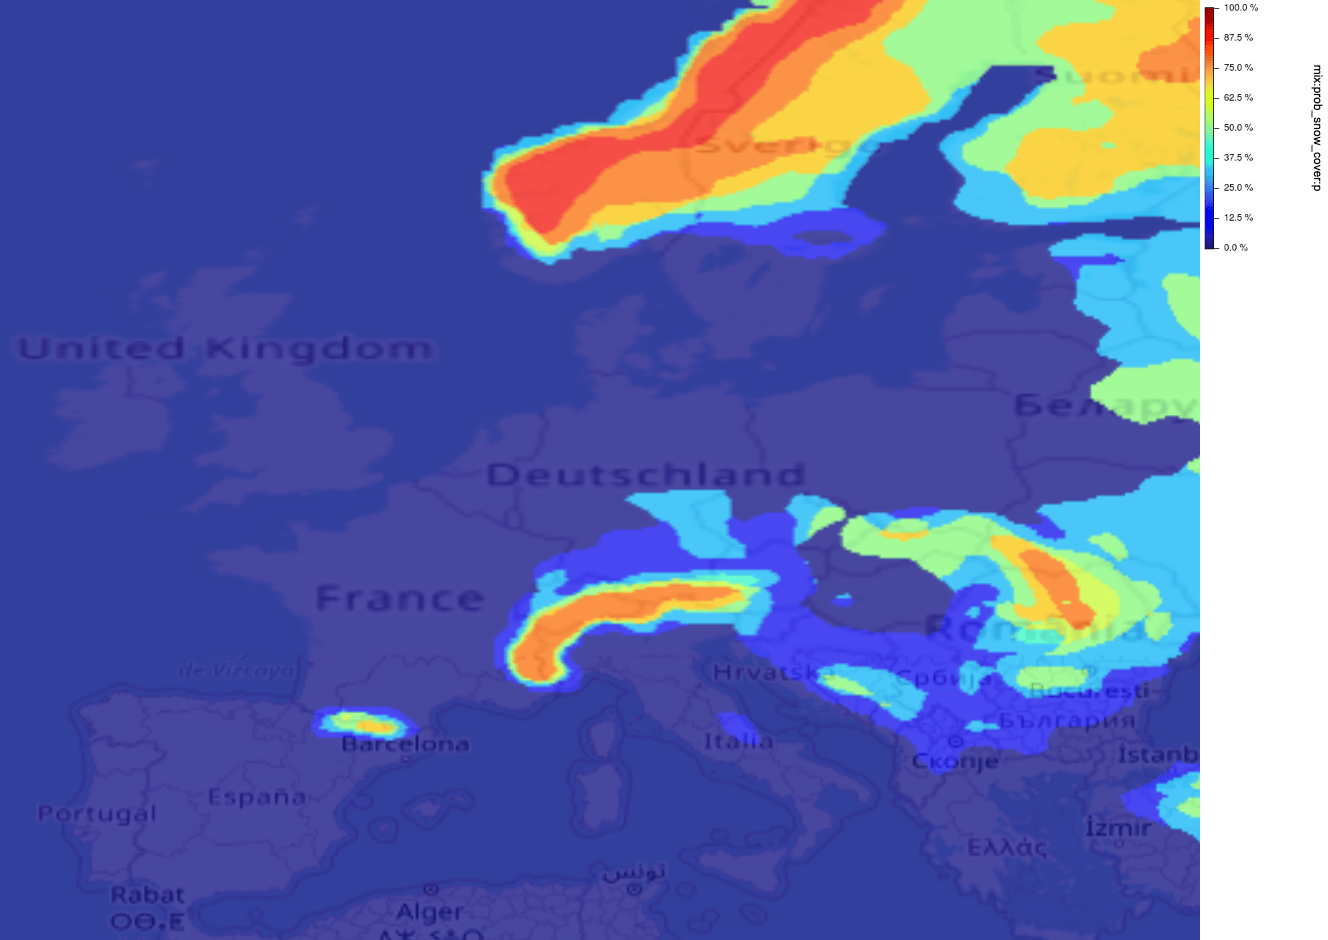
Probability for Snow Cover
Gives the probability for a location/region being covered by snow. The probability is determined by combining information about temperatures at different altitudes and precipitation predictions.
prob_snow_cover:pExamples:
Time series showing the probability for white Christmas in Munich (queried on the 17th of November, 2020):
Current time series for the next 7 days:
https://api.meteomatics.com/2026-07-24T00:00:00Z--2026-07-31T00:00:00Z:PT3H/prob_snow_cover:p/48.9132327,10.5352123/htmlProbability for white Christmas in Europe (queried on the 17th of November, 2020):
Current situation:
https://api.meteomatics.com/2026-07-24T00:00:00Z/prob_snow_cover:p/europe:0.1,0.1/html_map


Probability of Windshield Icing
Gives the probability for the occurrence of windshield icing for cars. This parameter combines information about temperature, humidity, wind speed, radiation and inclination of the windshield and yields a probability in percent (%). It is possible to specify an inclination between 0° (flat) and 90° (vertical) of the windshield - the default value is 50°.
prob_car_windshield_frost_<inclination>d:pExamples:
Time series showing the probability for windshield icing in Zurich for some days of January 2024:
Current time series for the next 7 days in Zurich:
https://api.meteomatics.com/2026-07-24T00:00:00Z--2026-07-31T00:00:00Z:PT1H/prob_car_windshield_frost_0d:p,prob_car_windshield_frost:p,prob_car_windshield_frost_90d:p/47.36667,8.5500/htmlProbability for windshield icing in the UK in January 2024 (this is a map from MetX):


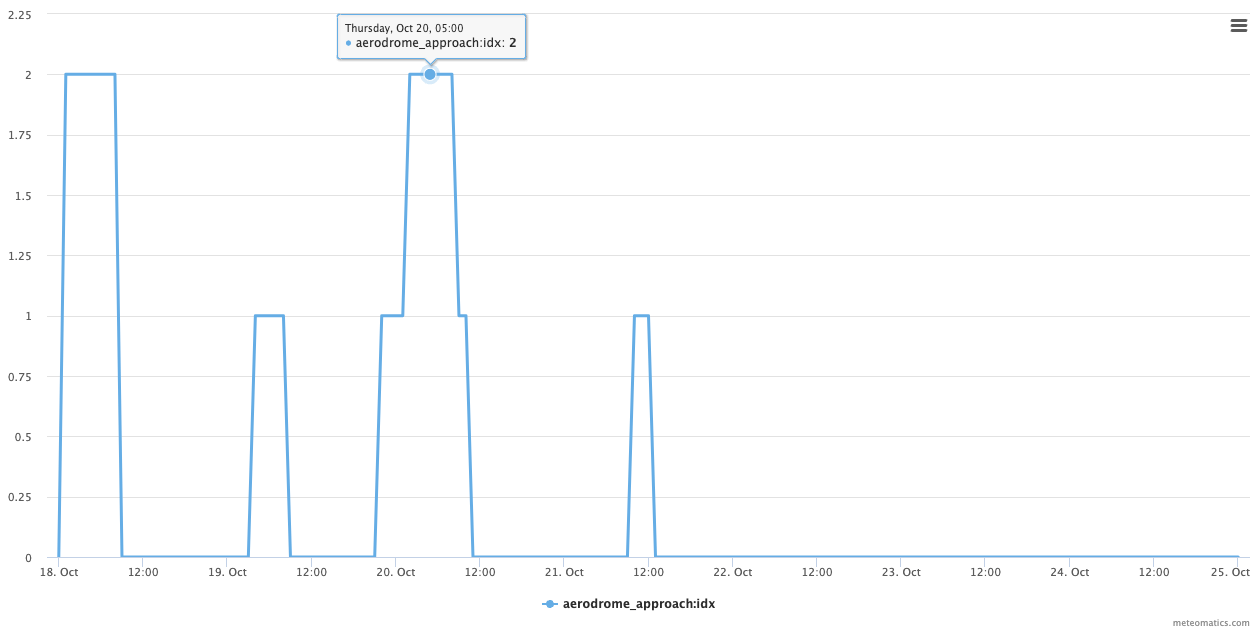
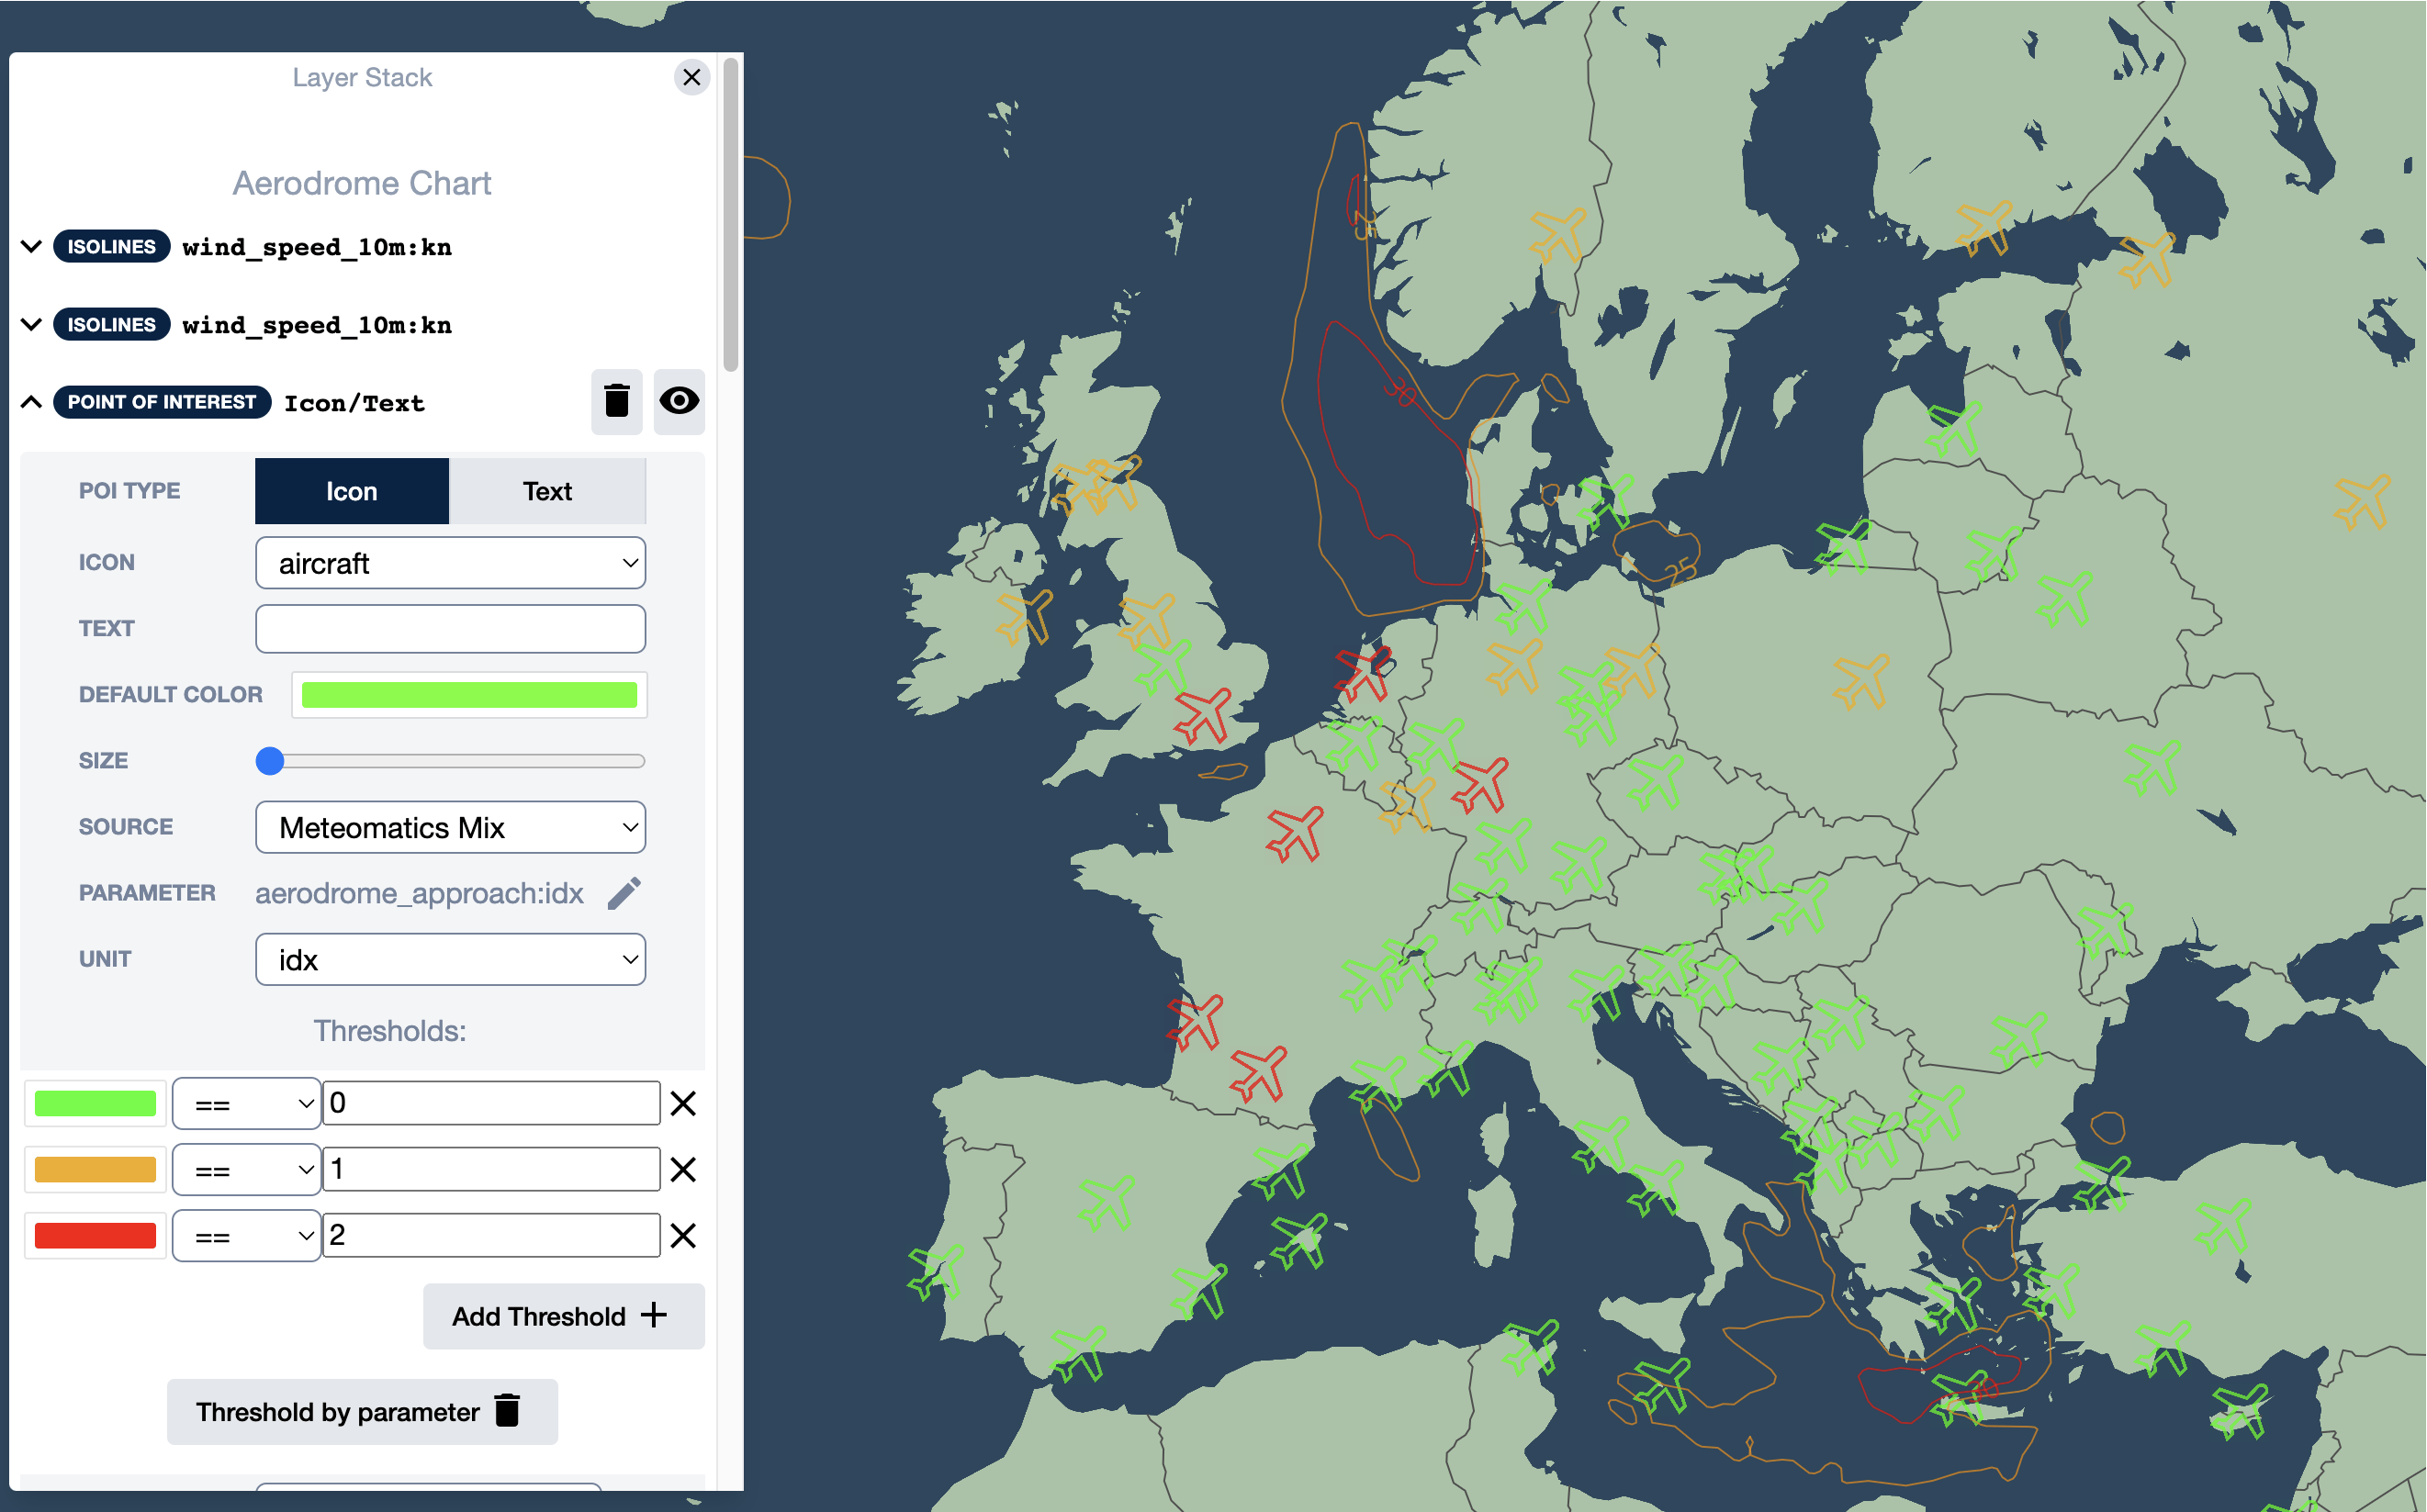
Aerodrome Approach Index
This index gives an indication for significant weather conditions at an airport. The index yields values between 0 and 2. If the index equals 2, conditions are hostile for an aircraft to land. If the index equals 0, no dangerous weather conditions are present.
aerodrome_approach:idxExamples:
Time series showing the evolution of the Aerodrome Approach Index at Zurich airport:
https://api.meteomatics.com/2026-07-24T00:00:00Z--2026-07-31T00:00:00Z:PT1H/aerodrome_approach:idx/47.466004,8.543693/htmlMeteomatics' visualization tool MetX showing aircraft icons on a map colored according to the severity of the Aerodrome Approach Index: